

Abstract
The use of cultured cells has been instrumental in studying biochemical, molecular, and cellular processes. The composition of serum that cells are maintained in can have a profound impact on important cellular checkpoints. We have analyzed cell growth and apoptosis in an estrogen receptor positive breast cancer cell line in the presence of serum that have been treated to remove steroids or lipids, as well-described in the literature. We showed that maintaining cells in the presence of charcoal-dextran-treated serum causes reduced growth rate, which can be reversed by the addition of estradiol. Silica-treated-serum also slowed down cell growth and induced apoptosis. In order to investigate the role of lipids in these phenotypes, we investigated the levels of a wide range of lipids in different sera. We showed that silica-treatment significantly depletes phosphatidylcholines and cholesterol. We also show that lipogenesis is stimulated when cells are cultured with silica-treated-serum and this was reversed by the addition of exogenous lipids, which also restored growth rate and apoptosis. Our results show that cultured cells are sensitive to different serum, most likely due to the differences in levels of structural and signaling metabolites present in their growth environment.
Keywords: charcoal-dextran, lipidomics, serum, silica, SREBP
INTRODUCTION
The use of cell lines, both primary and immortalized, in culture have been the backbone of numerous biological, biochemical, and molecular discoveries. Cell lines are generally cultured in a defined media containing required nutrients, such as glucose, amino acids, and vitamins. Cell culture media is usually supplemented with serum, most commonly fetal bovine serum (FBS), to provide growth factors, lipids, hormones, and additional nutrients. It has been a long-standing practice to deplete/add back various factors from culture conditions in order to study specific biological functions. Serum deprivation or starvation, for example, has long been used to synchronize cell cycle or to investigate signaling pathways activated by individual growth factors when added back to the culture.
Our interest is in estrogen receptor (ER) positive breast cancer and how estrogen controls lipogenesis, or the synthesis of new lipids, which is important for providing dividing cells with lipids for membrane biosynthesis, signaling molecules, and energy. Interestingly, in order to study estrogen action serum is usually stripped of sterols using charcoal-dextran (CD) treatment. This approach was adapted from early studies where CD was utilized to remove free steroids when conducting radioimmunoassays or estrogen receptor binding assays[1, 2]. In addition, phenol red is removed from media as it has been shown to be estrogenic[3]. By depriving cells of estrogens from both serum and media for several days, ER positive breast cancer cells are then highly sensitive to the addition of exogenous estradiol (E2) and the function of ER can be studied.
Similarly, in order to study lipogenesis, lipids are depleted (LD) from serum using various treatments. When cells are cultured in LD-FBS, the major transcriptional regulators of lipid synthesis, sterol regulatory binding proteins (SREBP1 and SREBP2), are activated, thus allowing for the study of lipogenesis[4]. There are two primary methods of removing lipids from FBS to study the regulation of lipogenesis and its role in cell growth and function. The first is lipoprotein-depleted FBS, which can be obtained commercially although can be quite expensive or by differential ultracentrifugation. The second method is to delipidate FBS using bi-phasic extraction or fumed silica precipitation. Again, delipidated FBS is commercially available or can be prepared in a cell culture lab. Diisopropylether/n-butanol bi-phasic extraction of lipids followed by dialysis against phosphate-buffered saline is both labor and time-intensive but, nevertheless, its use is reported in the literature[5]. In contrast, fumed silica treatment of FBS is a simple and inexpensive approach to delipidate FBS. There are number of publications demonstrating the usefulness of this approach[6]. Until now, one of the factors limiting the use of silica to delipidate FBS has been the absence of a systematic study to determine which lipids are being extracted and to what extent, which has been a primary motivator for the proposed study. Given our dual interest in estrogens and lipogenesis, a more exact understanding of how CD and LD treatment affect lipid levels in FBS was needed.
We envisioned that the first step in better understanding how CD and LD treatment of FBS impacts cellular biology and phenotypes is to obtain a comparative understanding in differences in their lipid composition (i.e., the types of lipids that are effectively removed by CD and LD). To achieve this, we employed a mass spectrometry-based lipidomics approach. We first described the phenotypic changes upon culturing MCF-7 (ER+ breast cancer) cells in the presence of three types of serum: fetal bovine serum (Full FBS), fetal bovine serum that was treated with silica (LD-FBS) and charcoal-dextran (CD-FBS). We then analyzed the lipid composition of Full-FBS, LD-FBS and CD-FBS. We reasoned that linking the lipid depletions we identified by mass spectrometry in LD-FBS and CD-FBS to phenotype would be instrumental in explaining the difference in cell growth patterns we observed. We found that culturing MCF-7 cells in LD-FBS and CD-FBS resulted in reduced cellular growth and induced apoptosis. The decrease in cell growth was rescued by the addition of E2 in CD-FBS but not in LD-FBS. We found that LD treatment resulted in drastic depletions of multiple lipid species, including cholesterol and phosphatidylcholines. Decreased cell proliferation and apoptosis observed in LD was rescued by the addition of exogenous lipids. We also found that LD-FBS activates SREBP, based on expression of target genes. Overall, our results show that LD treatment is more effective in reducing the lipid levels as compared to CD and can be used to study the role of lipogenesis.
MATERIAL AND METHODS
Reagents.
13C18 Oleic acid, dehydroergosterol and C39:0 TAG were purchased from Sigma. C17:0 ceramide and d70 DSPC were purchased from Avanti lipids. LC-MS columns were obtained from Phenomenex. Chemically defined lipid supplement was purchased from ThermoFisher Sci (cat 11905031). The lipid supplement contains 8 different fatty acids with fatty acyl chain lengths ranging from C14-C20 (one of them being 2 mg/L; the rest of them are 10 mg/L) and cholesterol (220 mg/L) and was used at a final concentration of 1% in culture media. All other reagents were from Sigma-Aldrich.
Cell lines and cell culture.
Human MCF-7 cells were kindly provided by Dr. Donald McDonnell (Duke University). Cells were maintained in Roswell Park Memorial Institute (RPMI) media supplemented with 1% non-essential amino acids, 2 mM L-glutamine, 1% penicillin-streptomycin and 10% of corresponding fetal bovine serum (FBS) at 37 °C in 5% CO2. Cell line authentication was routinely performed using short tandem repeat methodology. Cells were routinely evaluated for mycoplasma contamination.
Delipidation of serum (LD-FBS).
Lipid depletion was performed by adding fumed silica (Sigma, S5130, 20 g/L) to FBS followed by mixing overnight, centrifugation, and sterile filtration[7].
Charcoal-Dextran stripping of serum (CD-FBS).
Activated charcoal (Fisher Chemicals, D127–500, 10g/L) and Dextran (Sigma, D8821, 1g/L) was added to FBS followed by mixing at 56 °C for 45 min and centrifugation at 4000 rpm for 20 min. A second treatment with charcoal and dextran was performed followed by sterile filtration[1]. During charcoal dextran stripping of FBS, heat inactivation at 56 °C was conducted, which is a standard procedure for preparation of CD-FBS to inactivate compliment proteins[8].
Proliferation and apoptosis Assays.
Cell confluency and apoptosis analyses were performed using a Celigo Image Cytometer (Nexcelom Bioscience). Caspase activity was measured by ViaStain™ Live Caspase 3/7 Detection kit (Nexcelom). Results were expressed as a percent of Caspase positive cells relative to number of total cells.
RNA isolation and RT-QPCR.
Total RNA was isolated using Trizol according to the manufacturer’s instructions (Ambion). RNA was isolated and RT-QPCR performance as previously published[9]. Primer sequences are available upon request. Fold change was calculated using the ΔΔCt method. 36B4 was used as the internal control.
Lipid extraction.
200 μL of FBS, CD or LD was placed in 1.8 mL of PBS. This was then mixed with 4 mL of chloroform (B&J brand, Honeywell) and 2 mL of MeOH (LC-MS grade, Omnisolv, EMD Millipore). The final ratio of Serum:PBS:MeOH:CHCl3 is 0.1:0.9:1:2. This mixture was vortexed for ten seconds and allowed to settle (the procedure was repeated three times per sample). The sample was then centrifuged and the organic layer was recovered, from which 3 mL were taken and dried under vacuum. Finally, all the samples were resuspended in 150 μL of chloroform. The experiments were carried out in triplicates.
LC-MS analysis.
LC-MS analysis was carried out as we described in the past[9, 10]. Methanol (LC-MS grade, Omnisolv) and isopropanol (HPLC grade, Omnisolv) were EMD Millipore brand, and purchased through VWR. Water was obtained from a Milli-Q water purification system. (18.2 МΩ.cm) Briefly, LC-MS runs were performed using LC-ESI-QTOF (Agilent 1260 HPLC coupled to Agilent 6530 Accurate-Mass Quadrupole Time-of-Flight, Agilent Technologies, Santa Clara, CA, USA). The ESI source used was a Dual AJS fitted electrospray ionization (ESI). A capillary voltage of 3500 V and a fragmentor voltage of 175 V was used. Drying gas had a flow rate of 12 L/min and was set to a temperature of 350 °C. Data was collected using an m/z range of 50–1700 in extended dynamic range. For chromatographic separation, in negative electrospray mode a Gemini C18 reversed-phase column (5 μm, 4.6 mm×50 mm) with a C18 reversed-phase guard cartridge was used and in positive electrospray mode, a Luna C5 reversed phase column (5 μm, 4.6 mm x 50 mm, Phenomenex) with a C5 reversed-phase guard cartridge was used. For both positive and negative mode mobile phase A was 95:5 water:methanol (v/v) and mobile phase B was 60:35:5 isopropanol:methanol:water (v/v). The mobile phases for negative detection were supplemented with 0.1% (w/v) ammonium hydroxide and the mobile phases for positive detection were supplemented with 0.1% (v/v) formic acid and 5 mM ammonium formate. The LC gradient started after 5 minutes at 0% B with a flow rate of 0.1 mL/min and then increased to 100% B over 40 minutes with a flow rate of 0.5 mL/min.
Targeted analysis.
For targeted analysis in total lipid extracts, the corresponding m/z’s for each ion were extracted in Agilent MassHunter Qualitative Analysis (version B.06.00, Agilent Technologies). Peak areas for each ion were manually integrated and were represented as abundances. Blank subtraction was performed to these raw abundances when necessary. Relative abundances used in heatmaps (Figure 3) were calculated by dividing the abundance of one lipid species in three conditions by the average abundance of that species in Full FBS samples such that Full FBS abundances represent a relative abundance of 1 in the heatmap.
Figure 3. Analysis of different lipid species from major lipid families in non-treated (FBS), charcoal-treated (CD), and silica-treated (LD) serum samples.

Internal lipid standards, C39:0 triacylglycerol (C39-TAG), d70-diC18:0 phosphatidylcholine (d70-DSPC), dehydroergosterol, C17:0 ceramide (C17-Cer) and 13C18 oleic acid were spiked to samples prior to lipid extraction. The abundances of internal standards and endogenous lipid species were then analyzed by LC-MS. The abundances of endogenous lipid species were corrected using the internal lipid standards. Relative abundances shown in the heatmap were calculated as [corrected abundance of a lipid in one condition]/[average corrected abundance of the lipid in Full FBS] (see Materials and Method, Targeted analysis section for details). FA, fatty acid; Cer, ceramide; Dihydrocer, dihydroceramide; PC, phosphatidylcholine; TAG, triacylglycerol. n=3.
LC-MS/MS analysis.
Fragmentation patterns were observed at different collision energies of 15, 35, and 55 V. The fragmentation patterns of species of interest from the profiling experiments were confirmed using lipid standards.
Percent recoveries of lipid internal standards.
Two sets of samples were spiked with internal standards and then analyzed to calculate percent recoveries of them. We note that internal standards were spiked to these two sets of samples at different concentrations (20X) based on the volume information described in “lipid extraction” in Material and Methods. In the first set (pre-spiked samples), different serum samples (n=3 for each condition) were spiked with 0.025 µM of 13C18 oleic acid and C17:0 ceramide, 0.05 µM of d70 DSPC and C39:0 TAG and 0.25 µM of dehydroergosterol and extracted as described above. In the second set (post-spiked samples), different serum samples (n=3 for each condition) were extracted as described and resuspended in known concentrations of different lipid standards (0.5 µM of 13C18 oleic acid and C17:0 ceramide, 1 µM of d70 DSPC and C39:0 TAG, 5 µM of dehydroergosterol). Samples were analyzed as described above. The injection volume was 10 μL for each sample. Extracted ion chromatograms (EICs) of 13C18 oleic acid ([M-H]- m/z=299.3090), C17:0 ceramide ([M-H]-m/z=550.5205), d70 DSPC (the most abundant signal is from d68 DSPC ([M+H]+ m/z=859.0589), C39:0 TAG ([M+NH4]+ m/z=698.6293), dehydroergosterol ([M+H-H2O]+ m/z=377.3203), each extract were manually integrated. The percent recovery was calculated as [abundance in post-spiked samples/ abundance in pre-spiked]*100.
Lipid Assignments.
RT corresponds to retention time.
i). Standards.
C16:0-ceramide. RT 45.9. [M-H]- m/z: observed 536.4981; theoretical 536.5048. Observed fragments: 237.2196, 280.2620, 254.2460, 296.2555, 488.4770.
C16:0-dihydroceramide. RT 46.4. [M-H]- m/z: observed 538.5132; theoretical 538.5205. Observed fragments: 239.2371, 282.2787, 254.2477, 296.2564, 490.4931.
TAG(13:0/13:0/13:0). RT 45.7. [M+NH4]+ m/z: observed 698.6358; theoretical 698.6293. Observed fragments: 197.1935, 467.4123.
PC(16:0/18:1). RT 42.1. [M+H]+ m/z: observed 760.5863; theoretical 760.5851. Observed fragments: 184.0779, 496.3480, 577.5164.
Cholesterol. RT 40.2. [M+H-H2O]+ m/z: observed 369.3575; theoretical 369.3516. Observed fragments: 81.0733, 109.1012, 135.1178, 147.1192, 203.1819, 215.1803, 233.2336, 243.2029, 247.2369, 257.2261, 259.2442, 287.2686.
ii). Identification of species from targeted analysis.
Fragmentation information of two or three representative species from each family is shown.
C16:0-ceramide. RT 45.9. The compound was assigned based on the fragmentation pattern found by the ceramide standard. [M-H]- m/z: observed 536.5083; theoretical 536.5048. Observed fragments: 237.2227, 254.2484, 280.2647, 296.2579, 488.4797, 506.4944.
C24:0-ceramide. RT 50.3. The compound was assigned based on the fragmentation pattern found by the ceramide standard. [M-H]- m/z: observed 648.6270; theoretical 648.6300. Observed fragments: 237.2223, 349.3453, 392.3878, 600.6036, 618.6161.
C20:0-dihydroceramide. RT 48.5. The compound was assigned based on the fragmentation pattern found by the dihydroceramide standard. [M-H]- m/z: observed 594.5852; theoretical 594.5831. Observed fragments: 239.2351, 282.2802, 300.2922, 310.3105, 336.3240, 546.5561.
C24:0-dihydroceramide. RT 50.6. The compound was assigned based on the fragmentation pattern found by the dihydroceramide standard. [M-H]- m/z: observed 650.6401; theoretical 650.6457. Observed fragments: 239.2422, 366.3676, 392.3879, 602.6237, 618.6226.
C48:1-triacylglycerol. RT 47.3. The compound was assigned based on the fragmentation pattern found by the triacylglycerol standard. [M+NH4]+ m/z: observed 822.7553; theoretical 822.7545. Observed fragments: 237.2224, 239.2345, 551.5055, 549.4902.
C52:2-triacylglycerol. RT 47.4. The compound was assigned based on the fragmentation pattern found by the triacylglycerol standard. [M+NH4]+ m/z: observed 876.8114; theoretical 876.8015. Observed fragments: 239.2425, 265.2647, 577.5202, 603.5477.
C56:4-triacylglycerol. RT 47.8. The compound was assigned based on the fragmentation pattern found by the triacylglycerol standard. [M+NH4]+ m/z: observed 928.8383; theoretical 928.8328. Observed fragments: 267.2609, 287.2402, 607.5729, 627.5421.
C32:0-phosphatidylcholine. RT 41.4. The compound was assigned based on the fragmentation pattern found by the phosphatidylcholine standard. [M+H]+ m/z: observed 734.5636; theoretical 734.5694. Observed fragments: 184.0751, 478.3329, 496.3373, 551.5079.
C36:2-phosphatidylcholine. RT 42.2. The compound was assigned based on the fragmentation pattern found by the phosphatidylcholine standard. [M+H]+ m/z: observed 786.5964; theoretical 786.6007. Observed fragments: 184.0813, 504.3491, 522.3605, 603.5394.
C40:4-phosphatidylcholine. RT 42.9. The compound was assigned based on the fragmentation pattern found by the phosphatidylcholine standard. [M+H]+ m/z: observed 838.6285; theoretical 838.6320. Observed fragments: 184.0787, 506.3569, 524.3685, 554.3639, 572.3662, 655.5576, 779.5633.
Cholesterol. RT 40.2. The compound was assigned based on the fragmentation pattern found by the cholesterol standard. [M+H-H2O]+ m/z: observed 369.3575; theoretical 369.3516. Observed fragments: 81.0706, 109.1035, 133.1016, 147.1223, 203.1819, 215.1827, 233.2195, 243.2066, 257.2261, 259.2455, 287.2862.
RESULTS
Breast cancer cell response to serum treatments.
MCF-7 cells typically proliferate well in RPMI supplemented with 10% Full FBS, and addition of E2 has little effect (Fig. 1A, left panel). When cells are with 10% CD-FBS, the growth rate is slowed but can be stimulated by addition of E2 (Fig. 1A, middle panel). However, when cells are cultured in 10% LD-FBS, the reduced growth rate can no longer be rescued by E2 (Fig. 1A, right panel). In addition, apoptosis is significantly increased in cells cultured with LD-FBS (Fig. 1B). These finding suggest that, as expected, charcoal-dextran treatment removes estrogens present in the serum that can activate ER, and that exogenous E2 is needed to stimulate cell growth. In contrast, lipid depletion removes critical survival factors from the serum and that addition of E2 cannot overcome this insufficiency to promote growth.
Figure 1. Serum extractions affect breast cancer cell proliferation, apoptosis, and response to estradiol (E2).
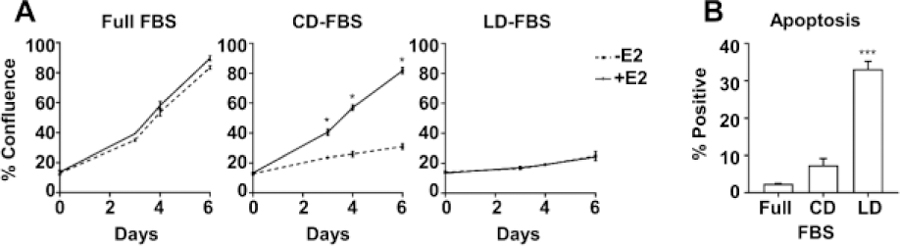
MCF-7 cells were cultured in full FBS, CD-FBS, or LD-FBS in the absence or presence of E2 (10 nM). (A) Confluency of cells was measured over 7 days of culture using a Celigo Imaging Cytometer (Nexcelon). (B) Apoptosis was measured using CellEvent Caspase 3/7 Green Detection Reagent. * P<0.05; *** P<0.001, t-test was used for comparing –E2 vs +E2 for each serum condition for each day in (A), ANOVA followed by Dunnett’s multiple comparisons test was used for (B).
Extraction efficiencies of lipid standards for LC-MS analysis of different serum samples.
Based on the differential growth profiles and apoptotic activity observed in cells cultured in Full FBS, LD-FBS and CD-FBS, we investigated the lipid content of these different sera. In order to ensure lipids were extracted unambiguously from different serum samples, we investigated the extraction efficiencies of five non-endogenous lipid internal standards using LC-MS. These lipid standards represented the lipid families that we aimed to analyze in this study. Specifically, we spiked our samples with five internal standards either before lipid extraction (pre-spiked) or after lipid extraction, during resuspension (post-spiked). To extract lipids, we used a modified Folch method[11] [12], where 1.8 mL of PBS was added to 200 μL of serum samples, and then mixed with 4 mL of chloroform and 2 mL of methanol. After LC-MS analysis, we compared the abundances of these lipid standards in pre-spiked and post-spiked samples. Figure 2A represents the percent recovery of each lipid standard from different serum samples. We observed 18–29% difference in extraction efficiencies for dehydroergosterol and C39:0 triacylglycerol (TAG) between different serum samples: extraction efficiencies for C39:0 TAG ranged between 61% (Full FBS) and 43% (CD- and LD-FBS), and the extraction efficiencies for dehydroergosterol were 80% (Full FBS), 52% (LD-FBS) and 57% (CD-FBS). All the other lipid standards we tested exhibited 13% or less difference in extraction efficiency. These results suggest that the method we used for extracting lipids for mass spectrometry-based measurement is suitable for the analysis of lipids in different serum samples.
Figure 2. Extraction of lipids from different serum types.
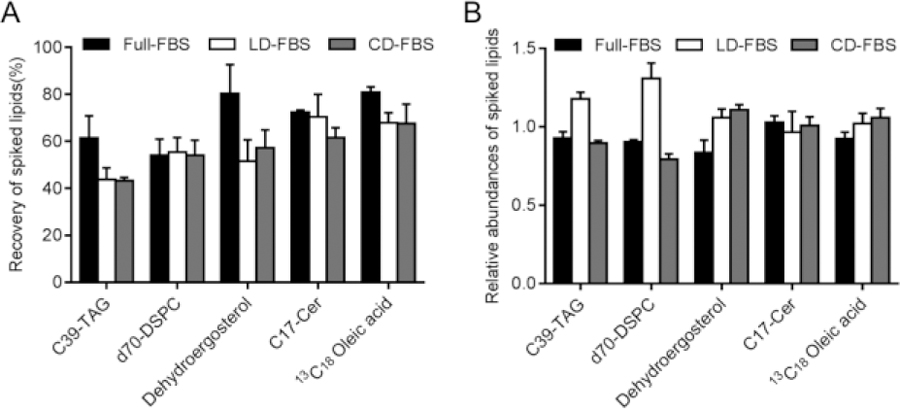
(A) Percentage recovery of spiked lipids in non-treated (FBS), charcoal-treated (CD), and silica-treated (LD) serum samples. Internal lipid standards, C39:0 triacylglycerol (C39-TAG), d70-diC18:0 phosphatidylcholine (d70-DSPC), dehydroergosterol, C17:0 ceramide (C17-Cer) and 13C18 oleic acid were spiked to samples either prior to lipid extraction or after lipid extraction/prior to LC-MS injection. Percentage recovery is calculated as [abundance of lipids spiked before extraction]/[ abundance of lipids spiked after extraction] *100%. n=3. (B) Relative abundances of spiked lipids in post-spiked samples. Internal lipid standards were spiked after lipid extraction, and their abundances were analyzed by LC-MS. Relative abundances are calculated as [average abundance of a lipid in one condition]/[average abundance of the lipid among all the conditions], n=3.
In order investigate the matrix effect for the different serum samples, we further compared the abundance of the lipid internal standards in different post-spiked samples (i.e., samples that were spiked with internal standards after extraction). Figure 2B represents the relative abundance of each lipid internal standard in three different serum samples. The relative abundance of dehydroergosterol, C17:0-Ceramide and 13C18 oleic acid varied at most up to 25% in lipid extracts from FBS, LD and CD serum samples. TAG and phosphatidylcholine (PC) also showed a low variation in FBS and CD samples (≤12%); however, they both exhibited 21–39% increase in LD-FBS samples as compared to CD-FBS and Full-FBS. We reason that these variabilities are due to differences in the ionization efficiencies of lipids standard due to the matrix effect.
Analysis of lipids in different serum samples.
We extracted lipids from FBS, CD-FBS and LD-FBS samples with three replicates each, and analyzed lipid species in positive and negative ionization mode using LC-Q-ToF MS as we described previously[10]. We targeted species from major lipid families including fatty acids, diacylglycerols, triacylglycerols, glycerophospholipids (i.e., phosphatidic acids, phosphatidylserines, phosphatidylglycerols, phosphatidylinositols, phosphatidylcholines), sphingolipids (i.e. ceramides and dihydroceramides) and sterols. Among the different species we targeted, we detected fatty acids, PCs, ceramides, dihydroceramides, triacylglycerols and cholesterol in at least one group of the serum samples. Figure 3 represents the relative abundances of the lipids we detected. Upon silica treatment (LD-FBS), fatty acids did not exhibit any significant change. Ceramides, dihydroceramides, PCs, TAGs and cholesterol, on the other hand, were strongly depleted. One unexpected finding was the slight accumulation of several fatty acids and ceramides in CD-FBS samples. One potential reason for this accumulation could be contamination, potentially from charcoal and/or dextran, strongly supporting the need for comprehensive lipid analysis methods in manipulating the composition of serum for cell biology-based experiments. We have included major lipid families in our targeted analysis; however, we note that our interpretations are limited based on the lipid species we targeted and we cannot rule out the involvement of other bioactive lipids in the reduced proliferation rates that we observe in CD-FBS and LD-FBS (Figure 1).
Lipids precipitate or form aggregates in aqueous solution, which facilitates their interaction with silica[13]. Based on this, we attribute the different removal between fatty acids and other lipid families to their difference in solubility, aggregation properties in solution and their interaction with silica. This is consistent with the enhanced ionizations efficiencies we observed for TAG and PC standards that we present in Figure 2B, where the removal of hydrophobic species upon silica treatment results in a less complex matrix and enhances ionization of these spiked standards. CD treatment did not seem to remove any lipid species. It should be noted that neither CD nor LD treatment affected protein levels in the serum (37±0.7, 36±1.2, and 35±0.9 mg/ml for Full FBS, CD-FBS, and LD-FBS, respectively).
The lipid analysis showed that cholesterol was not removed in CD-FBS (Figure 3). To investigate if CD treatment is efficient in eliminating sterols present in the serum, we spiked Full FBS with a non-endogenous sterol lipid, ergosterol (Figure 4A, labeled as “-CD”) and treated this with CD (labelled as “+CD”). We then analyzed the levels of ergosterol and cholesterol from these two conditions. We observed a significant and profound decrease (~3 fold) in ergosterol level, while there was no change in the level of cholesterol after CD treatment (Figure 4B and 4C). This results strongly supports that charcoal-dextran treatment is not effective in removing cholesterol that is present in Full FBS. We hypothesize that this could be due to majority of cholesterol is in complex with lipoproteins and as such, not accessible for charcoal-dextran interactions.
Figure 4. Cholesterol levels in CD-FBS.
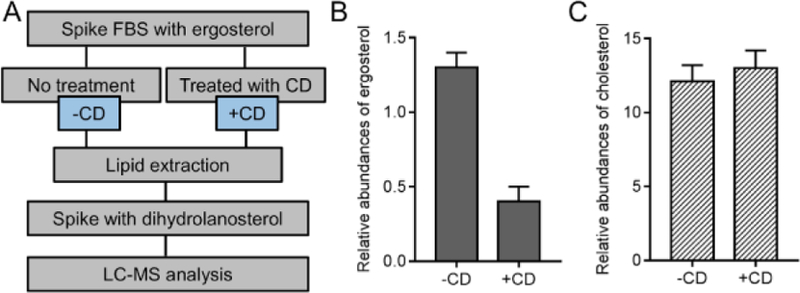
(A) Scheme of charcoal treatment for serum sample. Serum sample was spiked with ergosterol, and went through either charcoal treatment (labeled as “+CD) or no treatment (labeled as “-CD”). Then lipids were extracted and analyzed by LC-MS. Lipid extracts were spiked with dihydrolanosterol as internal standard prior to LC injection. (B and C) Change of ergosterol (B) and cholesterol (C) in serum samples after charcoal treatment. Relative abundances of ergosterol/cholesterol is calculated as [abundances of ergosterol/cholesterol in -CD or +CD condition)]/[abundances of internal standard dihydrolanosterol in -CD or +CD condition]. n=3.
Lipid supplement recovers cell growth in cells maintained in LD-FBS.
Our lipid analysis shows that LD-FBS has a significantly reduced lipid content. In order to investigate if altered lipid content is responsible for the reduced growth rate and increased apoptotic activity in cells maintained in LD-FBS containing media, we added a chemically defined lipid supplement (LS) to LD-FBS. We found that both cell growth (Fig. 5A) and apoptosis (Fig. 5B) were rescued. Intriguingly, lipogenesis appears to be stimulated in delipidated media and inhibited by addition of LS, based on expression of SREBP1 target genes (Fig. 5C). Overall, these findings strongly suggest that the loss of lipids upon lipid depletion is responsible for reduced growth and increased apoptosis.
Figure 5. Addition of a lipid supplement (LS) reverses the effect of lipid depletion and modifies SREBP activity.
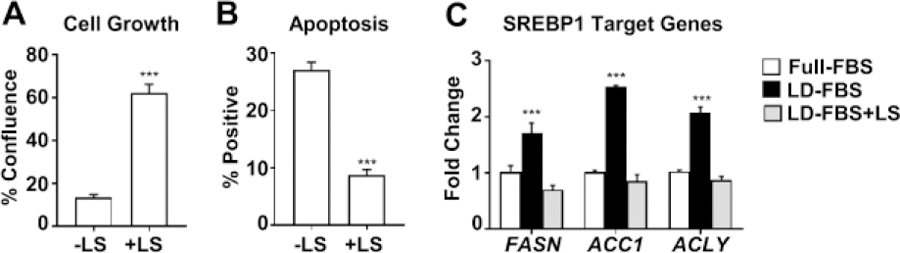
Cells were treated as in Figure 1 with the addition of 1% chemically defined lipid supplement (LS) as described in Materials and Methods. Confluency (A) and apoptosis (B) was measured as in Figure 1. (C) SREBP1 target genes were measured by QPCR. *** P<0.001, t-test was used for comparing –LS and +LS for A and B. ANOVA followed by Dunnett’s multiple comparisons test was used for C (each gene was analyzed individually).
DISCUSSION
Previous studies have utilized CD treatment as a method to remove free sterol and sterol-derived metabolites from different solutions[1, 2]. Our results suggest that charcoal-dextran treatment effectively removes a sterol standard that is spiked Full FBS (ergosterol); however, it is ineffective in removing cholesterol that is present in the serum. We reason that this is due to the fact that CD may only interact and remove free sterols (e.g. cholesterol) and steroids from Full FBS, and because cholesterol in present as a complex with other proteins in Full FBS, the interaction between cholesterol and CD is ineffective.
The decrease in growth rate and enhanced apoptotic activity we observed in cells that are cultured in LD-FBS serum, can be rescued by the addition of a defined lipid supplement to the growth medium. This lipid supplement is mostly composed of different fatty acids and cholesterol. The compositional analysis of LD-FBS shows a strong depletion in lipids, specifically in cholesterol and PCs (Figure 4). Cholesterol and PCs are important structural components of cellular membranes and their sustained levels are necessary for cellular growth/proliferation[14]. Based on this we speculate that the rescue we observe upon addition of LS is due to the increased availability of building blocks for the synthesis of other lipids such as cholesterol and PCs. However, it is important to note that other bioactive lipids that signal cell growth could also be affected by LS addition[15].
As expected, we found that lipogenesis is stimulated upon lipid removal from serum (LD-FBS), based on the up-regulation of known SREBP1 target genes (Fig, 5C, black bars), and that this was reversed by the addition of exogenous lipids (Fig. 5C, gray bars). This finding suggests that activation of lipogenesis could either contribute to the growth inhibition and apoptosis observed in LD-FBS or, more likely, is insufficient to rescue cells from these phenotypes. In contrast, the ability of lipid supplementation to rescue the cells suggests a dependence on exogenous lipids for growth and survival. Overall, these results show that cultured cells respond to changes in culturing conditions, exhibiting different proliferation rates and apoptosis levels. These differences in behaviors could stem from different levels of structural and signaling lipid molecules present in the growth environment.
Statement of significance of the study.
In this study, we focus on an estrogen receptor positive breast cancer cell line to investigate the involvement of different serum treatments on growth rate and cell survival. We show that both charcoal-dextran- and silica-treated serum affect growth rate and apoptosis. We modified a lipid extraction method that enabled us to study the levels of a wide range of lipids in different serum types. Using this method, we analyzed the lipid composition of full, charcoal-dextran- and silica-treated serum and provide links between the lipid composition and phenotypes we observe when cells are cultured in these sera. Silica treatment reduced the levels of a number of lipid families and activated de novo lipid biosynthesis. Supplementing silica treated serum with exogenous lipids restored growth, reduced apoptosis and de novo lipid lipogenesis suggesting that the silica treatment effectively removes lipids from media and activates lipid biosynthesis to maintain the levels of important signaling and structural metabolites. We believe that the lipid analysis and the integration of lipid measurements and phenotypic characterizations we present in this work will provide as an important resource for scientific community.
ACKOWLEDGEMENTS
We would like to thank Jermya Buckley for manuscript preparation. This work was supported by the National Institutes of Health R01 CA-196930 (to JF) and National Science Foundation MCB1817468 (to GEA-G). GEA-G acknowledges initial contributions of Laura Brunelle on lipid analysis. The authors have declared no conflict of interest.
Abbreviations:
- FBS
fetal bovine serum
- ER
estrogen receptor
- CD
charcoal-dextran
- LD
lipid-depleted
- E2
estradiol
- SREBP1 and SREBP2
sterol regulatory binding proteins 1 and 2
- TAG
triacylglycerol
- DSPC
1,2-Distearoyl-snglycero-3-phosphocholine
- LC-MS
liquid chromatography-mass spectrometry
- LS
lipid supplement
Footnotes
Publisher's Disclaimer: This article has been accepted for publication and undergone full peer review but has not been through the copyediting, typesetting, pagination and proofreading process, which may lead to differences between this version and the Version of Record.
REFERENCES
- [1].Carter P, Clin. Chem 1978, 24, 362. [PubMed] [Google Scholar]
- [2].Meyer S, Stevens SC, White WL, Hixon B, Am. J. Clin. Pathol 1978, 70(4), 655;R. D. Hertogh, I. Vanderheyden, E. Ekka, J. Steroid Biochem. 1975, 6, 1333;S. Shafie, S. C. Brooks, J. Lab. Clin. Med. 1979, 94, 784. [DOI] [PubMed] [Google Scholar]
- [3].Berthois Y, Katzenellenbogen JA, Katzenellenbogen BS, P. Natl. Acad. Sci. USA 1986, 83, 2496. [DOI] [PMC free article] [PubMed] [Google Scholar]
- [4].Griffiths B, Lewis CA, Bensaad K, Ros S, Zhang Q, Ferber EC, Konisti S, Peck B, Miess H, East P, Wakelam M, Harris AL, Schulze A, Cancer Metab 2013, 1, 3. [DOI] [PMC free article] [PubMed] [Google Scholar]
- [5].Tuohetahuntila M, Molenaar MR, Spee B, Brouwers JF, Wubbolts R, Houweling M, Yan C, Du H, VanderVen BC, Vaandrager AB, Helms JB, J. Biol. Chem 2017, 292, 12436. [DOI] [PMC free article] [PubMed] [Google Scholar]
- [6].Rothwell C, Lebreton A, Young Ng C, Lim JY, Liu W, Vasudevan S, Labow M, Gu F, Gaither LA, Virology 2009, 389, 8; L. Goedeke, N. Rotllan, A. Canfran-Duque, J. F. Aranda, C. M. Ramirez, E. Araldi, C. S. Lin, N. N. Anderson, A. Wagschal, R. de Cabo, J. D. Horton, M. A. Lasuncion, A. M. Naar, Y. Suarez, C. Fernandez-Hernando, Nat. Med. 2015, 21, 1280;P. Ruiz-Sanchez, C. Konig, S. Ferrari, R. Alberto, J. Biol. Inorg. Chem. 2011, 16, 33. [DOI] [PubMed] [Google Scholar]
- [7].Agnese ST, Spierto FW, Hannon WH, Clin. Biochem 1983, 16, 98; [DOI] [PubMed] [Google Scholar]; Onder S, Tacal O, Lockridge O, Front. Pharmacol 2018, 9. [DOI] [PMC free article] [PubMed] [Google Scholar]
- [8].Triglia RP, Linscott WD, Mol. Immunol 1980, 17, 741. [DOI] [PubMed] [Google Scholar]
- [9].Brovkovych V, Izhar Y, Danes JM, Dubrovskyi O, Sakallioglu IT, Morrow LM, Atilla-Gokcumen GE, Frasor J, Oncogenesis 2018, 7, 66. [DOI] [PMC free article] [PubMed] [Google Scholar]
- [10].Li N, Sancak Y, Frasor J, Atilla-Gokcumen GE, Biochemistry 2018, 57, 72. [DOI] [PMC free article] [PubMed] [Google Scholar]
- [11].Ferraz TPL, Fiúza MC, dos Sa MLA, Lee DY, Kind T, Yoon Y-R, Fiehn O, Liu K-H, Anal. Bioanal. Chem 2014, 406, 7275. [DOI] [PubMed] [Google Scholar]
- [12].Folch J, Lees M, Sloane Stanley GH, J. Biol. Chem 1957, 226, 497. [PubMed] [Google Scholar]
- [13].Schönhoff M, NMR methods for studies of organic adsorption layers, page315, 2001.
- [14].Murtola TJ, Syvala H, Pennanen P, Blauer M, Solakivi T, Ylikomi T, Tammela TLJ, Plos One 2012, 7, e39445; N. D. Ridgway, Crit. Rev. Biochem. Mol. 2013, 48, 20. [DOI] [PMC free article] [PubMed] [Google Scholar]
- [15].Ogretmen B. Nat. Rev. Cancer 2018, 18, 33. [DOI] [PMC free article] [PubMed] [Google Scholar]