Abstract
To develop novel CNS penetrant HDAC inhibitors, a new series of HDAC inhibitors having benzoheterocycle were designed, synthesized, and biologically evaluated. Among the synthesized compounds, benzothiazole derivative 9b exhibited a remarkable anti-proliferative activity (GI50 = 2.01 μM) against SH-SY5Y cancer cell line in a dose and time-dependent manner, better than the reference drug SAHA (GI50 = 2.90 μM). Moreover, compound 9b effectively promoted the accumulation of acetylated Histone H3 and α-tubulin through inhibition of HDAC1 and HDAC6 enzymes, respectively. HDAC enzyme assay also confirmed that compound 9b efficiently inhibited HDAC1 and HDAC6 isoforms with IC50 values of 84.9 nM and 95.9 nM. Furthermore, compound 9b inhibited colony formation capacity of SH-SY5Y cells, which is considered a hallmark of cell carcinogenesis and metastatic potential. The theoretical prediction, in vitro PAMPA-BBB assay, and in vivo brain pharmacokinetic studies confirmed that compound 9b had much higher BBB permeability than SAHA. In silico docking study demonstrated that compound 9b fitted in the substrate binding pocket of HDAC1 and HDAC6. Taken together, compound 9b provided a novel scaffold for developing CNS penetrant HDAC inhibitors and therapeutic potential for CNS-related diseases.
Subject terms: Drug discovery and development, Structure-based drug design
Introduction
Histone deacetylase (HDACs) and histone acetyltransferases (HATs) control the dynamic status of histone acetylation, which plays an important role in the regulation of gene expression. In general, the hyper-acetylation of histones is associated with transcriptional gene activation. Conversely, the hypo-acetylation of histones is correlated with transcriptional gene repression. HDACs remove the acetyl groups from hyper-acetylated histones, resulting in a closed chromatin configuration that blocks the access of the transcription machinery to DNA, and consequently suppress gene expression1. In contrast, HATs acetylate the lysine residues of histones, opposing the effect of HDACs and that leads to a relaxed chromatin structure, which enhances gene transcription. In addition to their roles in the transcriptional gene regulation, HDACs are also involved in the acetylation of various non-histone proteins such as Hsp90, α-tubulin, p53, Foxp3, E2F1, and NF-κB2,3.
HDACs are composed of eleven zinc-dependent enzymes, which are further divided into four distinct classes, including class I (HDACs 1, 2, 3, and 8), class IIa (HDACs 4, 5, 7, and 9), class IIb (HDACs 6 and 10), and class IV (HDAC11)4. NAD+-dependent HDAC enzymes, known as sirtuins belong to class III (sirtuins 1–7). Over the past decade, HDACs have emerged as promising targets with a broad range of potential indications, such as cancers and CNS disorders5–7.
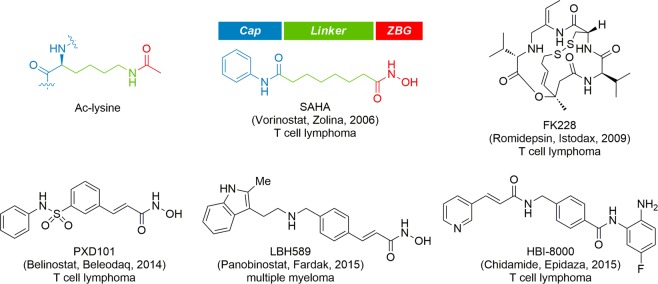
HDACs have been primarily investigated as anticancer targets and accordingly numerous HDAC inhibitors are currently at various stages of pre-clinical and clinical trials for the treatment of cancers8–15. To date, five HDAC inhibitors are approved globally. Four HDAC inhibitors including SAHA, FK228, FXD101, and LBH589 are clinically approved by the US FDA for the treatment of cutaneous T-cell lymphoma and multiple myeloma, and a HDAC inhibitor, HBI-8000 is approved by the Chinese FDA for the treatment of cutaneous T-cell lymphoma (Fig. 1)16–20.
Figure 1.
Structures of clinically approved HDAC inhibitors.
Although most HDAC inhibitors have been developed for the hematological malignancies, an increasing number of HDAC inhibitors are investigated for the treatment of central nervous system (CNS) diseases such as brain cancers, Alzheimer’s disease, depression, and drug addiction6,21. It has been reported that a number of HDAC inhibitors such as SAHA, MS-275, tubastatin A, and valproic acid have low brain uptake due to poor blood-brain barrier (BBB) permeability, highlighting their limitation as clinical applications for CNS diseases22–27. Only a handful of CNS-penetrant HDAC inhibitors have recently been reported for their therapeutic potential in CNS disorders28–32. Despite the challenges and difficulties in the drug discovery of CNS therapeutics, the potential therapeutic benefits of HDAC inhibitors in CNS diseases prompted us to develop CNS penetrant HDAC inhibitors structurally distinct from the previous reported CNS-penetrant HDAC inhibitors.
Results and Discussion
Chemistry
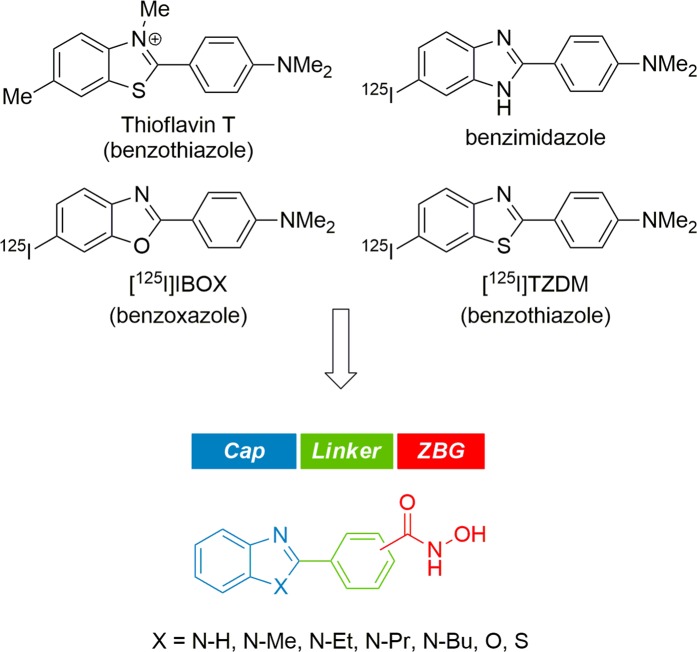
During the past decade, substantial efforts have been undertaken to develop amyloid-β probes with a high brain uptake, resulting in a variety of radiolabeled molecular probes for in vivo amyloid-β imaging (Fig. 2)33–35. Among the scaffolds derived from these molecular probes, thioflavin-T analogues such as benzothiazole, benzoxazole, and benzimidazole display not only excellent binding affinity to amyloid-β aggregates but also high uptake into the brain. Besides, these benzoheterocycles have also attracted attention in oncology due to their diverse biological activities and applications in cancer treatment36,37. On the basis of their excellent BBB penetrating property and common pharmacophores in oncology, we assumed that these benzoheterocycle scaffolds might be a viable starting point for the development of CNS penetrant HDAC inhibitors. Therefore, we set out to design HDAC inhibitors structurally derived from amyloid-β probes. HDAC inhibitors share a common structural features including capping group, a linker group, and a zinc-binding group (ZBG), which have been widely employed in the design of HDAC inhibitors. Benefiting from this pharmacophore model, we designed a series of HDAC inhibitors bearing a benzoheterocyle cap, a phenyl linker, and hydroxamic acid ZBG, as shown in Fig. 2.
Figure 2.
Design of HDAC inhibitors derived from structures of amyloid-β probes.
We first commenced the synthesis of compounds 5 and 6a–d, illustrated in Fig. 3. Compound 3 was synthesized following the previously reported procedure with a slight modification38. Briefly, reaction of ortho-phenylenediamine (1) with aldehyde 2 in aqueous DMF provided a key intermediate 3 via aerobic oxidation in 88% yield. After that, compound 3 was treated with sodium hydride in DMF for 2 h, followed by the addition of various alkyl iodide to provide compounds 4a–d in 45–70% yield. Finally, subsequent treatment of 3 or 4a–d with NH2OH and KOH in methanol provided compounds 5 or 6a–d in 32–35% yield.
Figure 3.
Synthesis of compounds 5 and 6a–d. Reagents and conditions: (a) 10% H2O in DMF, 80 °C, 36 h, 88%; (b) NaH, alkyl iodide, DMF, rt, 10 h, 45–70%; (c) NH2OH, KOH, MeOH, 0 °C, 3 h, 36–51%.
We next pursued the synthesis of 9a-b depicted in Fig. 4. Compounds 8a-b were prepared by iodine-mediated cyclization of the corresponding starting materials, 2-aminophenol (7a) or 2-aminothiophenol (7b) with aldehyde 2 in 32–35% yield39. Subsequent treatment of ester 8a-b with NH2OH and KOH in methanol successfully furnish compounds 9a-b in 42–45% yield.
Figure 4.
Synthesis of compounds 9a-b. Reagents and conditions: (a) I2, DCM, rt, 3 h, 32% for 8a, 35% for 8b; (b) NH2OH, KOH, MeOH, 0 °C, 3 h, 45% for 9a, 42% for 9b.
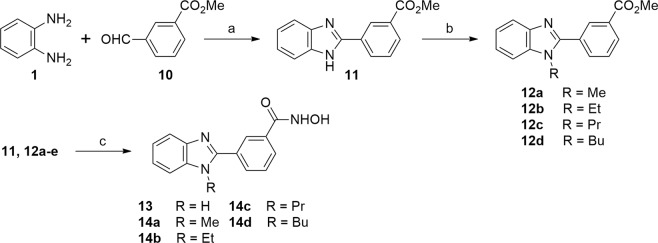
To explore the biological activity of meta-regioisomers, we further synthezised compounds 13 and 14a–d depicted in Fig. 5. Similarly, compound 11 was prepared from ortho-phenylenediamine (1) and aldehyde 10 in aqueous DMF in 86% yield. After that, compound 11 was treated with sodium hydride in DMF for 2 h and then alkylated with the corresponding alkyl iodide to give compounds 12a–d in 11–91% yield. Synthesis of compounds 13 and 14a–d was finally achieved through the reaction of compound 11 or 12a–d with NH2OH and KOH in methanol in 33–55% yield.
Figure 5.
Synthesis of compounds 13 and 14a-e. Reagents and conditions: (a) 10% H2O in DMF, 80 °C, 48 h, 86%; (b) NaH, alkyl iodide, DMF, rt, 10 h, 11–91%; (c) NH2OH, KOH, MeOH, 0 °C, 3 h, 33–55%.
The first attempt to construct compounds 16a-b via iodine-mediated cyclization of 15a-b with aldehyde 10 did not afford the desired product, unlike the reactions in Fig. 4. Therefore, we carried out sodium cyanide-catalyzed cyclization of compounds 15a-b with aldehyde 10 in DMF, which successfully afforded compounds 16a-b in 44–67% yield (Fig. 6)40. Finally, we accomplished the conversion of compounds 16a-b to 17a-b with NH2OH and KOH in methanol in 34–50% yield.
Figure 6.
Synthesis of compounds 17a-b. Reagents and conditions: (a) NaCN, molecular sieves, DMF, 60 °C, 48 h, 67% for 16a, 44% for 16b. (b) NH2OH, KOH, MeOH, 0 °C, 3 h, 50% for 17a, 34% for 17b.
In vitro anti-proliferation assays
Upon completion of synthesis, we next investigated their anti-proliferative effect on human neuroblastoma cell line SH-SY5Y, which is an in vitro model of human malignant metastatic neuroblastoma. As shown in Table 1, analogue 9b exerted the most potent anti-proliferative activity with IC50 value of 2.01 μM against SH-SY5Y cell line, in that the reference drug SAHA also furnished good anti-proliferative activity with IC50 value of 2.90 μM against SH-SY5Y cell line. Para-substituted benzimidazole analogues 5 and 6a–d exhibited relatively poor anti-proliferative activities (IC50 = 38.1–60 μM), compared with benzothiazole analogue 9b. Interestingly, butyl substituent on nitrogen atom of benzimidazole group (6d) resulted in approximately a 2-fold increase in potency (26.8 μM) from non-substituted analogue 5 (60 μM). Benzoxazole analogue 9a, which has oxygen atom replacing sulfur atom of the most potent analogue 9b, furnished 12-fold less potent anti-proliferative activity (IC50 = 25.7 μM) than compound 9b. It is probably because the hydrophobicity of sulfur atom plays a critical role in the binding to HDAC enzymes and cell permeability. We additionally confirmed that compound 9b more efficiently promoted the acetylation of Histone H3 and α-tubulin than compound 9a via the inhibition of HDAC1 and HDAC6, which is a good agreement with their anti-proliferative activities (Fig. S1). In contrast, the similar structural modification of compound 14a and 14b did not have a significant effect on GI50 values of compound 14a and 14b. Ethyl, propyl and butyl substituents on nitrogen atom of meta-substituted benzimidazole moiety, including analogues 14b-d also increased the cellular anti-proliferative activities against SH-SY5Y cell line, compared with methyl substituted analogue 13 and non-substituted analogue 14a. However, all meta-substituted analogues (13, 14a–d, and 17a-b) exerted relatively poor or modest anti-proliferative activities, compared with para-substituted benzothiazole 9b. Accordingly, we chose compound 9b for further biological evaluation.
Table 1.
Anti-proliferative effect of compounds on SH-SY5Y cellsa.
| Compound | SH-SY5Y (GI50; μM) | Compound | SH-SY5Y (GI50; μM) |
|---|---|---|---|
| 5 | 60 ± 1.5 | 13 | >100 |
| 6a | 58.3 ± 10.8 | 14a | >100 |
| 6b | 38.1 ± 0.2 | 14b | 28.2 ± 0.75 |
| 6c | 54.7 ± 0.95 | 14c | 34.6 ± 0.6 |
| 6d | 26.8 ± 1.35 | 14d | 20.7 ± 1.0 |
| 9a | 25.7 ± 0.05 | 17a | 17.5 ± 0.35 |
| 9b | 2.01 ± 0.33 | 17b | 21.4 ± 1.65 |
| SAHA | 2.90 ± 0.28 |
aCytotoxicity on SH-SY5Y neuroblastoma cell line (72 h). Data are expressed as the mean ± SD (n = 4).
Calculation of physiochemical properties
Delivering therapeutic agents to the central nervous system (CNS) remains a major challenge for the treatment of brain cancers due to the presence of the blood-brain barrier (BBB). The success of therapeutic agents in treating various brain cancers suggests that it is highly desirable to identify small molecule inhibitors, capable of crossing the BBB. Important molecular property criteria that are widely used to evaluate the ability of compounds to cross the BBB include lipophilicity (clogP), topological polar surface area (tPSA), molecular weight (MW), and number of hydrogen bond donors (HBD)41. Therefore, we calculated clogP, tPSA, MW, and clogP of synthesized HDAC inhibitors to evaluate their ability to cross the BBB. MW of all compounds are within the preferred limit (MW < 450) and HBD of all compounds except compound 5, 13 and SAHA are within the suggested limit (HBD < 3), while HBD of compound 5, 13 and SAHA are 3. As shown in Fig. 7, compounds 6b-c, 9b, 14b-c, and 17b were within the preferred range of clogP and tPSA (clogP = 2–4, tPSA < 70 Å2), while the reference drug SAHA was not located in the preferred or suggested range of clogP and tPSA, suggesting that these compounds (6b-c, 9b, 14b-c, and 17b) are very likely to cross the BBB and accumulate in the brain, compared to the reference drug SAHA.
Figure 7.
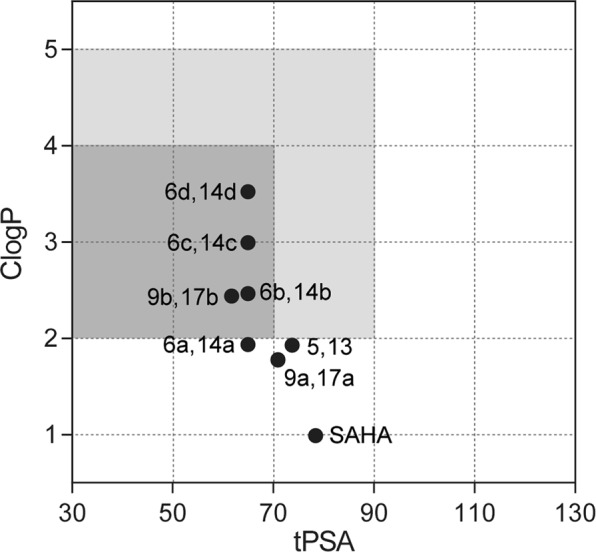
Calculated physiochemical properties of HDAC inhibitors. Preferred range for crossing BBB is shown in dark gray color and suggested limits for crossing BBB are shown in light gray color. ClogP and tPSA values are calculated by ChemBioDraw Ultra 12.0 software.
In vitro PAMPA-BBB assay
In order to verify BBB permeability of compound 9b and SAHA, we next carried out the parallel artificial membrane permeability assay of BBB (PAMPA-BBB) (Table 2)42. The PAMPA-BBB assay is a powerful in vitro technique to give a good prediction on the passive BBB permeability of drugs. A set of structurally diverse drugs were first selected as positive and negative controls, in that progesterone and lidocaine were classified as CNS+ (high brain penetration) and theophylline was classified as CNS- (low brain penetration). The PAMPA-BBB assay demonstrated that the effective permeability value of compound 9b (Pe = 27.15) was much higher than SAHA (Pe = 2.77), suggesting that compound 9b could more efficiently penetrate into CNS than SAHA. The reference drugs, progesterone and lidocaine, which are classified as CNS+, showed high effective permeability (Pe) values, while theophylline, classified as CNS- furnished a very low effective permeability (Pe) value as reported in the literature43. These results also illustrated that experimentally determined effective permeability (Pe) of compound 9b and SAHA was in good agreement with the theoretical prediction of BBB permeability shown in Fig. 7.
Table 2.
Effective permeability (Pe) of compound 9b and SAHA in the PAMPA-BBB assay.
| Compounds | Pe (10−6 cm/s)a | CNS +/− classificationb |
|---|---|---|
| Progesterone | 35.52 ± 0.33 | CNS + |
| Lidocaine | 18.98 ± 3.05 | CNS + |
| Theophylline | 0.10 ± 0.02 | CNS − |
| 9b | 27.15 ± 1.59 | CNS + |
| SAHA | 2.77 ± 0.05 | CNS − |
aData are expressed as the mean ± SD from three independent experiments. bCNS + indicates (Pe > 10) and CNS - indicates (Pe < 10).
In vivo brain pharmacokinetic studies
In light of the encouraging in vitro PAMPA- BBB data of compound 9b, we performed in vivo brain pharmacokinetic studies. Compound 9b and SAHA were administered intravenously to male mice at 2 mg/kg and the concentrations of 9b and SAHA in mice brain and plasma were analyzed using LC-MS/MS at 30 minutes and 1 hour time points. As is apparent from the data shown in Table 3, in vivo brain pharmacokinetic studies indicated that compound 9b displayed a good brain uptake (414.6 ng/mL at 0.5 h and 52.9 ng/mL at 1 h), which is consistent with its calculated permeability properties and in vitro PAMPA- BBB data. In contract, FDA-approved HDAC inhibitor, SAHA afforded a poor brain uptake (14.5 ng/mL), which is 29-fold less effective than compound 9b (414.6 ng/mL) to distribute in brain at 30 minutes after the intravenous administration. Furthermore, the brain to plasma exposure profile for compound 9b was superior to that obtained for SAHA. Overall, in vivo brain pharmacokinetic studies illustrated that compound 9b effectively distributed into CNS.
Table 3.
Brain pharmacokinetic studies of compound 9b and SAHAa.
| Compound | Route | Dose (mg/kg) | Brain concentration (ng/mL) | Plasma concentration (ng/mL) | Brain/plasma ratio | |||
|---|---|---|---|---|---|---|---|---|
| 0.5 h | 1 h | 0.5 h | 1 h | 0.5 h | 1 h | |||
| 9b | IV | 2 | 414.6 ± 88.7 | 52.9 ± 1.6 | 46.0 ± 13.9 | 7.3 ± 1.0 | 9.0 | 7.2 |
| SAHA | IV | 2 | 14.5 ± 2.8 | BQL | 39.2 ± 11.5 | 4.5 ± 2.7 | 0.4 | NA |
aCompound 9b and SAHA were administrated to ICR male mice by IV route at the dose of 2 mg/kg. Brain samples were collected at 0.5 and 1 hour time points and homogenized at a 1:4 ratio of tissue weight (g) to PBS volume (mL). Plasma samples were collected at 0.5 and 1 hour time points. Aliquots (20 μL) of brain homogenate or plasma samples were mixed with 180 μL of acetonitrile, vortexed, and centrifuged at 15,000 rpm for 5 minutes at 4 °C. The resulting supernatants were used for LC-MS/MS analysis. BQL: below quantifiable limit. NA: not applicable. Data are expressed as the mean ± SD (n = 4).
Biological evaluation of compound 9b
We next investigated the dose and time-dependent effect of compound 9b on the growth of SH-SY5Y cells. SH-SY5Y cells were treated with the indicated concentrations of compound 9b for 24, 48, and 72 hours and cell viability was measured by MTS colorimetric assay (Fig. 8). The data indicated that compound 9b exhibited a potent anti-proliferative activity against SH-SY5Y in a dose and time-dependent manner. Compound 9b impaired nearly 73% of SH-SY5Y cell growth at the concentration of 5 μM for 72 hours.
Figure 8.
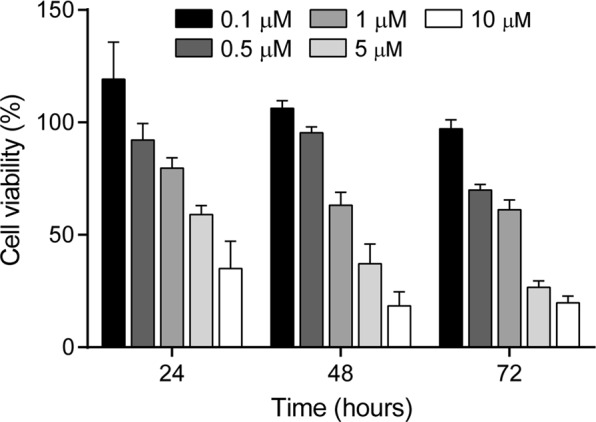
Dose and time-dependent anti-proliferative effect of 9b against SH-SY5Y cell line. Data are presented as the mean ± SD (n = 4).
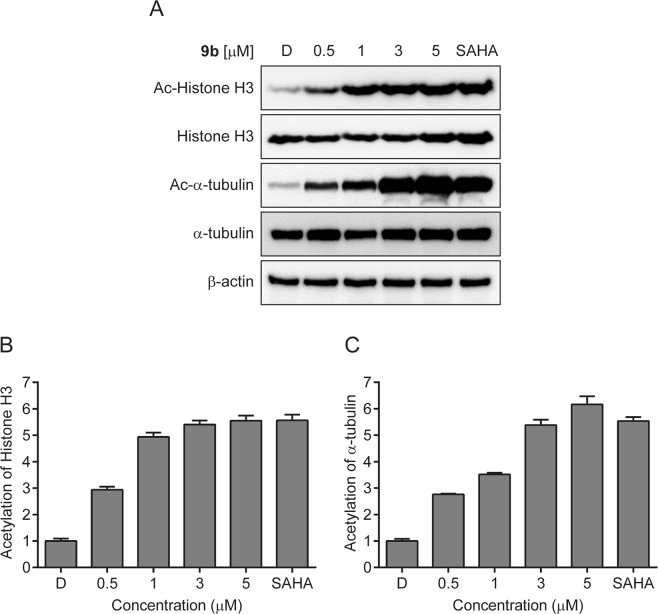
To investigate whether compound 9b exhibited its anticancer effect through HDACs inhibition, we next studied the cellular biomarkers of HDACs inhibition (Fig. 9). Histone H3 and α-tubulin are well-documented substrates of HDAC1 and HDAC6, respectively. Thus, the acetyl groups of those substrates can be epigenetically removed by HDAC1 and HDAC6. As shown in Fig. 9, treatment of SH-SY5Y cells with compound 9b significantly induced the accumulation of acetylated Histone H3 and α-tubulin in a dose-dependent manner, indicating that compound 9b inhibited the deacetylase activities of HDAC1 and HDAC6. Treatment of SH-SY5Y cells even with 0.5 μM concentration of 9b promoted the acetylation of Histone H3 and α-tubulin via inhibiting HDAC1 and HDAC6, respectively. Interestingly, 1 μM concentration of 9b caused the dramatic increase of acetylated Histone H3, suggesting that the deacetylase activity of HDAC1 was significantly inhibited even with the administration of 9b at 1 μM concentration. In contrast, the acetylation of α-tubulin dose-dependently increased in proportion to the concentration of compound 9b up to 5 μM concentration, indicating that inhibition of HDAC6 enzyme was not fully completed at least up to 3 μM concentration in this cell-based assay. Nonetheless, the results suggested that compound 9b suppressed HDAC1 and HDAC6 activities in a dose-dependent manner and exerted its anticancer effect via those HDACs inhibition.
Figure 9.
(A) Effect of compound 9b on the acetylation status of Histone H3 and α-tubulin. SH-SY5Y cells were incubated with the indicated concentrations of 9b for 24 h and the acetylation status of Histone H3 and α-tubulin was measured by western blot. DMSO (D) and SAHA (1 μM) were employed as a negative and a positive control, respectively. (B) Densitometry analysis of Ac-Histone H3 and (C) Ac-α-tubulin. Fold increase of Ac-Histone H3 and Ac-α-tubulin were analyzed using Image J software. Control value = 1. Data are presented as the mean ± SD (n = 3).
We next examined the inhibitory activity of compound 9b against HDAC1, 3, 6, and 7 isoforms. For comparison, the clinically approved HDAC inhibitor SAHA was tested as a reference drug. As shown in Table 4, compound 9b very potently inhibited HDAC class I (HDAC1 IC50 = 84.9 nM, HDAC3 IC50 = 142.2 nM) and class IIa (HDAC6 IC50 = 95.9 nM) enzymes, but did not inhibited class IIb (HDAC7 IC50 = 3,036 nM) enzyme, efficiently. Similarly, the reference drug SAHA inhibited HDAC1, HDAC3, HDAC6, and HDAC7 enzymes with IC50 values of 102.7 nM, 61.1 nM, 198.5 nM, and 29,290 nM, respectively. Importantly, compound 9b maintained low nanomolar IC50 values in the 85–96 nM range with HDAC1 and HDAC6, better than SAHA (103–199 nM). The IC50 values of compound 9b and SAHA against HDAC6 are not completely correlated with the results in Western blotting experiment, shown in Fig. 9, in that SAHA (1 μM) induced more acetylation of α-tubulin than compound 9b (1 μM). Nonetheless, it is worth noting that compound 9b displayed good inhibitory activities toward class I and IIa HDACs, which are considered to play an important role in cancer cell proliferation, survival, and metastasis. Furthermore, these HDAC inhibition activity of compound 9b and SAHA well correlated with their anti-proliferative activity, in that compound 9b (GI50 = 2.01 μM) was measured more potent than SAHA (GI50 = 2.90 μM) (Table 1).
Table 4.
HDAC inhibition activity of compound 9b and SAHAa.
| Class | Enzymes | 9b (IC50; nM) | SAHA (IC50; nM) |
|---|---|---|---|
| I | HDAC1 | 84.9 ± 25.1 | 102.7 ± 5.9 |
| HDAC3 | 142.2 ± 45.7 | 61.1 ± 1.54 | |
| IIa | HDAC7 | 3,036 ± 788.5 | 29,290 ± 1,325 |
| IIb | HDAC6 | 95.9 ± 0.78 | 198.5 ± 103.0 |
aData are presented as the mean ± SD (n = 2).
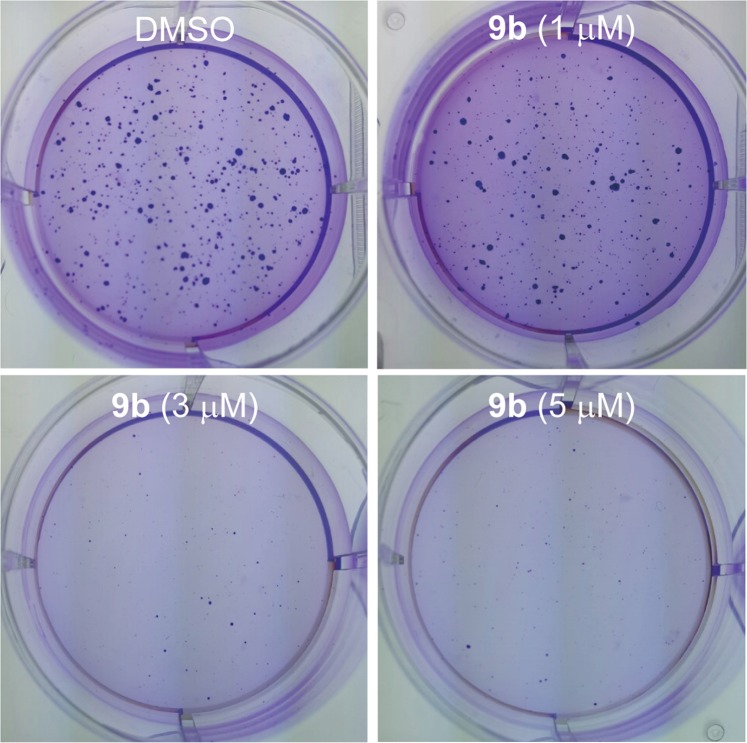
Anchorage-independent cell growth is a hallmark of cell carcinogenesis and indicates the ability of transformed cells to grow independently of a solid surface. The soft agar colony formation assay is a widely used method for measuring the capability of anchorage-independent cell growth in vitro44. Hence, we examined the suppressive effect of compound 9b on anchorage-independent cell growth by the soft agar colony formation assay (Fig. 10). Treatment of SH-SY5Y cells with 9b exhibited inhibitory effect on colony formation of SH-SY5Y neuroblastoma. Moreover, the colony formation capacity of SH-SY5Y cells decreased dose-dependently with the increase of 9b concentration. 3 μM concentration of compound 9b almost completely inhibited the anchorage-independent cell growth of SH-SY5Y neuroblastoma. Overall, the data suggested that compound 9b effectively suppressed the ability of SH-SY5Y cells to grow anchorage-independently in a dose-dependent manner.
Figure 10.
Suppressive effect of compound 9b on colony formation of SH-SY5Y neuroblastoma. The cells were seeded into 6-well plates and cultured for 3 weeks, followed by Crystal Violet staining.
Molecular modeling of compound 9b
The crystal structures of HDAC enzymes are characterized by the active Zn2+ ion in the bottom of the pocket, the hydrophobic channel reaching to the active Zn2+ ion, and the surface rim at the entrance of the pocket.
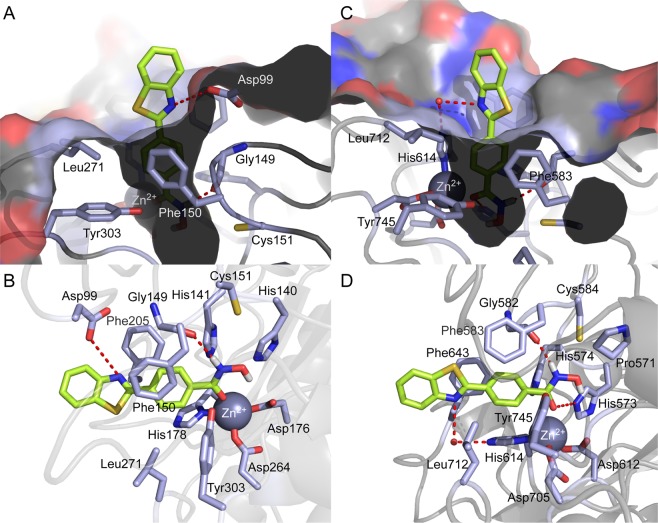
To assess the precise binding pose of 9b in the binding pocket of HDAC1 (PDB code: 4BKX) and HDAC6 (PDB code: 5EF7), we performed a molecular docking study (Fig. 11). In silico docking study displayed that the hydroxamic acid group of 9b chelated the Zn2+ ion in the bottom of the pocket in a monodentate fashion using its carbonyl oxygen atoms in both HDAC1 and HDAC6 isoforms. Although a majority of HDAC inhibitors conferred a canonical bidentate Zn2+ coordination geometry, several ligands in complex with HDACs have recently been reported to display the similar monodentate Zn2+ coordination, illustrating that the capping and linker units attached to the hydroxamate affect its degree of coordination to Zn2+, resulting in either monodentate or bidentate chelation27,45. The hydroxamate NH group of 9b formed an additional hydrogen bonding interaction with Gly149 residue of HDAC1 and Gly582 residue of HDAC6 in a similar fashion. Moreover, the middle phenyl ring of 9b fitted into the hydrophobic channel, forming π-π stacking interactions with the lipophilic Phe150 and Phe205 resides of HDAC1, and Phe583 and Phe643 residues of HDAC6, occupying the hydrophobic channels of HDAC1 and HDAC6, respectively. However, we observed that the orientation of the benzothiazole capping group in HDAC1 was different from HDAC6 isoform. The docking pose of 9b to HDAC1 indicated that the nitrogen atom of the benzothiazole formed a potential hydrogen bonding interaction with the side chain of Asp99 at the rim of the pocket and sulfur atom formed proximal Van der Waals interactions with Leu271 and Phe150. On the contrary, the docking of 9b in HDAC6 suggested that the nitrogen atom of the benzothiazole formed a hydrogen bonding interaction with a conserved water molecule, which interacted with zinc ligand H614. Nonetheless, this docking study acknowledged the inhibitory potential of 9b against both HDAC1 and HDAC6 isoforms.
Figure 11.
Docking pose of 9b in the binding site of HDAC1 (PDB code: 4BKX) and HDAC6 (PDB code: 5EF7). (A) Surface representation of HDAC1 and 9b complex. (B) Cartoon and sticks representation of HDAC1 and 9b complex. (C) Surface representation of HDAC6 and 9b complex. (D) Cartoon and sticks representation of HDAC6 and 9b complex. The carbon, oxygen, nitrogen, and sulfur atoms of 9b are shown in lime, red, blue, and yellow, respectively. The side chains of the binding site are colored according to the atom type (carbon, light blue; oxygen, red; nitrogen, blue) and are labeled with their residue name. The hydrogen bond is shown as a dashed line. Molecular docking simulations were performed by Autodock 4.2 and docking poses were visualized using PyMOL1.3.
Conclusion
In summary, we designed and synthesized a new series of CNS penetrant HDAC inhibitors. Biological evaluation of these HDAC inhibitors indicated that benzothiazole analogue 9b exerted the most potent anti-proliferative activity (IC50 = 2.01 μM) against human neuroblastoma SH-SY5Y cell line, slightly better than the clinically approved HDAC inhibitor, SAHA (IC50 = 2.90 μM). The exposure of SH-SY5Y cells with compound 9b significantly induced the accumulation of acetylated Histone H3 and α-tubulin, which are characteristic cellular biomarkers of HDACs inhibition. HDACs enzyme assay further disclosed that compound 9b efficiently inhibited HDAC1 and HDAC6 isoforms with IC50 values of 84.9 nM and 95.9 nM, respectively. The soft agar assay, which is an in vitro method for measuring the capability of anchorage-independent cell growth, clearly suggested that compound 9b suppressed colony formation of SH-SY5Y cells. The theoretical prediction, in vitro PAMPA-BBB assay, and in vivo brain pharmacokinetic studies confirmed that compound 9b had much higher brain uptake than SAHA. The docking study revealed that compound 9b occupied the binding pocket of HDAC1 and HDAC6 enzymes with monodentate zinc ion chelation, hydrogen bonding and lipophilic π-π interactions. Collectively, compound 9b represents a new class of CNS penetrant HDAC inhibitor and demonstrates therapeutic potential for the treatment of brain cancers and CNS disorders.
Methods
Synthesis
The synthesis and physicochemical properties of compounds are provided as supplementary information available with this article online.
Docking studies
In silico docking of compound 9b with the 3D coordinates of the X-ray crystal structures of HDAC1 (PDB code: 4BKX) or HDAC6 (PDB code: 5EF7) was accomplished using the AutoDock 4.2 program downloaded from the Molecular Graphics Laboratory of the Scripps Research Institute. The AutoDock program was chosen because it uses a genetic algorithm to generate the poses of the ligand inside a known or predicted binding site utilizing the Lamarckian version of the genetic algorithm where the changes in conformations adopted by molecules after in situ optimization are used as subsequent poses for the offspring. In the docking experiments carried out, Gasteiger charges were placed on the X-ray structures of HDACs along with 9b using tools from the AutoDock suite. A grid box centered on the substrate binding pocket of HDACs enzyme with definitions of 60 × 60 × 60 points and 0.375 Å spacing was chosen for ligand docking experiments. The docking parameters consisted of setting the population size to 150, the number of generations to 27,000, and the number of evaluations to 2,500,000, while the number of docking runs was set to 100 with a cutoff of 1 Å for the root-mean-square tolerance for the grouping of each docking run. The docking pose of HDAC1 or HDAC6 with compound 9b was depicted in Fig. 11 and rendering of the picture was generated using PyMOL1.3 (DeLanoScientific).
Cell culture
SH-SY5Y cells were grown in DMEM with L-glutamin supplemented with streptomycin (500 mg/mL), penicillin (100 units/mL), and 10% fetal bovine serum (FBS). Cells were grown to confluence in a humidified atmosphere (37 °C, 5% CO2).
Cell proliferation assay
SH-SY5Y cells (1.5 × 10³ cells/well) were seeded in a clear 96-well plate, the medium volume was brought to 100 µL, and the cells were allowed to attach overnight. The next day, various concentrations of compounds or DMSO were added to the wells. Cells were then incubated at 37 °C for 24, 48 and 72 h. Cell viability was determined using the Promega Cell Titer 96 Aqueous One Solution cell proliferation assay. Absorbance at 490 nm was read on Tecan Infinite F200 Pro plate reader, and values were expressed as percent of absorbance from cells incubated in DMSO alone.
Western blot
Cells were seeded in 100 mm culture dishes (1 × 10⁶ cells/dish), and allowed to attach overnight. Inhibitors were added at the concentrations as indicated and the cells were incubated for an additional 24 hours. For comparison, cells were also incubated with DMSO (0.5%) for 24 hours. Cells were harvested in ice-cold lysis buffer (23 mM Tris-HCl pH 7.6, 130 mM NaCl, 1% NP-40, 1% sodium deoxycholate, 0.1% SDS), and 30 µg of lysate per lane was separated by SDS-PAGE and followed by transferring to a PVDF membrane (Bio-Rad). The membrane was blocked with 5% skim milk in TBST, and then incubated with the corresponding antibody (Ac-α-tubulin, α-tubulin, Ac-Histone H3, Histone H3 or β-actin). After binding of an appropriate secondary antibody coupled to horseradish peroxidase, proteins were visualized by ECL chemiluminescence according to the instructions of the manufacturer (GE healthcare, USA).
HDAC activity assay
HDAC1, 3, 6 and 7 activity assays were performed according to the manufacturer’s protocol (BPS Biosciences). Briefly, enzymes were incubated with various concentrations of compound 9b and SAHA at 37 °C for 30 min in the presence of an HDAC fluorimetric substrate. The HDAC assay developer was added to the mixture and incubated the plate at rt for 15 min. The fluorescence intensity was measured using a Tecan Infinite F200 Pro plate reader.
Colony formation assay
Cells (104 cells/well) were seeded in 6 well plate with 1.2% agar. After 12 h incubation, cells were treated with the indicated concentrations of compound 9b or DMSO at 37 °C in 5% humidified CO2 for 3 weeks with continuously changing medium every week. After medium was thrown away, colonies were stained with 0.05% crystal violet for 10 min.
BBB-PAMPA procedures
BBB-PAMPA was conducted by manufacturer’s instruction (pION Inc, MA, USA). Briefly, test compound was diluted in donor buffer (pH 7.4) to be 25 μM and add 200 μL in lower bottom of 96 well PAMPA sandwich plate. Transmembrane side to donor part was coated with BBB lipid solution and add 200 μL acceptor buffer in upper part of PAMPA sandwich plate. After incubation for 4 h at 25 °C, each part of samples was transferred to new U.V plate then measured U.V spectra at wavelength from 250 nm to 498 nm and permeability rate (Pe, 10−6 cm/sec) was analyzed using pION PAMPA Explorer software (ver3.8).
Brain pharmacokinetic studies
The study was approved by the Institutional Animal Care and Use of Committee of Daegu-Gyeongbuk Medical Innovation Foundation (DGMIF) and performed in accordance with protocols approved by the Institutional Animal Care and Use of Committee. Compound 9b and SAHA were intravenously administered to ICR Male mice, aged 7–8 weeks and weighing 25–30 g at 2 mg/kg with solution formulation of 10% DMSO, 70% PEG400, and 20% saline. Brain and plasma samples were collected at 0.5 and 1 h time points. Brain samples were homogenized at a 1:4 ratio of sample weight (g) to PBS volume (mL). Aliquots (20 μL) of brain homogenate were mixed with 180 μL of acetonitrile, vortexed and centrifuged at 15,000 rpm for 5 minutes at 4 °C. The resulting supernatants were used for LC-MS/MS analysis. Mice plasma samples were collected at 0.5 and 1 h time points. 180 μL of acetonitrile was added to 20 μL of plasma samples, vortexed and centrifuged at 15,000 rpm for 5 minutes at 4 °C. Concentrations of compound 9b and SAHA in mice brain and plasma were determined using an LC-MS/MS. The data found (ng/mL) was multiplied by its dilution factors to obtain the concentration (ng/mL) of compound 9b and SAHA in brain and plasma.
Supplementary information
Acknowledgements
This research was supported by Basic Science Research Program through the National Research Foundation of Korea (NRF) funded by the Ministry of Education (NRF-2016R1A6A1A03011325 and 2016R1D1A1B01009559).
Author Contributions
M.A.C., S.P. and Y.H.S. designed the compounds; M.A.C., C.S. and S.P. synthesized the compounds; H.C. and Y.S. performed the enzymatic and cellular tests; S.P. and Y.S. carried out computational study; M.A.C., S.P., H.C., Y.S., C.S. and Y.H.S. wrote the manuscript; M.A.C., S.P., H.C., Y.S., C.S. and Y.H.S. read and approved the manuscript.
Competing Interests
The authors declare no competing interests.
Footnotes
Publisher’s note Springer Nature remains neutral with regard to jurisdictional claims in published maps and institutional affiliations.
Supplementary information
Supplementary information accompanies this paper at 10.1038/s41598-019-49784-9.
References
- 1.Hong L, Schroth GP, Matthews HR, Yau P, Bradbury EM. Studies of the DNA binding properties of histone H4 amino terminus. Thermal denaturation studies reveal that acetylation markedly reduces the binding constant of the H4 “tail” to DNA. J Biol Chem. 1993;268:305–314. [PubMed] [Google Scholar]
- 2.Glozak MA, Sengupta N, Zhang X, Seto E. Acetylation and deacetylation of non-histone proteins. Gene. 2005;363:15–23. doi: 10.1016/j.gene.2005.09.010. [DOI] [PubMed] [Google Scholar]
- 3.Huang J, et al. Histone/protein deacetylase 11 targeting promotes Foxp3+ Treg function. Sci Rep. 2017;7:8626. doi: 10.1038/s41598-017-09211-3. [DOI] [PMC free article] [PubMed] [Google Scholar]
- 4.Seto E., Yoshida M. Erasers of Histone Acetylation: The Histone Deacetylase Enzymes. Cold Spring Harbor Perspectives in Biology. 2014;6(4):a018713–a018713. doi: 10.1101/cshperspect.a018713. [DOI] [PMC free article] [PubMed] [Google Scholar]
- 5.Ropero S, Esteller M. The role of histone deacetylases (HDACs) in human cancer. Mol Oncol. 2007;1:19–25. doi: 10.1016/j.molonc.2007.01.001. [DOI] [PMC free article] [PubMed] [Google Scholar]
- 6.Kazantsev AG, Thompson LM. Therapeutic application of histone deacetylase inhibitors for central nervous system disorders. Nat Rev Drug Discov. 2008;7:854–868. doi: 10.1038/nrd2681. [DOI] [PubMed] [Google Scholar]
- 7.Malvaez M, et al. HDAC3-selective inhibitor enhances extinction of cocaine-seeking behavior in a persistent manner. Proc Natl Acad Sci USA. 2013;110:2647–2652. doi: 10.1073/pnas.1213364110. [DOI] [PMC free article] [PubMed] [Google Scholar]
- 8.Eckschlager T, Plch J, Stiborova M, Hrabeta J. Histone Deacetylase Inhibitors as Anticancer Drugs. International Journal of Molecular Sciences. 2017;18:1414. doi: 10.3390/ijms18071414. [DOI] [PMC free article] [PubMed] [Google Scholar]
- 9.Brindisi M, et al. Novel spiroindoline HDAC inhibitors: Synthesis, molecular modelling and biological studies. Eur J Med Chem. 2018;157:127–138. doi: 10.1016/j.ejmech.2018.07.069. [DOI] [PubMed] [Google Scholar]
- 10.Leonhardt M, et al. Design and biological evaluation of tetrahydro-β-carboline derivatives as highly potent histone deacetylase 6 (HDAC6) inhibitors. Eur J Med Chem. 2018;152:329–357. doi: 10.1016/j.ejmech.2018.04.046. [DOI] [PubMed] [Google Scholar]
- 11.Ling Y, et al. Development of novel β-carboline-based hydroxamate derivatives as HDAC inhibitors with antiproliferative and antimetastatic activities in human cancer cells. Eur J Med Chem. 2018;144:398–409. doi: 10.1016/j.ejmech.2017.12.061. [DOI] [PubMed] [Google Scholar]
- 12.Goracci L, et al. A Rational Approach for the Identification of Non-Hydroxamate HDAC6-Selective Inhibitors. Sci Rep. 2016;6:29086. doi: 10.1038/srep29086. [DOI] [PMC free article] [PubMed] [Google Scholar]
- 13.Hirata Y, et al. New 5-Aryl-Substituted 2-Aminobenzamide-Type HDAC Inhibitors with a Diketopiperazine Group and Their Ameliorating Effects on Ischemia-Induced Neuronal Cell Death. Sci Rep. 2018;8:1400. doi: 10.1038/s41598-018-19664-9. [DOI] [PMC free article] [PubMed] [Google Scholar]
- 14.Hsu KC, et al. Novel Class IIa-Selective Histone Deacetylase Inhibitors Discovered Using an in Silico Virtual Screening Approach. Sci Rep. 2017;7:3228. doi: 10.1038/s41598-017-03417-1. [DOI] [PMC free article] [PubMed] [Google Scholar]
- 15.Song Y, Lim J, Seo YH. A novel class of anthraquinone-based HDAC6 inhibitors. Eur J Med Chem. 2018;164:263–272. doi: 10.1016/j.ejmech.2018.12.056. [DOI] [PubMed] [Google Scholar]
- 16.Duvic M, et al. Phase 2 trial of oral vorinostat (suberoylanilide hydroxamic acid, SAHA) for refractory cutaneous T-cell lymphoma (CTCL) Blood. 2007;109:31–39. doi: 10.1182/blood-2006-06-025999. [DOI] [PMC free article] [PubMed] [Google Scholar]
- 17.Lee HZ, et al. FDA Approval: Belinostat for the Treatment of Patients with Relapsed or Refractory Peripheral T-cell Lymphoma. Clin Cancer Res. 2015;21:2666–2670. doi: 10.1158/1078-0432.CCR-14-3119. [DOI] [PubMed] [Google Scholar]
- 18.Lu X, Ning Z, Li Z, Cao H, Wang X. Development of chidamide for peripheral T-cell lymphoma, the first orphan drug approved in China. Intractable Rare Dis Res. 2016;5:185–191. doi: 10.5582/irdr.2016.01024. [DOI] [PMC free article] [PubMed] [Google Scholar]
- 19.Raedler LA. Farydak (Panobinostat): First HDAC Inhibitor Approved for Patients with Relapsed Multiple Myeloma. Am Health Drug Benefits. 2016;9:84–87. [PMC free article] [PubMed] [Google Scholar]
- 20.VanderMolen KM, McCulloch W, Pearce CJ, Oberlies NH. Romidepsin (Istodax, NSC 630176, FR901228, FK228, depsipeptide): a natural product recently approved for cutaneous T-cell lymphoma. J Antibiot (Tokyo) 2011;64:525–531. doi: 10.1038/ja.2011.35. [DOI] [PMC free article] [PubMed] [Google Scholar]
- 21.Schmauss C. An HDAC-dependent epigenetic mechanism that enhances the efficacy of the antidepressant drug fluoxetine. Sci Rep. 2015;5:8171. doi: 10.1038/srep08171. [DOI] [PMC free article] [PubMed] [Google Scholar]
- 22.Jochems Jeanine, Boulden Janette, Lee Bridgin G, Blendy Julie A, Jarpe Matthew, Mazitschek Ralph, Van Duzer John H, Jones Simon, Berton Olivier. Antidepressant-Like Properties of Novel HDAC6-Selective Inhibitors with Improved Brain Bioavailability. Neuropsychopharmacology. 2013;39(2):389–400. doi: 10.1038/npp.2013.207. [DOI] [PMC free article] [PubMed] [Google Scholar]
- 23.Seo YJ, et al. Image-Guided Synthesis Reveals Potent Blood-Brain Barrier Permeable Histone Deacetylase Inhibitors. ACS Chemical Neuroscience. 2014;5:588–596. doi: 10.1021/cn500021p. [DOI] [PMC free article] [PubMed] [Google Scholar]
- 24.Hooker JM, et al. Histone Deacetylase Inhibitor MS-275 Exhibits Poor Brain Penetration: Pharmacokinetic Studies of [11C]MS-275 using Positron Emission Tomography. ACS Chemical Neuroscience. 2010;1:65–73. doi: 10.1021/cn9000268. [DOI] [PMC free article] [PubMed] [Google Scholar]
- 25.Hanson JE, et al. SAHA enhances synaptic function and plasticity in vitro but has limited brain availability in vivo and does not impact cognition. PLoS One. 2013;8:e69964. doi: 10.1371/journal.pone.0069964. [DOI] [PMC free article] [PubMed] [Google Scholar]
- 26.Kim SW, et al. Whole-body pharmacokinetics of HDAC inhibitor drugs, butyric acid, valproic acid and 4-phenylbutyric acid measured with carbon-11 labeled analogs by PET. Nucl Med Biol. 2013;40:912–918. doi: 10.1016/j.nucmedbio.2013.06.007. [DOI] [PMC free article] [PubMed] [Google Scholar]
- 27.Kozikowski AP, et al. Brain Penetrable Histone Deacetylase 6 Inhibitor SW-100 Ameliorates Memory and Learning Impairments in a Mouse Model of Fragile X Syndrome. ACS Chem Neurosci. 2019;10:1679–1695. doi: 10.1021/acschemneuro.8b00600. [DOI] [PMC free article] [PubMed] [Google Scholar]
- 28.Schroeder FA, et al. PET imaging demonstrates histone deacetylase target engagement and clarifies brain penetrance of known and novel small molecule inhibitors in rat. ACS Chem Neurosci. 2014;5:1055–1062. doi: 10.1021/cn500162j. [DOI] [PMC free article] [PubMed] [Google Scholar]
- 29.Ghosh B, et al. Dissecting structure-activity-relationships of crebinostat: Brain penetrant HDAC inhibitors for neuroepigenetic regulation. Bioorg Med Chem Lett. 2016;26:1265–1271. doi: 10.1016/j.bmcl.2016.01.022. [DOI] [PMC free article] [PubMed] [Google Scholar]
- 30.Luckhurst CA, et al. Potent, Selective, and CNS-Penetrant Tetrasubstituted Cyclopropane Class IIa Histone Deacetylase (HDAC) Inhibitors. ACS Med Chem Lett. 2016;7:34–39. doi: 10.1021/acsmedchemlett.5b00302. [DOI] [PMC free article] [PubMed] [Google Scholar]
- 31.Strebl MG, et al. HDAC6 Brain Mapping with [(18)F]Bavarostat Enabled by a Ru-Mediated Deoxyfluorination. ACS Cent Sci. 2017;3:1006–1014. doi: 10.1021/acscentsci.7b00274. [DOI] [PMC free article] [PubMed] [Google Scholar]
- 32.Luckhurst CA, et al. Development and characterization of a CNS-penetrant benzhydryl hydroxamic acid class IIa histone deacetylase inhibitor. Bioorg Med Chem Lett. 2019;29:83–88. doi: 10.1016/j.bmcl.2018.11.009. [DOI] [PubMed] [Google Scholar]
- 33.Eckroat TJ, Mayhoub AS, Garneau-Tsodikova S. Amyloid-β probes: Review of structure–activity and brain-kinetics relationships. Beilstein Journal of Organic Chemistry. 2013;9:1012–1044. doi: 10.3762/bjoc.9.116. [DOI] [PMC free article] [PubMed] [Google Scholar]
- 34.Nilsson KPR. Small organic probes as amyloid specific ligands – Past and recent molecular scaffolds. FEBS Letters. 2009;583:2593–2599. doi: 10.1016/j.febslet.2009.04.016. [DOI] [PubMed] [Google Scholar]
- 35.Rajasekhar K, et al. A High Affinity Red Fluorescence and Colorimetric Probe for Amyloid beta Aggregates. Sci Rep. 2016;6:23668. doi: 10.1038/srep23668. [DOI] [PMC free article] [PubMed] [Google Scholar]
- 36.Meenakshi S, Sushil KS. Benzothiazoles: How Relevant in Cancer Drug Design Strategy? Anti-Cancer Agents in Medicinal Chemistry. 2014;14:127–146. doi: 10.2174/18715206113139990312. [DOI] [PubMed] [Google Scholar]
- 37.Xiang P, et al. Novel benzothiazole, benzimidazole and benzoxazole derivatives as potential antitumor agents: synthesis and preliminary in vitro biological evaluation. Molecules. 2012;17:873–883. doi: 10.3390/molecules17010873. [DOI] [PMC free article] [PubMed] [Google Scholar]
- 38.Lee Y, et al. Significant facilitation of metal-free aerobic oxidative cyclization of imines with water in synthesis of benzimidazoles. Tetrahedron. 2015;71:532–538. doi: 10.1016/j.tet.2014.12.043. [DOI] [Google Scholar]
- 39.Matloubi Moghaddam F, Rezanejade Bardajee G, Ismaili H, Maryam Dokht Taimoory S. Facile and Efficient One‐Pot Protocol for the Synthesis of Benzoxazole and Benzothiazole Derivatives using Molecular Iodine as Catalyst. Synthetic Communications. 2006;36:2543–2548. doi: 10.1080/00397910600781448. [DOI] [Google Scholar]
- 40.Cho Y-H, Lee C-Y, Cheon C-H. Cyanide as a powerful catalyst for facile synthesis of benzofused heteroaromatic compounds via aerobic oxidation. Tetrahedron. 2013;69:6565–6573. doi: 10.1016/j.tet.2013.05.138. [DOI] [Google Scholar]
- 41.Hitchcock SA, Pennington LD. Structure−Brain Exposure Relationships. Journal of Medicinal Chemistry. 2006;49:7559–7583. doi: 10.1021/jm060642i. [DOI] [PubMed] [Google Scholar]
- 42.Di L, Kerns EH, Fan K, McConnell OJ, Carter GT. High throughput artificial membrane permeability assay for blood-brain barrier. Eur J Med Chem. 2003;38:223–232. doi: 10.1016/S0223-5234(03)00012-6. [DOI] [PubMed] [Google Scholar]
- 43.Hebda M, et al. Synthesis, Molecular Modelling and Biological Evaluation of Novel Heterodimeric, Multiple Ligands Targeting Cholinesterases and Amyloid Beta. Molecules. 2016;21:410. doi: 10.3390/molecules21040410. [DOI] [PMC free article] [PubMed] [Google Scholar]
- 44.Franken NAP, Rodermond HM, Stap J, Haveman J, van Bree C. Clonogenic assay of cells in vitro. Nature Protocols. 2006;1:2315. doi: 10.1038/nprot.2006.339. [DOI] [PubMed] [Google Scholar]
- 45.Porter NJ, Mahendran A, Breslow R, Christianson DW. Unusual zinc-binding mode of HDAC6-selective hydroxamate inhibitors. Proc Natl Acad Sci USA. 2017;114:13459–13464. doi: 10.1073/pnas.1718823114. [DOI] [PMC free article] [PubMed] [Google Scholar]
Associated Data
This section collects any data citations, data availability statements, or supplementary materials included in this article.


