

Abstract
Applying data mining and machine learning (ML) techniques to clinical data might identify predictive biomarkers for diabetic nephropathy (DN), a common complication of type 2 diabetes mellitus (T2DM). A retrospective analysis of the Action to Control Cardiovascular Risk in Diabetes (ACCORD) trial was intended to identify such factors using ML. The longitudinal data were stratified by time after patient enrollment to differentiate early and late predictors. Our results showed that Random Forest and Simple Logistic Regression methods exhibited the best performance among the evaluated algorithms. Baseline values for glomerular filtration rate (GFR), urinary creatinine, urinary albumin, potassium, cholesterol, low‐density lipoprotein, and urinary albumin to creatinine ratio were identified as DN predictors. Early predictors were the baseline values of GFR, systolic blood pressure, as well as fasting plasma glucose (FPG) and potassium at month 4. Changes per year in GFR, FPG, and triglycerides were recognized as predictors of late development. In conclusion, ML‐based methods successfully identified predictive factors for DN among patients with T2DM.
Study Highlights.
WHAT IS THE CURRENT KNOWLEDGE ON THE TOPIC?
Nephropathy is one of the most common complications of type 2 diabetes mellitus (T2DM) and the leading cause of end‐stage renal disease and death among these patients.
Even though multiple risk factors for diabetic nephropathy (DN) have been reported, machine learning (ML) techniques have confirmed the usefulness of current biomarkers and may help investigators identify novel relationships that are not readily apparent.
WHAT QUESTION DID THIS STUDY ADDRESS?
What are the predictive risk factors leading to DN among patients with T2DM?
WHAT DOES THIS STUDY ADD TO OUR KNOWLEDGE?
Glomerular filtration rate (GFR), age, urinary albumin excretion, low‐density lipoprotein, triglycerides, and cholesterol were confirmed as risk factors for DN.
ML techniques also identified creatinine phosphokinase, FPG, and potassium, as well as changes in fasting plasma glucose (FPG) and GFR after year 1 as early and late biomarkers of DN, respectively.
HOW MIGHT THIS CHANGE CLINICAL PHARMACOLOGY OR TRANSLATIONAL SCIENCE?
In an era of big data and information, additional knowledge might be generated by applying ML techniques to identify the most suitable biomarker(s) for multifactorial diseases, such as DN.
Global prevalence of diabetes mellitus has increased dramatically from 5.1% of the adult world's population (20–79 years) in 20031 to 8.8% in 2017 and is projected to be 9.9% by 2045. Type 2 diabetes mellitus (T2DM) constitutes 85–95% of these cases.2 The increase in the incidence of diabetes and associated complications are a significant threat to global health.
One of the most common complications of type 2 diabetes attributed to microvascular changes is diabetic nephropathy (DN), which is the main cause of end‐stage renal disease (ESRD) and death among patients with T2DM.3, 4, 5, 6 Clinically, DN is characterized by hypertension, proteinuria, and a progressive decline in glomerular filtration rate (GFR) leading to ESRD.3, 7, 8 Based on the magnitude of urinary albumin excretion rate, DN has been categorized into five stages. The initial stage is characterized by renal hyperfiltration and hypertrophy, the second stage is a long silent period without overt clinical signs and symptoms of nephropathy, microalbuminuria appears during the third stage worsening to macro‐albuminuria in the fourth stage, the fifth stage is a progressively severe decline in renal function that leads to ESRD.7, 9, 10, 11 Standard treatments include glycemic and hypertension control following the “Standards of Medical Care for Patients with Diabetes Mellitus” developed by the American Diabetes Association.12, 13
Therefore, the best intervention is early detection and prevention, identifying and intervening as early as possible before patients at high risk develop DN would likely have a significant impact on clinical outcomes. To address this challenge, data from the Action to Control Cardiovascular Risk in Diabetes (ACCORD) study were examined. The main objective was to identify predictive risk factors among this patient population that lead to DN using machine learning (ML) techniques.
Methods
Data collection
Data were provided by the Biologic Specimen and Data Repository Information Coordinating Center of the National Heart, Lung, and Blood Institute (NHLBI), sponsor of the ACCORD trial,14 and our evaluation was performed under a protocol approved by the Indiana University Institutional Review Board. The NHLBI database was analyzed evaluating, classifying, and identifying the factors that seem to predict DN using the Waikato Environment for Knowledge Analysis (WEKA) workbench15 and R.16 The rationale, study design, inclusion/exclusion characteristics, and outcomes of the ACCORD trial have been previously published.17 Briefly, ACCORD was a randomized, multicenter study involving 10,251 middle‐aged and older patients from 77 clinical centers in the United States and Canada with established T2DM (mean duration 10 years) who were at risk for cardiovascular disease events. Recruitment occurred in two phases, from January to June 2001 and from February 2003 to October 2005. Participants had clinical visits at least every 4 months for about 4–8 years (mean participation was 5.6 years) and was completed in December 2012. The ACCORD trial is registered with http://www.clinicaltrials.gov (NCT00000620).
Data mining
Patient‐specific variables comprising metabolic, laboratory, clinical observations, and measures of kidney function were extracted from the NHLBI‐provided ACCORD data set. The following attributes (or risk factors) were analyzed: gender, age at randomization, randomization arm, cardiovascular history at baseline (cardiovascular disease before the initiation of the study yes/no), race, measures of systolic and diastolic blood pressure (BP), heart rate, glycosylated hemoglobin (HbA1c), lipids (total cholesterol, triglycerides, very low‐density lipoprotein, low‐density lipoprotein (LDL), and high‐density lipoprotein (HDL)), alanine aminotransferase, creatinine phosphokinase (CPK), fasting plasma glucose (FPG), estimated GFR (eGFR), potassium (K), serum creatinine (SCr), urinary albumin to creatinine ratio (UACR), urinary albumin (UAlb), and urinary creatinine (UCr).
A binary outcome for the prediction model was defined as either the development or absence of nephropathy. The classification algorithms focused on the prediction of any of the microvascular events related to nephropathy in the ACCORD trial: a doubling of baseline SCr or greater than a 20 mL/minute/1.73‐m2 decline in eGFR, microalbuminuria (UACR ≥ 30 mg/g or 3.4 mg/mmol), macroalbuminuria (UACR ≥ 300 mg/g or 33.9 mg/mmol), or renal failure (initiation of dialysis or ESRD or renal transplantation, or a rise of SCr > 291.72 μmol/L).18 After DN diagnosis, the patient was subsequently excluded from the analysis. Using this approach, the classification model was able to make predictions based on the information previously collected.
Specifically, BP and heart rate were monitored every month until month 4 and every 2 months beginning at month 6 until the end of the study; HbA1c every 4 months; lipids panel every 4 months for the first year of the study and then every 12 months; alanine aminotransferase, CPK, FPG, GFR, K, SCr, UACR, UAlb, and UCr at first month, month 4, and then every 4 months. Thus, a longitudinal data set was created and then divided into eight different time windows based on the available data from the ACCORD trial and the follow‐up visits, beginning at patient enrollment into the study: 0–5.9 months, 6–11.9 months, 12 months to 1.9 years, 2–2.9 years, 3–3.9 years, 4–4.9 years, 5–5.9 years, and 6 years until the end of the 7‐year study (Figure S1 ). This approach allowed to identify early (up to year 2) and late (up to year 7) predictors of DN. Every subset of data included the baseline values (at patient enrollment) for the attributes previously mentioned as well as the available observations until the end of each specific window of time. The slopes for each attribute were calculated as follows:
| (1) |
where
s n·x = slope at year n of the attribute x, x i = attribute at time t i, x 0 = attribute at baseline, t i = time (months), t 0 = baseline time
Data were randomly allocated into separate training and testing data sets for each time window using the sample_frac function from the dplyr package in R.19 Sixty‐six percent of the data was used for training the model and to establish the predictive parameters for the classifier, whereas the remaining 34% was used to test and validate the model's predictive performance. This approach was used to provide an unbiased evaluation of the final model.
Using the Data Mining with R (DMwR) package20 and the Synthetic minority over‐sampling technique (SMOTE) method,21 the eight generated time windows of the training data sets were balanced for the binary outcome to increase the power of prediction beyond a 50/50 probability.
Classification model development
Figure 1 shows a schema for the process of classification model development. The modeling approach compared the performance of different learning algorithms in order to identify the most sensitive and accurate classifier as well as the most informative attributes (or risk factors) that predicted the onset of DN. The learning algorithms tested were One Rule (1R), J48 Decision Tree (J48), Random Forest (RF), Simple Logistic (SL), Sequential Minimal Optimization (SMO), and Naïve Bayes (NB).22, 23, 24 The 1R algorithm generates one rule for each predictor in the data selecting the rule with the smallest total error as its “one rule.” Whereas, the J48 and RF are both decision tree learners that break down the data set into smaller subsets and develop an associated decision tree. The SL algorithm builds linear logistic regression models with built‐in attribute selection. SMO algorithm is used for support vector classification and implements John Platt's sequential minimal optimization algorithm for training a support vector classifier. Finally, NB is based on the standard probabilistic NB theorem with independence assumptions between predictors.24
Figure 1.
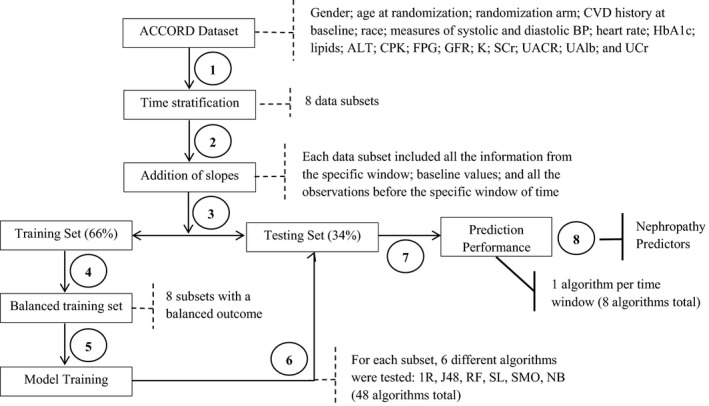
Model development. Development of the classification model: 1. Feature selection. All the available attributes were analyzed. The Action to Control Cardiovascular Risk in Diabetes (ACCORD) data set was divided into eight different time windows. 2. Data enhancement. The slopes for each attribute were calculated for each time window in order to account for the change per year. 3. Data splitting. Each subset of data was randomly allocated into separate training and testing data sets using the sample_frac function. 4. Data balancing. Training subsets were balanced for the binary outcome (presence or absence of nephropathy) using the SMOTE method. 5. Model training. Different classifiers were evaluated following a 10‐fold cross‐validation. 6. Model validation. The learning algorithms were tested using the testing subsets. 7. Model selection. Evaluation of receiver operating characteristics (ROCs) and true positive rates (TPRs) to identify the most sensitive and accurate classifier. 8. Attribute selection. Identification of the most predictive attributes using the InfoGain method. Notes: Dash lines represent the result from each step of the process. Bold lines represent the final outcome of the model development. Italic font represents the implemented method. 1R, One Rule; ALT, alanine aminotransferase; BP, blood pressure; CPK, creatinine phosphokinase; CVD, cardiovascular disease; FPG, fasting plasma glucose; GFR, glomerular filtration rate; HbA1c, glycosylated hemoglobin; J48, J48 Decision Tree; K, potassium; NB, Naïve Bayes; RF, Random Forest; SCr, serum creatinine; SL, Simple Logistic; SMO, Sequential Minimal Optimization; UAlb, urinary albumin; UACR, urinary albumin to creatinine ratio; UCr, urinary creatinine. For more details, please refer to the text.
A 10‐fold cross‐validation technique was used for predicting the error rate for each time window. Predictive performance of the classifiers was evaluated by the accuracy of the prediction, using the receiver operating characteristic (ROC) curve and the sensitivity of the prediction, which corresponds to the true positive rate (TPR):
| (2) |
where a true positive (TP) is present when the predicted and the actual condition are positive (present DN), and a false negative (FN) when the patient is classified as DN negative but they actually developed DN.
To identify the most important attributes (or risk factors) for classification, attribute selection was performed using the InfoGain method in Waikato Environment for Knowledge Analysis (WEKA),24 which evaluates the worth of an attribute by measuring the information gain with respect to the class or outcome:
| (3) |
whereClass = Binary outcome (DN/absence of nephropathy), Attribute = Evaluated parameter (BP, GFR, HbA1c, UACR, etc.), also seen as risk factor.
Results
Study population
Observations from 10,251 patients with T2DM were obtained from the ACCORD study. Participants were middle‐aged and older patients (mean age 63 years) with mean diabetes duration of 10 years. Most of the population was men (61%) and whites (62%) with an HbA1c of 8.3% (67 mmol/mol). Mean baseline measurements included estimated GFR by the Modification of Diet in Renal Disease equation of 89.6 mL/min/1.73 m2, 0.9 mg/dL for SCr, 1.59 mg/dL for UAlb, 14 mg/g for UACR, 40 mg/dL for HDL, and 4.4 mmol/L for K (Table 1).
Table 1.
Patient baseline characteristics from the ACCORD trial (n = 10,251)
| Variable | Mean (SD) or Median [IQR] |
|---|---|
| Age, year | 62.8 (6.6) |
| Male | 6,299 (61.4%) |
| Race | |
| Black | 1,953 (19%) |
| White | 6,393 (62%) |
| Hispanic | 737 (7%) |
| Other | 1,168 (11%) |
| History of CV event, n | 3,609 (35.2%) |
| GHb, % {mmol/mol} | 8.3 (1.01) {67} |
| Blood pressure, mmHg | |
| Systolic | 136.2 (16.5) |
| Diastolic | 74.7 (10.2) |
| eGFR, mL/minute/1.73 m2 | 89.6 [75.4–105.1] |
| SCr, mg/dL | 0.9 [0.8–1.0] |
| UCr, mg/dL | 114.7 [79.4–158.5] |
| UAlb, mg/dL | 1.59 [0.7–4.96] |
| Cholesterol, mg/dL | 182.9 |
| LDL | 104.9 (33.9) |
| HDL | 41.9 (11.6) |
| Triglycerides, mg/dL | 155.5 [106–229] |
| LDL | 101 [81–125] |
| HDL | 40 [34–48] |
| FPG, mg/dL | 167 [138–204] |
| ALT, mg/dL | 24 [18–32] |
| CPK, mg/dL | 105 [72–164] |
| K, mmol/L | 4.4 [4.2–4.7] |
| UACR, mg/g | 14 [7–47] |
ACCORD, Action to Control Cardiovascular Risk in Diabetes; ALT, alanine aminotransferase; CPK, creatinine phosphokinase; CV, cardiovascular; FPG, fasting plasma glucose; eGFR, estimated glomerular filtration rate; GHb, glycosylated hemoglobin; HDL, high‐density lipoprotein; IQR, interquartile range; K, potassium; LDL, low‐density lipoprotein; SCr, serum creatinine; UACR, urinary albumin to creatinine ratio; UAlb, urinary albumin; UCr, urinary creatinine.
Data mining
There were 6,777 patients (66%) with T2DM who developed nephropathy throughout the study (Figure 2). After the stratification of the data into eight time windows, 2,050 patients (25%) developed DN during the first 5.9 months, whereas 8,184 (75%) did not exhibit DN; in the time window of 6–11.9 months, data reflecting DN occurred in 1,350 patients (20%; from the previous 8,184) and 6,834 (80%) continued without DN. After the first year, the analysis was performed in bands of 1‐year for a total of 7 years. In the last time window, 64 of 3,521 patients developed DN and the remaining 3,457 had not yet exhibited DN based on the a priori classification of DN. After balancing the binary outcome, a more even distribution of DN was obtained for each time window (Table S1 ).
Figure 2.
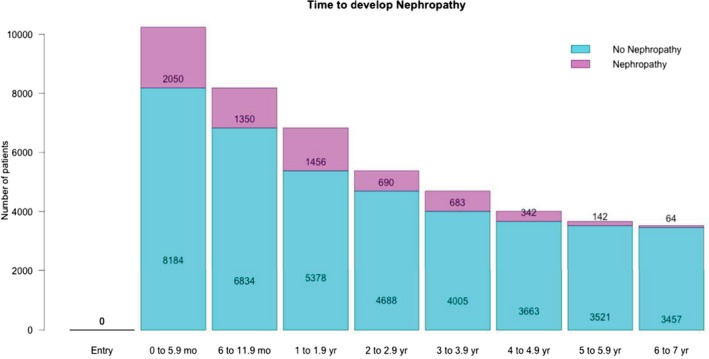
Incidence of nephropathy among the Action to Control Cardiovascular Risk in Diabetes (ACCORD) population. Blue bars represent the number of patients who did not develop nephropathy while the pink bars are the number of patients who developed nephropathy within the specified time window on the x‐axis.
Figure 3 shows that the most prevalent factor reflecting the development of DN was the decline in GFR. After 6 months, 2,039 patients had either doubled their baseline SCr or had a decrease in GFR (Figure 3 a). Micro‐albuminuria and macro‐albuminuria were not indicators of DN until after the first year of the ACCORD study (Figure 3 b,c). There were 102 cases of renal failure (Figure 3 d).
Figure 3.
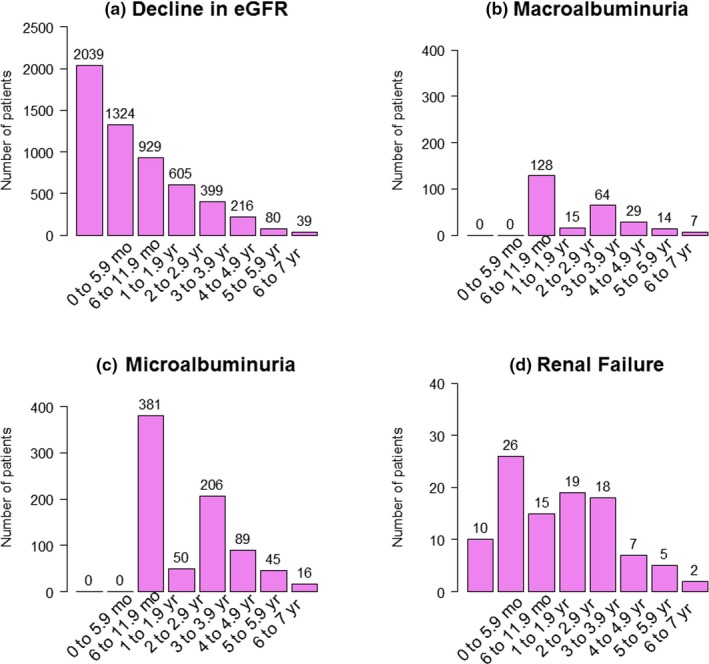
Incidence of the different nephropathies in patients with type 2 diabetes from Action to Control Cardiovascular Risk in Diabetes (ACCORD) study across time windows. (a) Decline in estimated glomerular filtration rate (eGFR); (b) macroalbuminuria; (c) microalbuminuria; and (d) renal failure.
A decrease in GFR or doubled baseline SCr was present in >56% of the population with nephropathy. Although there were not cases of micro‐albuminuria or macro‐albuminuria during the first year of the study, these complications of diabetes were more prevalent and persistent from the third to the seventh year (9–11% and 25–31%, respectively). For the 25% of the patients who developed DN within the second year, there was an increase in filtration in the first year of the study; in this subgroup, 52% developed either micro‐albuminuria or macro‐albuminuria. Ultimately, there were 431 patients who developed micro‐albuminuria and 143 patients who developed macro‐albuminuria by the end of year 2. Renal failure occurred in <3% of the patients who developed DN. Only 10 of 2,050 patients developed renal failure in the presence of a GFR decline, whereas most of the remaining cases of renal failure had a decline in GFR before year 4 (Figure 3 d).
Classification model performance
The ROC curve is used to evaluate the balance between the benefit (TP) and cost (false positive). An ROC value > 0.7 reflects good predictive performance by the classifier, whereas a value below 0.50 indicates that the algorithm is not able to distinguish between true and false outcomes.24, 25 All of the evaluated learning algorithms during the training phase correctly classified 80% of the instances of DN on average coefficient of variation (CV) = 7.39) and had ROC values > 0.70 (M = 0.84; CV = 6.05; Figure 4, Table S2). The 1R algorithm had stable performance across the different time windows (with TPRs between 0.76 and 0.86; and ROCs > 0.7). Overall, NB correctly classified 77% of the instances of DN with an ROC of 0.83. RF and SL exhibited > 72% and 76% of correctly classified instances, respectively, and ROC values close to 1 and above 0.811, respectively.
Figure 4.
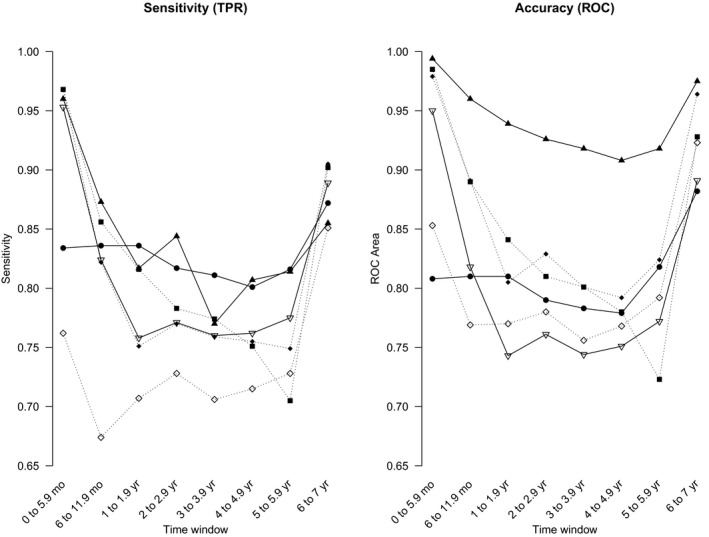
Sensitivity and accuracy (receiver operating characteristic (ROC) areas) for the training data sets at the established time windows using different algorithms in Waikato Environment for Knowledge Analysis (WEKA). Black circles = one rule; black squares = J48; black triangles = random forest; black diamonds = simple logistic; white triangles = sequential minimal optimization (SMO); white diamonds = Naïve Bayes. TPR, true positive rate.
Likewise, RF correctly classified >84% (M = 0.91; CV = 5.99) of the instances with ROC values > 0.60 (M = 0.73; CV = 18.82; Figure 5, Table S3) during the validation phase, except on the 1–1.9‐year period, where the sensitivity fell to 69%. The NB approach correctly classified between 64% and 93% of the instances through the different windows of time and exhibited the lowest accuracy (ROCs between 0.50 and 0.78). The SL algorithm showed more consistency during the validation phase. Eighty‐two percent of the instances of DN were correctly classified with ROC values above 0.8 for the first two and last window of time, and between 0.6 and 0.8 for the rest of the time periods.
Figure 5.
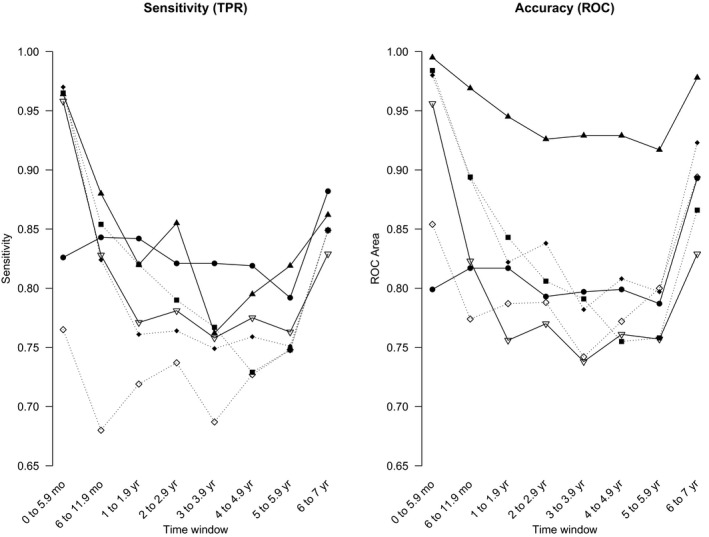
Sensitivity and accuracy (receiver operating characteristic (ROC) areas) for the testing data sets at the established time windows using different algorithms in Waikato Environment for Knowledge Analysis (WEKA). Black circles = one rule; black squares = J48; black triangles = random forest; black diamonds = simple logistic; white triangles = sequential minimal optimization (SMO); white diamonds = Naïve Bayes. TPR, true positive rate.
J48, RF, SL, and SMO exhibited a great performance during the first windows of time, correctly classifying DN in >82% of instances in both the training and validation subsets. SL was the only algorithm that showed good accuracy (ROC > 0.7) for the 2–2.9‐year period (Figure 5 5, Table S4, S1 ‐ S8).
Risk markers
Table 2 2 shows the top attributes that were identified as the best predictors of DN using the Random Forest Method. The listing of attributes is rank‐ordered from greatest to least, top to bottom, by the degree of importance or influence for each time window. K, UCr, albumin, cholesterol, LDL, and UACR at baseline were the most consistent classifiers for all time windows. Age, baseline values for GFR, CPK, triglycerides, and FPG, and values at month 4 for GFR and FPG were consistently predictive. For the first 5.9 months, GFR at baseline (GFR00) had the highest predictive influence followed by UCr, age, UAlb, CPK, triglycerides, FPG, and K at baseline. After the first year, the slopes of the indicator attributes gained importance for the predictions. In particular, the slope of change in the first year for GFR (s1.GFR) was an important predictor of DN in years 2–6. During the first 2 years of the study, LDL and systolic BP at baseline, and K and FPG at month 4 played a significant role for the predictions. By the end of the study, final slopes contributed more for the predictions than actual values of the attributes, such as UACR, UAlb, and GFR. Additional slopes of particular importance throughout the study include FPG, triglycerides, UCr, LDL, and systolic and diastolic BP.
Table 2.
Predictive risk factors through the established time windows
| Time windowa | 0–5.9 months | 6–11.9 months | 1–1.9 years | 2–2.9 years | 3–3.9 years | 4–4.9 years | 5–5.9 years | 6–7 years |
|---|---|---|---|---|---|---|---|---|
| Risk factor (ranked by highest to lowest importance)b | GFR00c , e | GFR00c , e | UAlb00d | GFR00c , e | UCr00d | UAlb00d | s1.dBP | K00d |
| UCr00d | UCr00d | GFR00c , e | Trig00c | Agec | FPG00c | UACR00d | UAlb86 | |
| GFR04c | UAlb00d | UCr00d | s2.GFR | CPK00c | UCr00d | LDL24 | fs.UAlb | |
| Agec | GFR04c | s1.GFR | UAlb00d | Trig00c | Trig00c | sBP16 | fs.UACR | |
| UAlb00d | Agec | Trig00c | UCr00d | FPG00c | Chol00d | HbA1c00 | fs.GFR | |
| CPK00c | Trig00c | FPG00c | s1.GFRf | GFR04c | LDL00d | HDL00f | s3.vLDL | |
| Trig00c | CPK00c | CPK00c | FPG00c | K00d | K04 | s1.LDL | Trig00 | |
| FPG00c | GFR08 | Agec | Chol00d | GFR00c | UACR00d | K00d | s3.Trig | |
| K00d | FPG00c | GFR04c | CPK00c | s2.Trig | s3.GFR | Chol00d | s1.FPG | |
| Arm | K00d | K00d | UCr24 | Trig12 | K08 | s3.sBP | HDL24 | |
| LDL00d | K08 | LDL00d | K12 | Chol00d | GFR04c | s1.GFRf | HDL00f | |
| Chol00d | Chol00d | Chol00d | Agec | s3.GFR | GFR36 | Agec | Chol00d | |
| sBP00e | FPG08c | GFR12 | s1.FPG | FPG04c | GFR00c | FPG08 | LDL00d | |
| FPG04c , e | LDL00d | FPG04c , e | s2.UCr | FPG08c | s2.GFR | GFR00c | UAlb00d | |
| K04e | UACR00d | s1.FPG | FPG08c | s1.GFRf | HbA1c08 | UAlb00d | FPG00c | |
| vLDL | FPG04c , e | s1.Trig | LDL00d | LDL00d | sBP00 | UCr00d | UCr00d | |
| UACR00d | K04e | UACR00d | K00d | UACR00d | K00d | GFR04c | GFR04c | |
| dBP00 | sBP00e | FPG08c | UACR00d | UAlb00d | Agec | LDL00d | UACR00d |
ALT, alanine aminotransferase; dBP, diastolic blood pressure; Chol, cholesterol; CPK, creatinine phosphokinase; FPG, fasting plasma glucose; fs, final slope (from baseline to the end of the study); GFR, glomerular filtration rate; HbA1c, glycosylated hemoglobin; HR, heart rate; HDL, high‐density lipoprotein; K, potassium; LDL, low‐density lipoprotein; s, slope of change; sBP, systolic blood pressure; SCr, serum creatinine; UACR, urinary albumin to creatinine ratio; UAlb, urinary albumin; UCr, urinary creatinine; VLDL, very low‐density lipoprotein.
Numbers following a risk factor indicate the number of months from baseline (00), whereas numbers preceding the risk factor and accompanied by a slope(s) denote the year of change. Thus, GFR04 corresponds to the GFR measurement at month 4; s1.GFR corresponds to the change in GFR from baseline to year 1.
aTime after the diagnosis of diabetes. bDisplayed in order of importance (from top to bottom). cRisk factors that fed the classifiers in at least 4 windows of time. dThose that were consistent throughout the study. eThose that were important for the first <3 years. fThose that gained importance after year 2.
Discussion
The purpose of the research was to identify predictive risk factors of DN utilizing data from an existing public trial database from patients with T2DM. ML techniques have become essential tools in the biomarker discovery process.26 Six ML methods were applied to evaluate the factors affecting the progression of diabetes leading to DN.
Study population
ACCORD is a data‐rich study that provided the opportunity to examine the clinical factors that lead to DN, a major and life threatening complication of diabetes. Classifier models were used to assess commonly available clinical data as predictors of a binary outcome, and the development or absence of DN. The large number of patients with T2DM who developed DN within the first year may be explained by the design of the ACCORD study, which was intended to investigate whether intensive vs. standard therapies that normalize a patient's HbA1c would have an impact on the incidence of cardiovascular events.27 Presence of DN in the first 6 months may only represent transient changes in kidney perfusion or function.7 Yet, given the fact that none of these patients developed micro‐albuminuria by that time, they are likely predominantly in stage 2 of DN, where hyperfiltration is observed.28 Micro‐albuminuria accompanied by a large decrease in GFR has been reported as a signal of the incipient stage of DN and as a precursor of macro‐albuminuria in T2DM.29 Therefore, patients who develop micro‐albuminuria and macro‐albuminuria are at higher risk of stage 3 or stage 4 DN by year 3.
Data mining and model performance
Different approaches have been explored in order to identify new biomarkers for DN.30, 31 Here, a binary classifier for the prediction of the development or absence of DN was built implementing ML methods. Classification trees, such as 1R, J48, and RF, are the most widely used due to their simplicity, speed of classifying, and intuitive graphical representation.26 RF has been successfully used to identify predictors involved in interactions.22 Overall, RF exhibited the best performance among the tested methods. Another advantage of RF is that it provides an improved understanding of the importance of a parameter to both the model and the disease.32 Although the NB model has been widely used because of its simplicity and robustness,33 it was associated with the lowest predictive performance.
As reported by Basu et al.,34 application of ML methods with cross‐validation approaches may aid in detecting clinically important factors that contribute to a specific outcome. Therefore, the 10‐fold cross‐validation method24 and a testing set were used to guard against overfitting and model bias, supporting the findings described here.
Model predictors
Assessing the impact of each attribute in these classification models could lead to increased clinical insight regarding DN as the analysis provides a robust framework for testing biomarkers that are predictive of DN in a population of patients with T2DM.
GFR at baseline (GFR00; Table 2) was the most important attribute leading to DN, followed by UCr and UAlb at baseline. Likewise, weighted models incorporating albuminuria were shown to have a statistically significant association with development of ESRD using baseline patient data from patients with T2DM.35 Moreover, macro‐albuminuria has been associated with developing a decline in renal function.36 Although DN was defined as the presence of any microvascular event related to nephropathy, the number of patients who either doubled their baseline SCr or experienced a decrease in GFR was greater than the number of patients exhibiting renal failure, micro‐albuminuria, and macro‐albuminuria combined (Figure 1).
The importance of cholesterol control in T2DM was also important throughout the study (Table 2). Although not many studies have reported HDL as a risk factor to develop DN, these findings seem to be in agreement with previous reports suggesting dyslipidemia as a potential risk marker for diabetic kidney disease.6, 37 Other investigations have reported a cross‐sectional relationship between the lipid‐subtype “fingerprint” and advanced kidney disease.38 In our models, HDL at baseline gained importance for the prediction of DN in the fifth through seventh years. The inclusion of time varying attributes in the analysis may be advantageous to predict the outcome. Interestingly, the slopes of change after years 1, 2, and 3 of the study (s1., s2., and s3.Trig in Table 2) became important predictors beginning at year 2, suggesting that the lipid control over time is extremely important in patients with T2DM, especially in those with cardiovascular risks who have shown a correlation with dyslipidemia under such conditions.6
Previously, systolic BP was associated with a decline in GFR.6, 35, 39 Likewise, our predictive model suggested that baseline systolic BP (mean systolic BP 136.2 mmHg) exhibited importance as a predictor of DN at the beginning of the study as well as in year 5. By year 6, the slopes of change after years 1 and 3 for diastolic and systolic BP, respectively, gained more importance than the baseline values. In agreement with previous studies,6, 35, 39 differences between the beginning and the end of the study for UACR, UAlb, and GFR were significant in predicting late DN (i.e., later in the ACCORD study).
This study confirms the established risk factors of DN and draws attention to an enhanced importance of lipid, glucose, proteinuria, and K control among patients with T2DM. Moreover, our analysis exemplifies the use of ML techniques in predictive medicine, which might benefit from such learning approaches.
The classified models and analysis presented have important limitations. Even though four different microvascular observations were analyzed, DN was defined as a binary outcome (present or absent). The analysis excluded data for patients once they were classified as having developed DN, which omits the assessment of cases where the patient reverts to a classification of absent DN. This approach did not permit an assessment of the progression of DN symptoms, which was perhaps especially impactful for patients excluded after DN development in the early time periods. Further modeling and exploration of the progression of the DN data might allow an enhanced assessment of continually worsening disease complications.
The ACCORD data set did not include more novel biomarkers of DN; it only contains routinely measured clinical factors, such as eGFR, SCr, HbA1c, etc. Testing of other predictive biomarkers, such as tumor necrosis factor‐α, transforming growth factor‐β, vascular endothelial growth factor, or interleukin‐1β, that may be more closely related to mechanisms of DN pathogenesis7 was not possible. However, studies focusing on the pathophysiologic mechanism of diabetic kidney disease have been performed showing that tumor necrosis factor receptor‐1, tumor necrosis factor receptor‐2, and plasma kidney injury molecule‐1 are associated with higher risk of eGFR decline in persons with T2DM with early and advanced diabetic kidney disease.40
It is also important to note that only internal validation was performed in this analysis. Therefore, these results apply to the population that met inclusion criteria for ACCORD. Additional exploration and analyses on healthcare medical records databases is being planned to assess the generalizability of our findings.
In summary, this study illustrates the usefulness of ML techniques in identifying biomarkers that lead to the development of DN in T2DM from the ACCORD patient population. Among the tested methods, Random Forest and Simple Logistic Regression exhibited the best performance and showed that GFR, UCr, UAlb, UACR, K, cholesterol, and LDL at baseline as well as the changes per year in GFR, FPG, and triglycerides for the first 1–3 years are the key identifiable predictors for DN.
The use of these predictive models within the construct of healthcare medical record databases has the potential to provide clinical meaningful tools for patient‐factor risk assessment. Future studies into the prediction of DN should aim to optimize outcome measures where the identification between the different stages of the disease might be seen. For example, analyses stratifying the baseline GFR and/or urinary albumin excretion, as well as evaluating periods of hyperfiltration or increasing GFR may prove to be useful.
Funding
The research was supported by a grant from Takeda Pharmaceutical International Co.
Conflict of Interest
All authors declared no competing interests for this work.
Author Contributions
V.R.R., R.F.B., B.S.D., G.L., M.V., and R.R.B. wrote the manuscript. R.R.B. designed the research. V.R.R. and R.R.B. performed the research. V.R.R. analyzed the data.
Supporting information
Figure S1. Discrete‐time data format for model development.
Table S1. Data sets before and after the balancing.
Table S2. Results after training the data sets at the established time windows using the different algorithms in WEKA.
Table S3. Results after re‐evaluating the testing data sets with the trained algorithms at the established time windows in WEKA.
Table S4. Summary table of the supplementary material.
Supplementary material S1. Results from WEKA after training the data set from the window 0–5.9 months.
Supplementary material S2. Results from WEKA after training the data set from the window 6–11.9 months
Supplementary material S3. Results from WEKA after training the data set from the window 1–1.9 years.
Supplementary material S4. Results from WEKA after training the data set from the window 2–2.9 years.
Supplementary material S5. Results from WEKA after training the data set from the window 3–3.9 years.
Supplementary material S6. Results from WEKA after training the data set from the window 4–4.9 years.
Supplementary material S7. Results from WEKA after training the data set from the window 5–5.9 years.
Supplementary material S8. Results from WEKA after training the data set from the window 6–7 years.
Data setCode 1
Data setCode 1
Acknowledgment
This manuscript was prepared using ACCORD research materials obtained from the National Heart, Lung, and Blood Institute (NHLBI) Biologic Specimen and Data Repository Information Coordinating Center and does not necessarily reflect the opinions or views of the ACCORD or the NHLBI.
References
- 1. International Diabetes Federation (IDF) . Diabetes Atlas. 2nd edition. 2003:297. <https://www.idf.org/e-library/epidemiology-research/diabetes-atlas/23-atlas-2nd-edition-year.html>. Accessed May 2018.
- 2. International Diabetes Federation (IDF) . Diabetes Atlas. 8th edition. 2017:150. <http://www.diabetesatlas.org/across-the-globe.html>. Accessed February 5, 2019.
- 3. Ahmad, J. Management of diabetic nephropathy: recent progress and future perspective. Diabetes Metab. Syndr. 9, 343–358 (2015). [DOI] [PubMed] [Google Scholar]
- 4. Narres, M. et al The incidence of end‐stage renal disease in the diabetic (compared to the non‐diabetic) population: a systematic review. PLoS One 11, e0147329 (2016). [DOI] [PMC free article] [PubMed] [Google Scholar]
- 5. Bell, S. et al End‐stage renal disease and survival in people with diabetes: a national database linkage study. QJM 108, 127–134 (2015). [DOI] [PMC free article] [PubMed] [Google Scholar]
- 6. Radcliffe, N.J. , Seah, J.M. , Clarke, M. , MacIsaac, R.J. , Jerums, G. & Ekinci, E.I. Clinical predictive factors in diabetic kidney disease progression. J. Diabetes Investig. 8, 6–18 (2017). [DOI] [PMC free article] [PubMed] [Google Scholar]
- 7. Kishore, L. , Kaur, N. & Singh, R. Distinct biomarkers for early diagnosis of diabetic nephropathy. Curr. Diabetes Rev. 13, 598–605 (2016). [DOI] [PubMed] [Google Scholar]
- 8. Liu, M. et al Cardiovascular disease and its relationship with chronic kidney disease. Eur. Rev. Med. Pharmacol. Sci. 18, 2918–2926 (2014). [PubMed] [Google Scholar]
- 9. Adler, A.I. , Stevens, R.J. , Manley, S.E. , Bilous, R.W. , Cull, C.A. & Holman, R.R. Development and progression of nephropathy in type 2 diabetes: the United Kingdom Prospective Diabetes Study (UKPDS 64). Kidney Int. 63, 225–232 (2003). [DOI] [PubMed] [Google Scholar]
- 10. Bjornstad, P. , Cherney, D. & Maahs, D.M. Early diabetic nephropathy in type 1 diabetes: new insights. Curr. Opin. Endocrinol. Diabetes Obes. 21, 279–286 (2014). [DOI] [PMC free article] [PubMed] [Google Scholar]
- 11. Krolewski, A.S. Progressive renal decline: the new paradigm of diabetic nephropathy in type 1 diabetes. Diabetes Care 38, 954–962 (2015). [DOI] [PMC free article] [PubMed] [Google Scholar]
- 12. American Diabetes Association . 8. Pharmacologic approaches to glycemic treatment: standards of medical care in diabetes‐2018. Diabetes Care 41 (suppl. 1), S73–S85 (2018). [DOI] [PubMed] [Google Scholar]
- 13. American Diabetes Association . Nephropathy in diabetes (position statement). Diabetes Care 27 (suppl. 1), S81–S83 (2004). [Google Scholar]
- 14. Action to Control Cardiovascular Risk in Diabetes (ACCORD) 2016. <https://clinicaltrials.gov/ct2/show/results/NCT00000620?sect=X0156;>.
- 15. Frank, E. , Hall, M.A. & Witten, I.H. The WEKA Workbench. 3.7.13 ed 2016.
- 16. R Foundation for Statistical Computing . A Language and Environment for Statistical Computing. 3.1.3 ed. (R Foundation for Statistical Computing, Vienna, Austria, 2015). [Google Scholar]
- 17. Buse, J.B. et al Action to Control Cardiovascular Risk in Diabetes (ACCORD) trial: design and methods. Am. J. Cardiol. 99, 21i–33i (2007). [DOI] [PubMed] [Google Scholar]
- 18. Ismail‐Beigi, F. et al Effect of intensive treatment of hyperglycaemia on microvascular outcomes in type 2 diabetes: an analysis of the ACCORD randomised trial. Lancet 376, 419–430 (2010). [DOI] [PMC free article] [PubMed] [Google Scholar]
- 19. Data Science made simple. <http://www.datasciencemadesimple.com/select-random-samples-r-dplyr-sample_n-sample_frac/>. Accessed February 2019.
- 20. Torgo, L. Data Mining Using R: Learning with Case Studies. (Chapman and Hall/CRC; Press Taylor & Francis Group, New York, 2010). [Google Scholar]
- 21. Chawla, N.V. , Bowyer, K.W. , Hall, L.O. & Kegelmeyer, W.P. SMOTE: synthetic minority over‐sampling technique. J. Artif. Intell. Res. 16, 321–357 (2002). [Google Scholar]
- 22. Tina, R. & Patil, S.S.S. Performance analysis of naive Bayes and J48 classification algorithm for data classification. Int. J. Comput. Sci. Appl. 6, 6 (2013). [Google Scholar]
- 23. Boulesteix, A.‐L.J.S. , Kruppa, J. & Konig, I.R. Overview of random forest methodology and practical guidance with emphasis on computational biology and bioinformatics. WIREs Data Mining Knowl. Discov. 2, 493–507 (2012). [Google Scholar]
- 24. Witten, I.H. , Frank, E. & Hall, M.A. Data Mining: Practical Machine Learning Tools and Techniques. Third ed. (Morgan Kaufmann, Burlington, MA, 2011). [Google Scholar]
- 25. Tharwat, A. Applied Computing and Informatics. (2018).
- 26. Inza, I. , Calvo, B. , Armañanzas, R. , Bengoetxea, E. , Larrañaga, P. & Lozano, J.A. Machine learning: an indispensable tool in bioinformatics In Bioinformatics Methods in Clinical Research (ed. Press H.). 25–48.27 (Springer Protocols, Portugal, 2010). [DOI] [PubMed] [Google Scholar]
- 27. Gerstein, H.C. et al Effects of intensive glucose lowering in type 2 diabetes. N. Engl. J. Med. 358, 2545–2559 (2008). [DOI] [PMC free article] [PubMed] [Google Scholar]
- 28. Tonneijck, L. et al Glomerular hyperfiltration in diabetes: mechanisms, clinical significance, and treatment. J. Am. Soc. Nephrol. 28, 1023–1039 (2017). [DOI] [PMC free article] [PubMed] [Google Scholar]
- 29. Macisaac, R.J. , Ekinci, E.I. & Jerums, G. Markers of and risk factors for the development and progression of diabetic kidney disease. Am. J. Kidney Dis. 63 (2 suppl. 2), S39–S62 (2014). [DOI] [PubMed] [Google Scholar]
- 30. Mayer, G. et al Systems biology‐derived biomarkers to predict progression of renal function decline in type 2 diabetes. Diabetes Care 40, 391–397 (2017). [DOI] [PubMed] [Google Scholar]
- 31. Huang, M. et al Biomarkers for early diagnosis of type 2 diabetic nephropathy: a study based on an integrated biomarker system. Mol. BioSyst. 9, 2134–2141 (2013). [DOI] [PubMed] [Google Scholar]
- 32. Hstie, T. , Tibshirani, R. & Friedman, J. Boosting and additive trees In: The Elements of Statistical Learning Data Mining, Inference, and Prediction. 2nd ed. (Springer, editor Springer Series in Statistics, Stanford, California.) 337–384 (2009). [Google Scholar]
- 33. Wu, X.K.V. et al Top 10 algorithms in data mining. Knowl. Inf. Syst. 14, 1–37 (2008). [Google Scholar]
- 34. Basu, S. , Raghavan, S. , Wexler, D.J. & Berkowitz, S.A. Characteristics associated with decreased or increased mortality risk from glycemic therapy among patients with type 2 diabetes and high cardiovascular risk: machine learning analysis of the ACCORD trial. Diabetes Care 41, 604–612 (2018). [DOI] [PMC free article] [PubMed] [Google Scholar]
- 35. Elley, C.R. et al Derivation and validation of a renal risk score for people with type 2 diabetes. Diabetes Care 36, 3113–3120 (2013). [DOI] [PMC free article] [PubMed] [Google Scholar]
- 36. Tziomalos, K. & Athyros, V.G. Diabetic nephropathy: new risks factors and improvements in diagnosis. Rev. Diabet. Stud. 12, 110–118 (2015). [DOI] [PMC free article] [PubMed] [Google Scholar]
- 37. Meikle, P.J. , Wong, G. , Barlow, C.K. & Kingwell, B.A. Lipidomics: potential role in risk prediction and therapeutic monitoring for diabetes and cardiovascular disease. Pharmacol. Ther. 143, 12–23 (2014). [DOI] [PubMed] [Google Scholar]
- 38. Reis, A. et al Top‐down lipidomics of low density lipoprotein reveal altered lipid profiles in advanced chronic kidney disease. J. Lipid Res. 56, 413–422 (2015). [DOI] [PMC free article] [PubMed] [Google Scholar]
- 39. Jardine, M.J. et al Prediction of kidney‐related outcomes in patients with type 2 diabetes. Am. J. Kidney Dis. 60, 770–778 (2012). [DOI] [PubMed] [Google Scholar]
- 40. Coca, S.G. et al Plasma biomarkers and kidney function decline in early and established diabetic kidney disease. J. Am. Soc. Nephrol. 28, 2786–2793 (2017). [DOI] [PMC free article] [PubMed] [Google Scholar]
Associated Data
This section collects any data citations, data availability statements, or supplementary materials included in this article.
Supplementary Materials
Figure S1. Discrete‐time data format for model development.
Table S1. Data sets before and after the balancing.
Table S2. Results after training the data sets at the established time windows using the different algorithms in WEKA.
Table S3. Results after re‐evaluating the testing data sets with the trained algorithms at the established time windows in WEKA.
Table S4. Summary table of the supplementary material.
Supplementary material S1. Results from WEKA after training the data set from the window 0–5.9 months.
Supplementary material S2. Results from WEKA after training the data set from the window 6–11.9 months
Supplementary material S3. Results from WEKA after training the data set from the window 1–1.9 years.
Supplementary material S4. Results from WEKA after training the data set from the window 2–2.9 years.
Supplementary material S5. Results from WEKA after training the data set from the window 3–3.9 years.
Supplementary material S6. Results from WEKA after training the data set from the window 4–4.9 years.
Supplementary material S7. Results from WEKA after training the data set from the window 5–5.9 years.
Supplementary material S8. Results from WEKA after training the data set from the window 6–7 years.
Data setCode 1
Data setCode 1