Abstract
Although Neandertal sequences that persist in the genomes of modern humans have been identified in Eurasians, comparable studies in people whose ancestors hybridized with both Neandertals and Denisovans are lacking. We developed an approach to identify DNA inherited from multiple archaic hominin ancestors and applied it to whole-genome sequences from 1523 geographically diverse individuals, including 35 previously unknown Island Melanesian genomes. In aggregate, we recovered 1.34 gigabases and 303 megabases of the Neandertal and Denisovan genome, respectively. We use these maps of archaic sequences to show that Neandertal admixture occurred multiple times in different non-African populations, characterize genomic regions that are significantly depleted of archaic sequences, and identify signatures of adaptive introgression.
For much of human history, modern humans overlapped in time and space with other hominins (1). Analyses of the Neandertal (2, 3) and Denisovan (4, 5) genomes revealed that gene flow occurred between these archaic hominins and the ancestors of modem humans (3–8). Consequently, all non-African populations derive ~2% of their ancestry from Neandertals (3), whereas substantial levels of Denisovan ancestry (~2 to 4%) are only found in Oceanic populations (5), although low levels of Denisovan ancestry may be more widespread (9, 10). Recently, catalogs of introgressed Neandertal sequences have been created in Eurasians (11,12). However, considerably less is known about the genomic organization and characteristics of Denisovan sequences that persist in modem individuals.
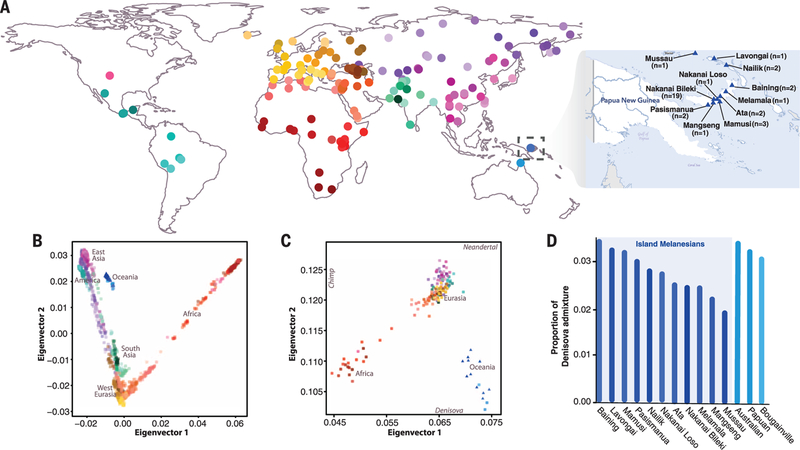
We sequenced 35 individuals from 11 locations in the Bismarck Archipelago of Northern Island Melanesia, Papua New Guinea (Fig. 1A) (13, 14), to a median depth of 40x (tables S1 and S2), including a trio to facilitate haplotype reconstruction. Unless otherwise noted, analyses were performed on a subset of 27 unrelated individuals (14). We integrated our sequencing data with single-nucleotide polymorphism genotypes from 1937 individuals spanning 159 worldwide populations (Fig 1A and table S3) (14–16). A global principal components analysis (PCA) and ADMIXTURE analysis shows that our samples cluster most closely with other Oceanic individuals (Fig. 1B and fig. S1), and population sizes inferred by pairwise sequentially Markovian coalescent analysis are consistent with other non-African populations (fig.S2) (14). Furthermore, our Melanesian samples show genetic similarities to both Neandertals and Denisovans, whereas all other non-African populations only exhibit affinity toward Neandertals (Fig. 1C and fig. S3) (14). Using an f4 statistic (14, 15, 17), we find significant evidence of Denisovan ancestry (Z > 4) in our Melanesian samples, with admixture proportions varying between 1.9 and 3.4% (Fig. 1D and table S4).
Fig. 1. Melanesian genomic variation in a global context.
(A) Locations of the 159 geographically diverse populations studied. Information about the Melanesian individuals sequenced (blue triangles) is shown in the inset. (B) PCA of Melanesian genomes in the context of present-day worldwide genetic diversity. (C) Modern human variation projected onto the top two eigenvectors defined by PCA of the Altai Neandertal, Denisovan, and chimpanzee genome (14). Population means were plotted for each of the 11 Melanesian populations and each population of the global data set. (D) Estimates of Denisovan ancestry in Oceanic populations estimated from an f4 statistic (14). The 11 Melanesian populations are highlighted by the light blue box.
Having demonstrated that our Melanesian individuals have both Neandertal and Denisovan ancestry, we developed an approach to recover and classify archaic sequences. Briefly, we first identify putative introgressed sequences using the statistic S* (which does not use information from an archaic reference genome) (11, 18) and then refine this set by comparing significant S* haplotypes to the Neandertal and Denisovan genomes and testing to determine whether they match more than expected by chance. Variation in neutral divergence between archaic groups across loci and incomplete lineage sorting complicate classification of archaic haplotypes as Neandertal or Denisovan (fig. S4) (14). To address this issue, we developed a likelihood method that operates on the bivariate distribution of Neandertal and Denisovan match P values (14). This framework estimates the proportion of Neandertal, Denisovan, and null sequences in the set of S* significant haplotypes, identifies archaic haplotypes at a desired false discovery rate (FDR), and probabilistically categorizes them as Neandertal, Denisovan, or ambiguous (i.e., Neandertal or Denisovan status cannot be confidently distinguished) (14). In addition to our Melanesian samples, we also applied our method to whole-genome sequences from 1496 geographically diverse individuals studied as part of the 1000 Genomes Project (table S5) (14, 19).
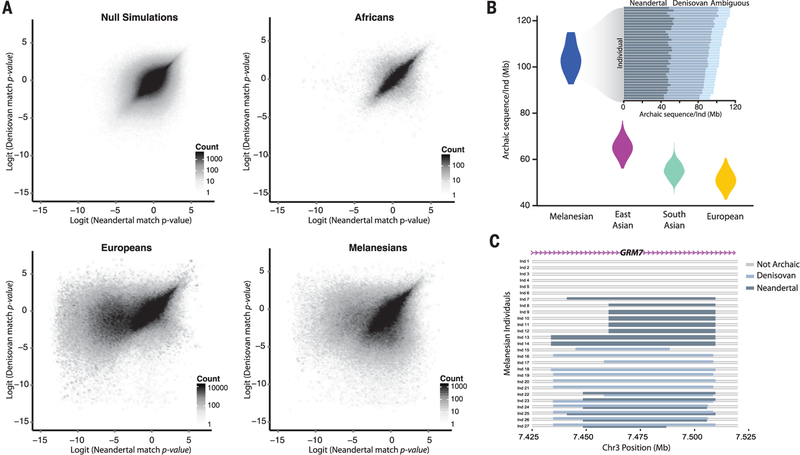
We evaluated our approach through coalescent simulations (figs. S5 and S6) and by analyzing African populations (fig S7). Archaic match P values calculated from null coalescent simulations without archaic admixture and significant S* sequences in African individuals show similar distributions (Fig. 2A), consistent with little to no Neandertal or Denisovan ancestry in most African populations. Notably, Luhya and Gambians do show evidence of having some Neanderthal ancestry (fig S8 and table S6), most likely inherited indirectly through recent admixture with non-Africans (20). In Europeans, we see a strong skew of Neandertal, but not Denisovan, match P values toward zero (Fig 2A). In contrast, Melanesians exhibit a marked skew of both Neandertal and Denisovan match P values toward zero (Fig. 2A).
Fig. 2. Identifying Neandertal and Denisovan sequences in modern human genomes.
(A) Bivariate archaic match P value distributions for simulations of nonintrogressed sequences, Esan in Nigeria, Europeans, and Melanesians. Null simulations and Esan show no skew in Neandertal or Denisovan match P values toward zero, Europeans show only a skew of Neandertal match P values toward zero, and Melanesians exhibit both Neandertal and Denisovan match P values skewed toward zero. (B) Amount of archaic introgressed sequences identified in each population. (Inset) Amount of Neandertal, Denisovan, and ambiguous (Neandertal or Denisovan) introgressed sequences for each Melanesian individual. (C) Schematic representation of introgressed haplotypes in an intronic portion of the GRM7 locus in Melanesian individuals illustrating mosaic patterns of archaic ancestry.
In aggregate, across all 1523 non-African individuals analyzed, we recovered 1340 Mb and 304 Mb of the Neandertal and Denisovan genomes, respectively, at a FDR = 5%. Melanesian individuals have on average 104 Mb of archaic sequences per individual (48.9,42.9, and 12.2 Mb of Neandertal, Denisovan, and ambiguous sequence, respectively) (Fig. 2B). In contrast, we only call between 0.026 Mb (in Esan) to 0.5 Mb (in Luhya) of sequences per individual as archaic in Africans, highlighting that our method and error rates are well calibrated The higher levels of archaic ancestry in Melanesians result in an average of 20 compound homozygous archaic loci per individual, with one Neandertal and one Denisovan haplotype (Fig. 2C and fig. S9). We estimate that 61% of the variability in the amount of Denisovan sequences between individuals is explained by variation in Papuan ancestry (P = 7.8 × 10⁻⁴) (table S7) (14). In other non-Africans, we identify on average 65.0, 55.2, and 51.2 Mb of archaic sequences in East Asians, South Asians, and Europeans, respectively (Fig. 2B). Virtually all of the archaic sequences in these populations are Neandertal in origin, although a small fraction (<1%) of introgressed sequences in East and South Asians are predicted to be Denisovan (fig. S8 and table S6) (14).
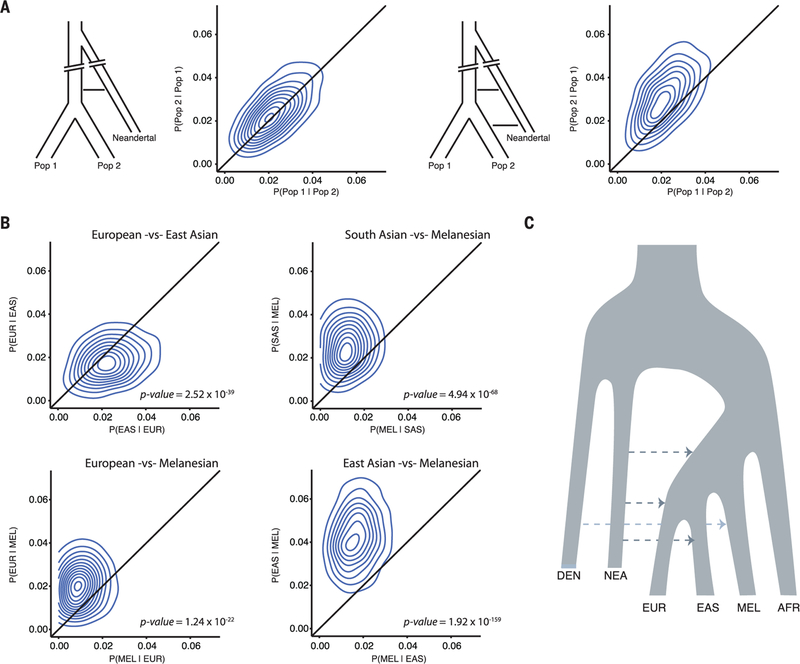
We developed a method to determine whether two populations have shared or unique admixture histories based on patterns of reciprocal sharing of Neandertal sequences among individuals (fig. S10) (14). We validated the expected behavior of our method in simulated data (Fig. 3A) and confirm previous observations of an additional admixture event unique to East Asians (11, 21, 22) (Fig. 3B). We find evidence for an additional pulse of Neandertal admixture in Europeans, East Asians, and South Asians compared with Melanesians (Fig. 3B), which is robust to different statistical thresholds used to call Neandertal and Denisovan sequences and determining significance (figs. S11 to S13) (14). Conversely, we find no evidence of differences in admixture histories between Europeans and South Asians (fig. S14). Collectively, these data suggest that Neandertal admixture occurred at least three distinct times in modern human history (Fig. 3C). Although most South Asian populations show shared histories of archaic admixture, we find significant evidence of differential Neandertal admixture between some European and East Asian populations (figs. S15 to S17).
Fig. 3. Identifying shared and unique pulses of Neandertal admixture among human populations.
(A) Schematics of two simulated introgression models and patterns of reciprocal match probabilities. Contour plots are fit to the scatter plot of reciprocal match probabilities calculated from analyzing all pairwise combinations of individuals between two populations. (Left) Gene flow occurs into the common ancestor of Population 1 and Population 2, and reciprocal match probabilities fall along the diagonal as predicted by theory (binomial test, P > 0.05) (14). Right, Population 2 receives additional admixture shifting reciprocal match probabilities above the diagonal (binomial test, P < 0.05). (B) Reciprocal match probabilities of Neandertal sequences in modern human populations, consistent with additional Neandertal admixture into East Asians versus Europeans, and into Europeans, East Asians, and South Asians versus Melanesians. (C) Simplified schematic of admixture history consistent with the data.
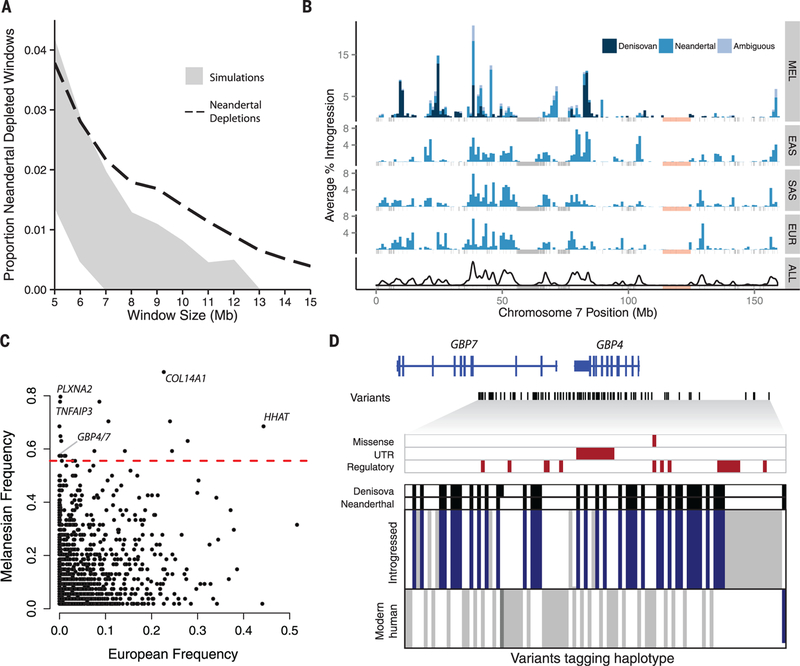
The density of surviving Neandertal sequences across the genome is heterogeneous (11), and regions that are strongly depleted of Neandertal ancestry may represent loci where archaic sequences were deleterious in hybrid individuals and were purged from the population. To quantify how unusual Neandertal depleted regions are under neutral models, we performed coalescent simulations (14), focusing on individuals of European and East Asian ancestry whose demographic histories are known in most detail. Depletions of Neandertal sequences that extend ≥8 Mb are significantly enriched in the observed compared with simulated data (permutation P < 0.01) (Fig 4A and fig. S18). Neandertal depleted regions that span at least 8 Mb are also significantly (Kolmogorov-Smirnov test, P < 10−15) depleted of Neandertal sequences in South Asians and Melanesians (fig. S19 and table S8).
Fig. 4. Maps of archaic admixture reveal signatures of purifying and positive selection.
(A) Proportion of windows significantly depleted of Neandertal introgression in Europeans and East Asians (dashed line) versus what is expected in neutral demographic models (95% confidence interval in gray). (B) Distribution of Neandertal and Denisovan sequences across chromosome 7 in Melanesians (MEL), East Asians (EAS), South Asians (SAS), and Europeans (EUR), and then summed across all populations (ALL). Masked regions are shown as gray vertical lines. An 11.1-Mb region significantly depleted of Denisovan and Neandertal ancestry in all populations is shown in light pink. (C) The frequency of archaic haplotypes in Melanesians versus Europeans. The red line indicates the 99th percentile defined by neutral coalescent simulations. Notable genes are labeled. (D) Visual representation of a high-frequency haplotype encompassing GBP4 and GBP7. Rows indicate individual haplotypes, and columns denote variants that tag the introgressed haplotype (14). Alleles are colored according to whether they are ancestral (white), derived variants that match both archaic genomes (blue), derived variants that match one archaic genome (dark gray), or derived but do not match either archaic genome (light gray). Archaic sequences are represented above, with black denoting derived variants. Missense, untranslated region (UTR), and putative regulatory variants (14) are highlighted with red boxes.
We find significantly more overlap in regions depleted of Neandertal and Denisovan lineages than expected by chance (permutation P = 0.0008) (fig. S20 and table S9) (14), consistent with recurrent selection against deleterious archaic sequences. Indeed, deserts of archaic sequences tend to exhibit higher levels of background selection (figs. S21 and S22). Regions depleted of archaic lineages are significantly enriched for genes expressed in specific brain regions, particularly in the developing cortex and adult striatum (permutation P < 0.05) (table S10). A large region depleted of archaic sequences spans 11 Mb on chromosome 7 and contains the FOXP2 gene (Fig. 4B), which has been associated with speech and language (23). This region is also significantly enriched for genes associated with autism spectrum disorders (Fisher’s exact test, P = 0.008) (14). Although our data show that large regions depleted of archaic ancestry are inconsistent with neutral evolution, mechanisms other than selection, such as structural variation, could also contribute to the appearance of archaic deserts, and thus additional work is necessary to fully understand the origins of such regions.
We identified putative adaptively introgressed sequences in Melanesians by identifying archaic haplotypes at unusually high frequencies, as determined by coaleseent simulations under a wide variety of neutral demographic models (14). At a frequency threshold of 0.56, corresponding to the 99th percentile of simulated data, we identified 21 independent candidate regions for adaptive introgression (Fig. 4C and table S12). Fourteen are of Neanderthal origin, three are Denisovan, three are ambiguous, and one segregates both Neanderthal and Denisovan haplotypes. Six regions do not contain any protein-coding genes, and seven high-frequency archaic haplotypes span only a single gene (table S12). High-frequency archaic haplotypes overlap several metabolism-related genes, such as GCG (a hormone that increases blood glucose levels) and PLPP1 (a membrane protein involved in lipid metabolism). Moreover, five regions either span or are adjacent to immune-related genes, including a haplotype encompassing GBP4 and GBP7 (Fig. 4D), which are induced by interferon as part of the innate immune response.
Substantial amounts of Neandertal and Denisovan DNA can now be robustly identified in the genomes of present-day Melanesians, allowing new insights into human evolutionary history. As genome-scale data from worldwide populations continue to accumulate, a nearly complete catalog of surviving archaic lineages may soon be within reach. Key challenges remain, including evaluating the functional and phenotypic consequences of introgressed sequences and refining estimates on the timing, location, and other characteristics of admixture events. Ultimately, maps of surviving Neandertal, Denisovan, and potentially other hominin (1) sequences will help us to interpret patterns of human genomic variation and understand how archaic admixture influenced the trajectory of human evolution.
Supplementary Material
ACKNOWLEDGMENTS
We thank members of the Akey and Pääbo laboratories for helpful feedback related to this work, F. Friedlaender for help in data management, J. Lorenz and J. Madeoy for DNA extractions and purifications, L. Jáuregui for help in figure preparation, and the participants in this study. Whole-genome sequence data have been deposited into the Database of Genotypes and Phenotypes (dbGAP) with the accession number phs001085.v1.p1. This work was supported by an NIH grant (5R01GM110068) to J.M.A., an NSF fellowship (DBI-1402120) to J.G.S., and grants from the Deutsche Forschungsgemeinschaft (SFB1052, project A02) to J.K. and from the Presidential Fund of the Max Planck Society to S.P. Sample collection was supported in part by NSF grants 9601020 and 0413449 to D.A.M. J.M.A. is a paid consultant of Glenview Capital.
Footnotes
SUPPLEMENTARY MATERIALS
REFERENCES AND NOTES
- 1.Vattathil S, Akey JM, Cell 163, 281–284 (2015). [DOI] [PubMed] [Google Scholar]
- 2.Green RE et al. , Science 328, 710–722 (2010). [DOI] [PMC free article] [PubMed] [Google Scholar]
- 3.Prüfer K et al. , Nature 505, 43–49 (2014). [DOI] [PMC free article] [PubMed] [Google Scholar]
- 4.Reich D et al. , Nature 468, 1053–1060 (2010). [DOI] [PMC free article] [PubMed] [Google Scholar]
- 5.Meyer M et al. , Science 338, 222–226 (2012). [DOI] [PMC free article] [PubMed] [Google Scholar]
- 6.Yang MA, Malaspinas AS, Durand EY, Slatkin M, Mol. Biol. Evol 29, 2987–2995 (2012). [DOI] [PMC free article] [PubMed] [Google Scholar]
- 7.Sankararaman S, Patterson N, Li H, Pääbo S, Reich D, PLOS Genet. 8, e1002947 (2012). [DOI] [PMC free article] [PubMed] [Google Scholar]
- 8.Wall JD et al. , Genetics 194,199–209 (2013). [DOI] [PMC free article] [PubMed] [Google Scholar]
- 9.Skoglund P, Jakobsson M, Proc. Natl. Acad Sci. U.S.A. 108, 18301–18306 (2011). [DOI] [PMC free article] [PubMed] [Google Scholar]
- 10.Qin P, Stoneking M, Mol. Biol. Evol 32, 2665–2674 (2015). [DOI] [PubMed] [Google Scholar]
- 11.Vernot B, Akey JM, Science 343, 1017–1021 (2014). [DOI] [PubMed] [Google Scholar]
- 12.Sankararaman S et al. , Nature 507, 354–357 (2014). [DOI] [PMC free article] [PubMed] [Google Scholar]
- 13.Friedlaender JS et al. , PLOS Genet. 4, e19 (2008). [DOI] [PMC free article] [PubMed] [Google Scholar]
- 14.Supplementary materials are available on Science Online.
- 15.Patterson N et al. , Genetics 192, 1065–1093 (2012). [DOI] [PMC free article] [PubMed] [Google Scholar]
- 16.Lazaridis I et al. , Nature 513, 409–413 (2014). [DOI] [PMC free article] [PubMed] [Google Scholar]
- 17.Reich D, Thangaraj K, Patterson N, Price AL, Singh L, Nature 461,489–494 (2009). [DOI] [PMC free article] [PubMed] [Google Scholar]
- 18.Plagnol V, Wall JD, PLOS Genet. 2, e105 (2006). [DOI] [PMC free article] [PubMed] [Google Scholar]
- 19.Auton A et al. , Nature 526, 68–74 (2015). [DOI] [PMC free article] [PubMed] [Google Scholar]
- 20.Sikora M et al. , PLOS Genet. 10, e1004353 (2014). [DOI] [PMC free article] [PubMed] [Google Scholar]
- 21.Vernot B, Akey JM, Am. J. Hum. Genet 96, 448–453 (2015). [DOI] [PMC free article] [PubMed] [Google Scholar]
- 22.Kim BY, Lohmueller KE, Am. J. Hum. Genet 96, 454–461 (2015). [DOI] [PMC free article] [PubMed] [Google Scholar]
- 23.Maricic T et al. , Mol. Biol. Evol 30, 844–852 (2013). [DOI] [PubMed] [Google Scholar]
Associated Data
This section collects any data citations, data availability statements, or supplementary materials included in this article.


