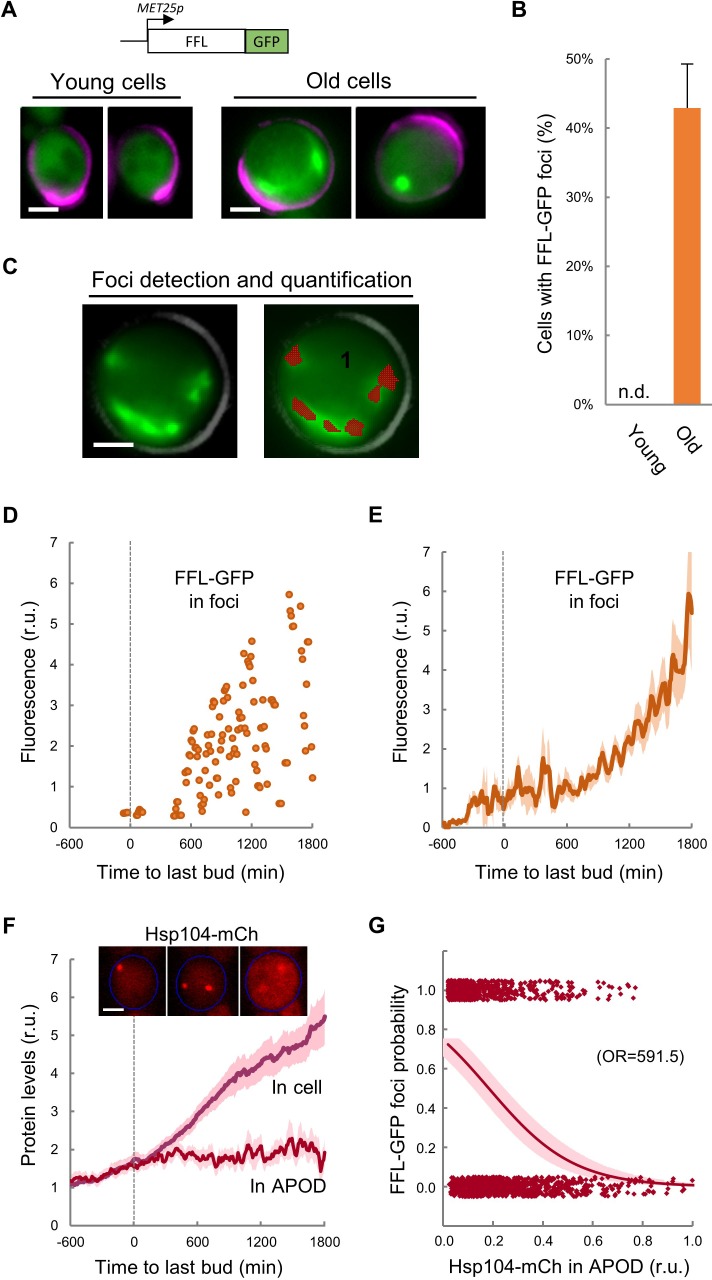
Figure 3. Firefly luciferase aggregates become visible during the last cycle before cell death.
(A) Representative images of FFL-GFP expressed from a regulatable promoter in young and old (MEP-aged) cells. (B) Percentage (±CL, n = 230) of young and old (MEP-aged) cells with FFL-GFP foci. (C) Representative image of an old (MEP-aged) cell expressing FFL-GFP (left) with the foci overlay (red) obtained from BudJ. (D–E) FFL-GFP levels in foci (n = 50) aligned at the last budding event. Individual (D) and mean ±CL (E) data are plotted. (F) Cellular and APOD Hsp104-mCh levels (mean ±CL, n = 50) in aging cells aligned at the last budding event. A representative aging cell (inset) at 0, 600 and 1200 min after the last budding event is shown. (G) Probability of FFL-GFP foci within the following 180 min (twice the generation time of young mother cells) after reading the relative Hsp104-mCh levels in the APOD. Sampled single-cell data (closed circles) and the logistic regression line (mean ±CL) are plotted, and the obtained odds ratio is indicated. Bar = 2 µm. Results shown in this figure are representative of two replicate experiments.


