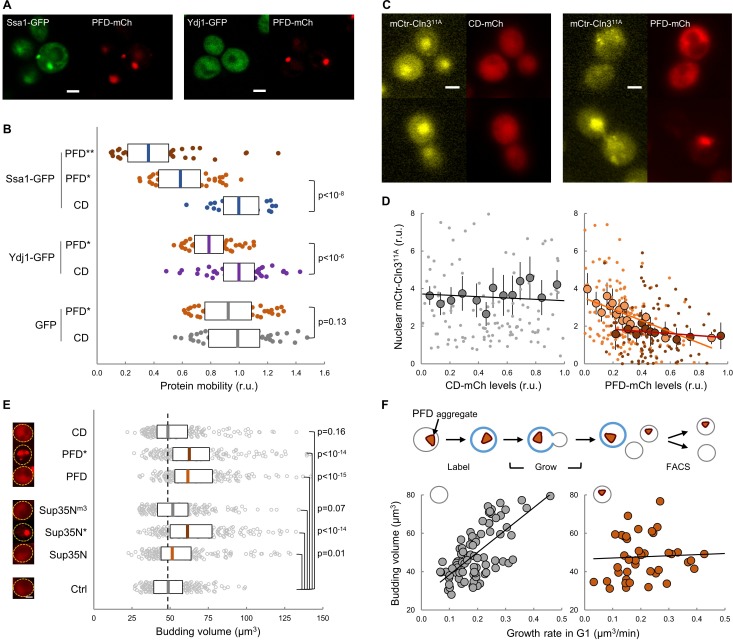
Figure 6. Protein aggregation hinders chaperone mobility and nuclear accumulation of Cln3 in young cells.
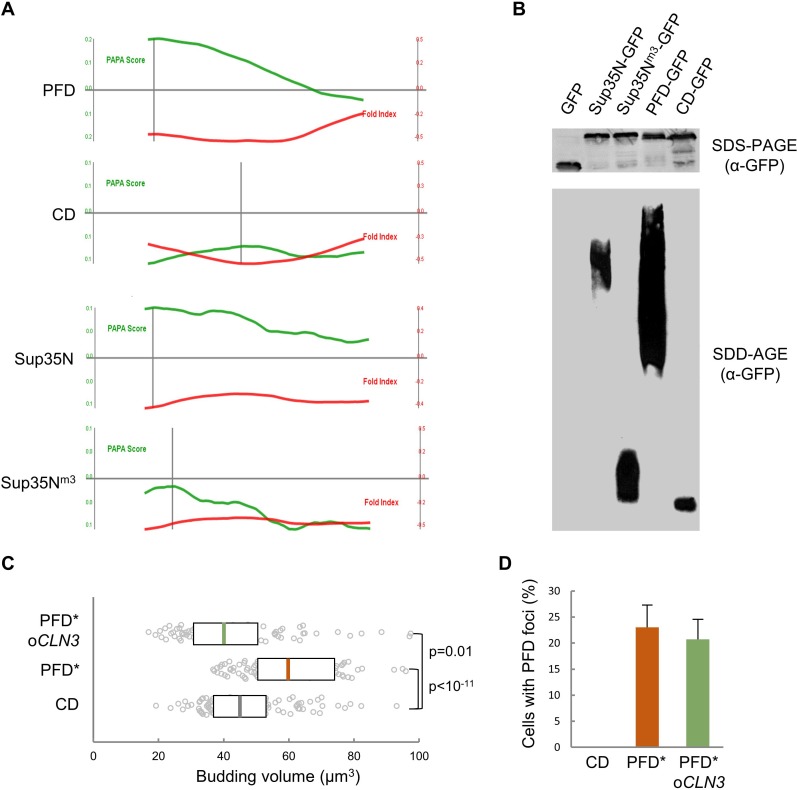
(A) Representative young cells expressing the prion-forming domain (PFD)-mCh and either Ssa1-GFP or Ydj1-GFP. (B) Mobility of Ssa1-GFP, Ydj1-GFP and GFP in young cells expressing control CD or displaying PFD aggregates (*). Ssa1-GFP mobility was also analyzed within PFD aggregates (**). Median ±Q (n = 50) values are also plotted. (C) Representative images of young cells expressing mCtr-Cln311A and either CD or PFD. (D) Nuclear levels of mCtr-Cln311A in young cells as a function of CD (left) or PFD (right) expression levels. Single-cell (small circles), binned (mean ±CL, n = 10) data and the corresponding linear regression lines are plotted. Cells with PFD aggregates are indicated (red circles). (E) Budding volume of young cells expressing the indicated protein domains. Cells with PFD or Sup35N aggregates are indicated (*). Median ±Q (n = 200) values are also plotted. (F) Budding volume of newborn daughter cells in the absence (left, n = 82) or presence (right, n = 42) of PFD aggregates after FACS selection as a function of growth rate in G1. Shown p-values were obtained using a Mann-Whitney U test. Bar = 2 µm. Results shown in this figure are representative of at least two replicate experiments.


