

Abstract
Objectives:
To assess the use and levels of moderate-to-vigorous physical activity occurring in innovative playgrounds in London vs. traditional playgrounds in the United States in neighborhoods with a similar population density.
Study Design:
Cross-sectional observational study
Methods:
We selected a sample of London playgrounds based on their innovative design. One group of 8 playgrounds were matched to US playgrounds by size and population density; a second group of very large London playgrounds were matched only by population density. Playground use and person hours of moderate to vigorous physical activity were measured using direct observation at similar times of the day and days of the week in all locations.
Results:
The number of playground visit-hours was 58% higher in London than in the US. (394 vs 249). The matched London playgrounds had 37.8% more children and 129% more adults, who were respectively engaging in 90% and 116% more moderate-to-vigorous physical activity. While the London playgrounds were nearly 8.5 times larger than the US ones, they attracted a total of 5.8 times more visitors (1,399 vs 243, p <.0001), but this included 10 times as many adults (679 vs. 66, p <.0001) and 7.5 times more seniors (23 vs. 3). The London playgrounds included more amenities targeting adults.
Conclusions:
The design of innovative playground was associated with the amount of MVPA in similar sized playgrounds, but the size of the playground was more strongly associated with the number of visitors. It is as important to design playgrounds for adults as it is for children to increase visit-hours.
Keywords: playgrounds, physical activity, design, community health
Introduction
Worldwide, physical inactivity is endemic, affecting every age group, and is the underlying cause of 10.8% of premature mortality1 and $53.8 billion worldwide in health care costs.2,3 Children are spending less time in active play than they spend with electronic media,4 even though most urban neighborhoods in developed countries have parks and gardens for use by local residents.5
Contributing to low physical activity rates among youth are concerns about safety. In the United States the design of playgrounds has been constrained by the fear of litigation, so most playground structures comprise the post and platform design, which is defined as a composite structure of (a) series of posts with interstitial platforms; (b) connected via stairs and ramps; (c) containing static elements for climbing, sliding, hanging, and manipulating; (d) in prescribed play sequences (i.e. climb up, slide down); and (e) on a single surface type. Observational data suggest that most of these playgrounds are poorly used, especially when they are located in low-income neighborhoods.6
In response to the concern that traditional post and platform playgrounds are boring and unappealing to children, innovative playgrounds have been created to encourage youth to spend more time outdoors, roam free, and have unique experiences where they can test their physical skills and develop resilience. Innovative playgrounds include at least three of the following features: (a) a variety of surfacing types; (b) naturalized and planted areas installed specifically for play; (c) open-ended structures that do not dictate play sequences; (d) loose, movable equipment; (e) not comprised solely of the traditional post and platform structures; and (f) designed for multiple age groups, including adults and seniors.
Moving on playgrounds is an excellent way for children to develop cardiovascular fitness and to strengthen both bones and muscles. Playgrounds with components that facilitate caregiver participation could extend these the benefits of physical activity to adults as well. Playgrounds with multiple different elements and surfaces provide movement opportunities that help develop children’s sensory inputs, like vestibular and proprioceptive sense. These senses and motor skills are crucial for children to understand where their bodies are in space, how their bodies move, and how the environment influences them and vice versa.7
In the United States, playgrounds are located in 89% of all neighborhood parks8 and the most common reason for visiting parks, cited by 52% of park users, is to bring children.9 Understanding which playground features support physical activity is an important question that could influence the health and well-being of millions.10–12 While there is a perception that playgrounds serve only children, many innovative play spaces have features that encourage caregivers to actively participate, influencing their physical activity levels as well.12–14 Innovative playgrounds are rare in the United States. 9
To date, there has been virtually no research done on the impacts of these spaces on health and health behaviors. Exciting and novel parks could be one means to draw people outdoors and to facilitate meeting physical activity guidelines. Illuminating the impact of innovative play structures and surfaces on youth and adult physical activity may inform the design of future playgrounds and potentially support more moderate-to-vigorous physical activity (MVPA) for users of all ages.
Fewer than half of all American children and adults meet the national physical activity guidelines.15 Given that time spent outdoors in parks and playgrounds is limited, it is critical that leisure time environments are designed to maximize physical activity, helping children and their caregivers reach the national physical activity recommendations of at least 60 minutes per day for children and 150 minutes per week for adults.16
This study examined the use of innovative playgrounds in London, the sizes of which range from a fraction of an acre to more than 3 acres. We also compared these innovative London playgrounds to similarly sized, but traditional playgrounds in the United States with post and platform structures, and contrasted very large London playgrounds, 1 acre or more, to smaller US playgrounds, less than 0.5 acres, in neighborhoods with high population density. Our goal was to quantify the use of the two types of playgrounds and physical activity levels among all age groups.
Methods
We selected sixteen innovative playgrounds in London based on the following criteria: design uniqueness; variety in surfaces and structures; different sizes (small vs. large); demographics (ethnicity and socioeconomic); and geographically distributed across London to capture a variety of different neighborhoods and population types. All comparison playgrounds selected from the US were from the National Study of Neighborhood Parks (NSNP) focusing on New York, San Francisco, and Los Angeles, cities with a population density similar to London. The US playgrounds were randomly selected in each city for neighborhood socio-economic and geographic diversity. We matched eight of these US playgrounds to London playgrounds based on size and population density. (See Table 1) The remaining eight other London playgrounds were so large, that there were no comparable playgrounds in the NSNP sample. We contrasted these eight playgrounds of about 1 acre or more to 11 small US playgrounds, all about.05 acre or less in neighborhoods with similarly high population densities.
Table 1:
Characteristics of Study Parks
| SITE | Park Name | ACREAGE | POP. (1-MILE RADIUS) |
|---|---|---|---|
| LA | South Park | 0.34 | 69,697 |
| UK | Knightsbridge Barracks Playground | 0.47 | 56,862 |
| NY | Brower | 0.46 | 171,637 |
| UK | King Square Gardens | 0.63 | 139,585 |
| NY | Com. John Barry | 0.59 | 96,025 |
| UK | Kilburn Grange Park | 0.32 | 98,815 |
| NY | Marconi | 0.19 | 78,224 |
| UK | Clapton Common | 0.22 | 92,833 |
| NY | Williamsbridge Oval | 0.4 | 114,667 |
| UK | Spa Fields Playground | 0.42 | 132,369 |
| SF | Hilltop Park | 0.25 | 71,796 |
| UK | Jubilee Gardens | 0.24 | 68,429 |
| SF | Potrero Hill Recreation Center | 0.38 | 52,153 |
| UK | Wellington Barracks Playground | 0.25 | 56,220 |
| SF | St. Mary’s Rec Center | 0.30 | 63,111 |
| UK | Olympic Park Playground | 0.54 | 53,047 |
| NSNP Parks, average | 0.36 | 89,664 | |
| London Parks, average | 0.39 | 87,270 | |
| Extra-large playgrounds, London | |||
| London | Tumbling Bay Playground | 2.10 | 55,116 |
| London | Brockwell Park Playground | 1.22 | 79,037 |
| London | Marylebone Green Playground | 1.02 | 80,692 |
| London | Pools Playground | 3.50 | 81,766 |
| London | Victoria and Alexandra Playground | 2.10 | 99,920 |
| London | Princess Diana Memorial Playground | 1.98 | 100,188 |
| London | Clissold Park Playground | 1.42 | 109,990 |
| London | Burgess Park Playground | 0.92 | 113,815 |
| Average | 1.78 | 90,066 | |
| Small U.S. Playgrounds | |||
| Los Angeles | Lafayette Park | 0.14 | 69,058 |
| Los Angeles | Normandie Recreation Center | 0.15 | 74,645 |
| New York | Bill Brown Memorial Playground | 0.44 | 102,972 |
| New York | Carl Schurz Park | 0.52 | 208,331 |
| New York | Chelsea Park | 0.15 | 108,617 |
| New York | Flushing Fields | 0.08 | 76,741 |
| New York | Julio Carballo Field | 0.06 | 92,799 |
| New York | Mullaly Park | 0.47 | 209,966 |
| New York | Seton Park | 0.06 | 53,818 |
| San Francisco | Joe DiMaggio Playground | 0.14 | 71,796 |
| San Francisco | States Street Playground | 0.06 | 78,037 |
| Average | 0.21 | 104,253 | |
Geographic Information Systems (GIS) was used in conjunction with US and UK census data to define population densities in the playground service area (defined as the one-mile circle from the center of each playground). Population density around the US parks was determined by measuring the census tracts within a one-mile radius of the parks. In London population density was determined by first converting hectares to square kilometers to square miles, for comparison from metric (UK) to imperial (US). Then the percentage of each ward that fell within the playground service area was determined, assuming equal distribution of the population in the area. Playground size was determined through a Google Maps area calculator tool (https://www.daftlogic.com/projects-google-maps-area-calculator-tool.htm). Playground boundaries were defined by either a fence or surfacing demarcating the edge condition. For some of the London playgrounds, where the boundary was not entirely clear, assumptions were made based on pavement edges or apparent edge of play zone.
In order to quantify the use and the level of physical activity in the playgrounds we used the System for Observing Play and Recreation in Communities (SOPARC) to document apparent age, gender, race/ethnicity, and physical activity in both the US and London playgrounds. The US playgrounds all had the same schedule of data collected, in the spring and summer of 2014. Data collection in London occurred from the end of April-early June 2015. Every playground was observed at least three times per day on two weekdays and two weekends, for a total of 12 observation periods. In the US, observations were documented in the field, while in London, observations were done through videography, completed in 5–10 second sweeps of specific areas of the playgrounds. Prior reliability testing confirms that photography yields equivalent results to direct observation.17
In the US playgrounds, all the observations were aggregated, so it was not possible to break down playground use by specific play equipment. However, in London, observations were divided by ground surface and structure. Users observed at the moment of observation on surfaces like sand, mulch, rubber surfacing, concrete, planting, and grass were counted separately from users on play structures. Where play structures were large and had restricted site lines, they were subdivided into use categories (e.g. structure with slide versus structure with climber). All objects within the playground were assessed, including all site furnishings and site features (boulders, trees, etc), in addition to structures installed strictly for play. The study was approved by the institutional Human Subjects Protection Committee.
Data analysis:
We compared the playground use outcomes between the matched pairs of London and U.S. playgrounds by repeated-measure generalized linear models and two-sample t-tests. For each outcome (e.g., total # female playground users in MVPA) we first fitted a repeated-measure generalized linear model, in which the observed number of playground users followed a Poisson distribution, and was correlated within each playground. We controlled for the acreage and population density for each playground to account for the remaining imbalance in the matched pair. The time of observation (hour of a day and day of a week) was also controlled. Generalized estimating equation (GEE) modeling was applied to account for the intra-class correlation among observations within the same playground. In these models, the main study factor was the nation in which a playground was located so we could contrast innovative playgrounds in London with the traditional playgrounds in the US. For rare outcomes (e.g., number of senior playground users in MVPA), GEE cannot be applied due to the excessive zeros. Instead, we used the simplified two-sample t-tests between the two nations for testing statistical significance. These two types of analyses have been noted differently. We reported the observed number of playground users in the large London playgrounds alongside those observed in the U.S. playgrounds to visualize the raw difference in outcomes. Despite the sizable difference in the observed outcome, these two sets of playgrounds cannot be rigorously compared, because they were very different in important characteristics and adjusting for covariates is very difficult. We thus did not run formal statistical tests for this comparison.
RESULTS
Among the eight pairs of matched US and UK playgrounds, NSNP playground acreage ranged from.19 to.46 acres, with an average of .36 acres and London playground acreage ranged from.22 to.63 acres, with an average of.39 acres. NSNP playground population densities were an average of 89,700 persons per square mile vs 87,200 persons per square mile in London. (Table 1).
There were significant differences across the two settings in the number and percentage of playground users by age, gender, and activity levels. The number of playground visit hours was 58% higher in London (394 vs 249). The matched London playgrounds had 37.8% more children and 129% more adults, who were respectively engaging in 90% and 116% more moderate-to-vigorous physical activity than children and adults in similar sized American playgrounds. Differences in the percentage of children engaging in MVPA between London and the US were particularly striking for children (71.7% vs 52.2%) and teens (72.1% vs 49.6%). There were more females than males in both US and London playgrounds. However, the percentage of female children engaging in MVPA in the London playgrounds was slightly higher than males in London playgrounds (74.1% vs 70.7%) but lower among female teenagers (62.1% vs 77.5%). Overall, in both locations, females were less likely than males to be engaged in MVPA (Table 2).
Table 2:
Average numbers and percentages of users by age and activity levels in 16 US and UK parks matched by size and neighborhood population density, London vs US Number of users includes total counted during the 12 observation periods.
| US | UK | p-value | |
|---|---|---|---|
| Average Total Play Area Visitors | 248.6 | 393.5 | 0.03a |
| Average # (%) Children | 136.4 (55.8%) | 197.9 (51.7%) | 0.05a |
| Average # (%) Teens | 31.5 (12.3%) | 12.5 (3.9%) | 0.29b |
| Average # (%) Adults | 77.0 (30.6%) | 176.3 (42.7%) | 0.0008 a |
| Average # (%) Seniors | 3.8 (1.3%) | 6.9 (1.7%) | 0.31 b |
| Average # (%) in MVPA | 116.4 (43.1%) | 202.5 (52.8%) | 0.02 a |
| Average # (%) in Sedentary | 132.3 (56.9%) | 191.0 (47.3%) | 0.10 a |
| Average # (%) Children MVPA | 77.8 (28.9%) | 147.8 (37.8%) | 0.01 a |
| Average # (%) Children Sedentary | 58.6 (26.9%) | 50.1 (13.9%) | 0.77 a |
| Average # (%) Teens MVPA | 17.4 (6.2%) | 8.9 (2.9%) | 0.44 b |
| Average # (%) Teens Sedentary | 14.1 (6.1%) | 3.6 (1.0%) | 0.15 b |
| Average # (%) Adults MVPA | 20.5 (7.9%) | 44.3 (11.7%) | 0.004 a |
| Average # (%) Adults Sedentary | 56.5 (22.7%) | 132.0 (31.0%) | 0.001 a |
| Average # (%) Seniors MVPA | 0.8 (0.1%) | 1.6 (0.4%) | 0.44 b |
| Average # (%) Seniors Sedentary | 3.0 (1.2%) | 5.3 (1.3%) | 0.32 b |
| Females | 152.8 (58.7%) | 214.3 (53.8%) | 0.14 a |
| Average # (%) in MVPA | 64.3 (39.0%) | 98.5 (47.7%) | 0.08 a |
| Average # (%) Sedentary | 88.5 (61.0%) | 115.8(52.3%) | 0.28 a |
| Average # (%) Children MVPA | 40.6 (24.9%) | 68.8 (32.7%) | 0.27 b |
| Average #( %) Children Sedentary | 35.0 (25.1%) | 21.7 (11.0%) | 0.31 b |
| Average # (%) Teens MVPA | 10.3 (6.4%) | 3.6 (2.4%) | 0.31 b |
| Average #(%) Teens Sedentary | 9.9 (7.5%) | 1.9 (1.0%) | 0.11 b |
| Average # (%) Adults MVPA | 12.6 (7.6%) | 25.5 (12.2%) | 0.02 a |
| Average # (%) Adults Sedentary | 41.9 (27.3%) | 89.0 (39.1%) | 0.005 a |
| Average # (%) Seniors MVPA | 0.8 (0.2%) | 0.6 (0.3%) | 0.88 b |
| Average # (%) Seniors Sedentary | 1.8 (1.1%) | 3.1 (1.3%) | 0.37 b |
| Males | 95.9 (41.3%) | 179.3 (46.2%) | 0.001 a |
| Average # (%) in MVPA | 52.1 (49.3%) | 104.0 (58.8%) | 0.002 a |
| Average # (%) in Sedentary | 43.8 (50.7%) | 75.3 (41.2%) | 0.009 a |
| Average # (%) Children MVPA | 37.1 (34.9%) | 79.0 (43.4%) | 0.001 a |
| Average # (%) Children Sedentary | 23.6 (50.6%) | 28.4 (16.8%) | 0.292 a |
| Average # (%) Teens MVPA | 7.1 (6.1%) | 5.3 (3.3%) | 0.69 b |
| Average # (%) Teens Sedentary | 4.2 (4.2%) | 1.8 (1.1%) | 0.33 b |
| Average # (%) Adults MVPA | 7.9 (8.3%) | 18.8(11.7%) | 0.003 a |
| Average # (%) Adults Sedentary | 14.6 (16.0%) | 43.0 (22.0%) | 0.0002 a |
| Average # (%) Seniors MVPA | 0.0 (0.0%) | 1.0 (0.5%) | 0.07b |
| Average # (%) Seniors Sedentary | 1.3 (1.4%) | 2.1 (1.3%) | 0.38 b |
P-values based on repeated-measure generalize linear models adjusting for acreage, population, time of observation, and intra-class correlations.
P-values based on two-sample t-tests.
The contrast between the eight very large London playgrounds and the eleven small US playgrounds in neighborhoods with high population density was quite dramatic. While the London playgrounds were nearly 8.5 times larger than the US ones, they attracted a total of 5.8 times more visitors (1,399 vs 243, p <.0001), but this included 10 times as many adults (679 vs. 66, p <.0001) and 7.5 times more seniors (23 vs. 3). (Figure 1). While children comprised 64.7% of the visitors in the small US playgrounds, they only comprised 47.1% of the visitors in London’s largest playgrounds. The percentage of visitors who were adults in the London playgrounds was more than double the number observed in the US playgrounds (48.2% vs 23.3%, p <.0001). Children, teens, and adults were significantly more likely to be engaging in MVPA in the large London playgrounds than those in the smaller US playgrounds.
Figure 1.
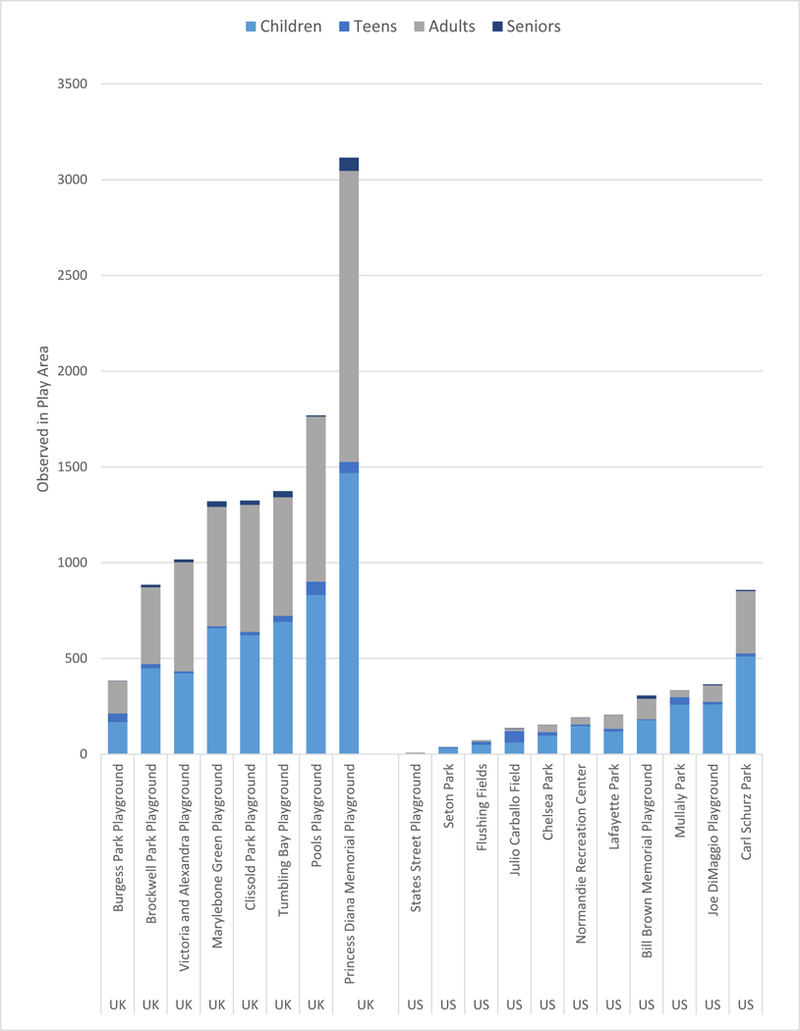
UK Large Parks and US Small Parks : Users counted during 12 observation periods
The diversity of activities that the London playgrounds afforded was much greater than the US playgrounds. In London, almost all of the playgrounds promoted balancing, climbing, crawling, hanging, jumping, manipulating, pumping, rocking, seesawing, sliding, spinning, stepping, swinging, and walking. In contrast, few of the US playgrounds included balancing, crawling, rocking, seesawing, or spinning. In the London playgrounds, climbing and swinging were the most popular activities, at 45% and 26% of the 1026 persons using the playground structures, respectively (See Figure 2).
Figure 2.
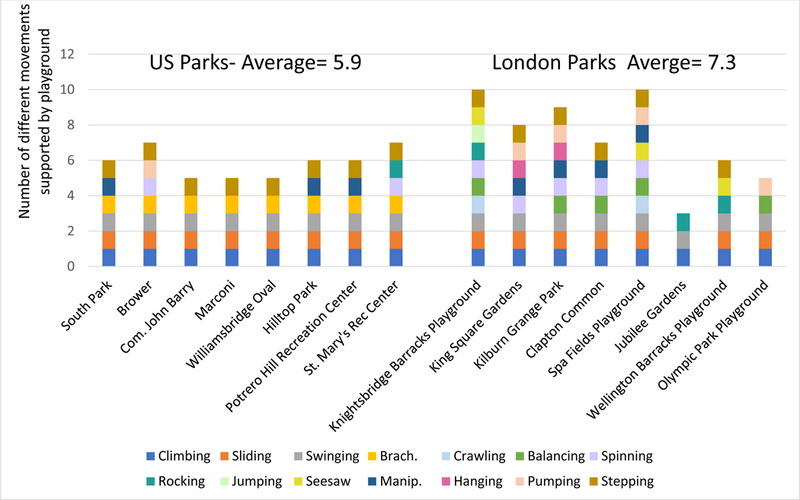
Variety of movements supported by parks in US and London
The playgrounds in the UK also included more amenities that targeted adults. Of the 16 playgrounds studied, 11 had cafes either adjacent to the playground or within a 2-minute walk. None of the US playgrounds did. However, the number with bathrooms was similar: among the 16 London playgrounds, 13 have bathrooms (81%) and in the 19 US playgrounds, 16 had bathrooms (84%). The London playgrounds included more benches, tables, and opportunities to sit (i.e. boulders and logs) for adults that were directly adjacent to the play areas. Several of the London playgrounds also contained play features scaled for adult use and included elements that appeared “adventurous or risky.” These included a giant pirate ship (Princess Diana Memorial Playground), a three-story concrete mountain with tall steel slides (Pools Playground), large timber treehouses (Tumbling Bay), a massive grass berm for picnicking and sliding (Clissold Playground), and concrete tower, slide, and climbing wall (Marylebone Green Playground).
DISCUSSION
This is the first study to quantity use of and levels of physical activity that occur in innovative London playgrounds. While there are likely socio-cultural differences that may partly explain the higher rate of the use of the innovative playgrounds, it is likely that playground design is an important contributing factor. Playgrounds, traditionally thought of as serving only children, are actually a rich community resource that can serve multiple age ranges, if they are designed to support the wants and needs of all ages. The innovative London playgrounds blur the boundary between play space and park. Most have considerable grass areas and passive spaces for adults to relax and spend time. Passive spaces also support children’s play. ‘Play loops’ were observed where children would engage in active play for an intense period of time, before circling back to the passive spaces. Both function best in conjunction, as those in the passive spaces enjoy the spectacle of the active spaces, while the passive spaces act as a pressure valve for the active ones.
The London Playgrounds did not treat play areas as islands surrounded by fence within a larger park setting, but rather were a park in and of themselves. Spaces for adults were purposely included in the playground footprint, which accounted for the larger acreage of many London playgrounds. This provided opportunities for caregivers and other adults to have picnics, birthday parties, reunions, or other large gatherings within the play space, while still able to attend to children in their social group. In contrast, the US playgrounds often installed fences at the edges of the protective play surfacing and provided limited places for adults and caregivers to sit or gather. Playgrounds in London also had many features that afforded different types of activity and took advantage of natural elements like boulders, logs, and plantings. Few of the US playgrounds had plantings within the playground areas.
While the design of innovative playground alone was associated with the amount of MVPA in similar sized playground, the size of the playground had a much larger association with the number of visitors. Having a playground that is over 1 acre in size may make the playground considerably more attractive and allows for the placement of multiple structures that provide novel experiences for children and adults. US neighborhood playgrounds tend to devote considerably more space to sports fields than to playgrounds. For example, a soccer or football field is 1.32 acres, while a baseball field is typically 3 acres. Considering that relatively few people can play at one time (about 18 for a baseball game and 22 for football and soccer) and that fields typically serve primarily athletes, playgrounds of a similar size are considerably more efficient. In an average of 1.78 acres, the larger playgrounds hosted an average of 117 people every hour (range 14–260). Given the higher use, it makes sense to consider expanding playgrounds to support more physical activity across many different age groups to encourage more outdoor physical activity.
Another potential explanation for the differences in playground use between the US and London playgrounds is the fear of crime. The analysis did not consider neighborhood socio-economic status. The playgrounds surveyed in London tended to be more destination parks, while those in the US were in neighborhood parks. Some of the US playgrounds were in relatively high crime areas. Concerns about safety are a prime reason for avoiding public parks.18
The study has some limitations. The use of videography for counting users in London may have resulted in more people being counted than in the US study, as having a longer time to view an area might allow an observer to notice more individuals in the area. However, in the past we used photography to validate the field counts and found there to be no significant differences between field observations and photography. In addition, the comparison sample of playgrounds was randomly chosen, while the innovative playground sample was curated to represent the most cutting-edge designs. The playgrounds have been open for at least 2–3 years at the time of observation, with the most popular London playground having been open for 15 years, so the higher attendance cannot be explained by novelty alone. The two sets of playgrounds have very different characteristics and cannot be rigorously compared, so this sample is intended to provide a benchmark for levels of attendance and physical activity that can be generated by thoughtful playground design. Another limitation is that the playgrounds are serving people in two different countries. However, in the cities selected, the populations are very diverse and include immigrants from across the world.
Given the higher attendance at these innovative playgrounds in London, we conclude that it is as important to design playgrounds for adults as it is for children. If adults and caregivers are supported and happy, they will be more likely to visit and stay at a playground, allowing children in their care the opportunity to play, socialize, and engage in more physical activity than they otherwise would if kept indoors.
Highlights.
Compared to US neighborhood playgrounds, innovative London playgrounds:
-
○
attract more visitors
-
○
support more moderate-to-vigorous physical activity (MVPA)
-
○
attract a greater percentage of adults and seniors
-
○
offer a wider variety of play features
Acknowledgements:
The research was supported in part by NHLBI # R01HL114432.
Footnotes
Declaration of Interest:The authors have no conflicts of interest to disclose.
Contributor Information
Meghan Talarowski, Studio Ludo, Philadelphia, PA.
Deborah Cohen, RAND Corporation, Santa Monica, CA.
Stephanie Williamson, RAND Corporation, Santa Monica, CA.
Bing Han, RAND Corporation, Santa Monica, CA.
References
- 1.Lee IM, Shiroma EJ, Lobelo F, Puska P, Blair SN, Katzmarzyk PT. Effect of physical inactivity on major non-communicable diseases worldwide: an analysis of burden of disease and life expectancy. Lancet. 2012;380(9838):219–229. [DOI] [PMC free article] [PubMed] [Google Scholar]
- 2.Ding D, Kolbe-Alexander T, Nguyen B, Katzmarzyk PT, Pratt M, Lawson KD. The economic burden of physical inactivity: a systematic review and critical appraisal. British journal of sports medicine. 2017;51(19):1392–1409. [DOI] [PubMed] [Google Scholar]
- 3.Ding D, Lawson KD, Kolbe-Alexander TL, et al. The economic burden of physical inactivity: a global analysis of major non-communicable diseases. Lancet. 2016;388(10051):1311–1324. [DOI] [PubMed] [Google Scholar]
- 4.Tandon PS, Zhou C, Sallis JF, Cain KL, Frank LD, Saelens BE. Home environment relationships with children’s physical activity, sedentary time, and screen time by socioeconomic status. The international journal of behavioral nutrition and physical activity. 2012;9:88 PMCID: PMC. [DOI] [PMC free article] [PubMed] [Google Scholar]
- 5.WorldCitiesCultureforum. % of public green space (parks and gardens) http://www.worldcitiescultureforum.com/data/of-public-green-space-parks-and-gardens. 2019.
- 6.Cohen DA, Hunter G, Williamson S, Dubowitz T. Are Food Deserts Also Play Deserts? J Urban Health. 2016;93(2):235–243 PMCID: PMC. [DOI] [PMC free article] [PubMed] [Google Scholar]
- 7.Fjørtoft I Landscape as playscape: The effects of natural environments on children’s play and motor development. Children, Youth and Environments. 2004;14(2):21–44. [Google Scholar]
- 8.Cohen DA, Han B, Nagel CJ, et al. The First National Study of Neighborhood Parks: Implications for Physical Activity. Am J Prev Med. 2016;51(4):419–426 PMCID: PMC. [DOI] [PMC free article] [PubMed] [Google Scholar]
- 9.Cohen DA. Playgrounds and Physical Activity: The National Study of Neighborhood Parks. 9th Biennial Childhood Obesity Conference; May, 2017, 2017; San Diego. [Google Scholar]
- 10.Copperman R, Bhat CR. An exploratory analysis of children’s daily time-use and activity patterns using the child development supplement (CDS) to the US panel study of income dynamics (PSID). Transportation Research Record, 2021, 36–44. 2007;2021:36–44. [Google Scholar]
- 11.Larson LR, Green GT, Cordell HK. Children’s time outdoors: Results and implications of the national kids survey. Journal of Park and Recreation Administration. Journal of Park and Recreation Administration. 2011;29(2):1–20. [Google Scholar]
- 12.Escalante Y, Garcia-Hermoso A, Backx K, Saavedra JM. Playground designs to increase physical activity levels during school recess: a systematic review. Health Educ Behav. 2014;41(2):138–144. [DOI] [PubMed] [Google Scholar]
- 13.Ridgers ND, Stratton G, Fairclough SJ, Twisk JW. Long-term effects of a playground markings and physical structures on children’s recess physical activity levels. Prev Med. 2007;44(5):393–397. [DOI] [PubMed] [Google Scholar]
- 14.Broekhuizen K, Scholten AM, de Vries SI. The value of (pre)school playgrounds for children’s physical activity level: a systematic review. The international journal of behavioral nutrition and physical activity. 2014;11:59 PMCID: PMC. [DOI] [PMC free article] [PubMed] [Google Scholar]
- 15.Troiano RP, Berrigan D, Dodd KW, Mâsse LC, Tilert T, McDowell M. Physical activity in the United States measured by accelerometer. Med Sci Sports Exerc. 2008;40(1):181–188. [DOI] [PubMed] [Google Scholar]
- 16.USDHHS. Physical Activity Guidelines for Americans Washington DC: USDHHS;2008. [Google Scholar]
- 17.Han B, Cohen DA, Derose KP, Marsh T, Williamson S, Raaen L. Validation of a New Counter for Direct Observation of Physical Activity in Parks. Journal of physical activity & health. 2016;13(2):140–144 PMCID: . [DOI] [PMC free article] [PubMed] [Google Scholar]
- 18.Lapham S, Cohen D, Han B, et al. How Important is Perception of Safety To Park Use?--A four-city survey. Urban Studies. 2015;53(12):2624–2636. [DOI] [PMC free article] [PubMed] [Google Scholar]