

Abstract
Autosomal dominant hypocalcemia type 1 (ADH1) is a rare form of hypoparathyroidism caused by heterozygous, gain-of-function mutations of the calcium-sensing receptor gene (CAR). Individuals are hypocalcemic with inappropriately low parathyroid hormone (PTH) secretion and relative hypercalciuria. Calcilytics are negative allosteric modulators of the extracellular calcium receptor (CaR) and therefore may have therapeutic benefits in ADH1. Five adults with ADH1 due to 4 distinct CAR mutations received escalating doses of the calcilytic compound NPSP795 (SHP635) on 3 consecutive days. Pharmacokinetics, pharmacodynamics, efficacy, and safety were assessed. Parallel in vitro testing with subject CaR mutations assessed the effects of NPSP795 on cytoplasmic calcium concentrations (Ca2+i), and ERK and p38MAPK phosphorylation. These effects were correlated with clinical responses to administration of NPSP795. NPSP795 increased plasma PTH levels in a concentration-dependent manner up to 129% above baseline (p=0.013) at the highest exposure levels. Fractional excretion of calcium (FECa) trended down but not significantly so. Blood ionized calcium levels remained stable during NPSP795 infusion despite fasting, no calcitriol and little calcium supplementation. NPSP795 was generally safe and well-tolerated. There was significant variability in response clinically across genotypes. In vitro, all mutant CaRs were half-maximally activated (EC50) at lower concentrations of extracellular calcium (Ca2+o) compared to wild type (WT) CaR; NPSP795 exposure increased the EC50 for all CaR activity readouts. However, the in vitro responses to NPSP795 did not correlate with any clinical parameters. NPSP795 increased plasma PTH levels in subjects with ADH1 in a dose-dependent manner, and thus, serves as proof-of-concept that calcilytics could be an effective treatment for ADH1. Albeit all mutations appear to be activating at the CaR, in vitro observations were not predictive of the in vivo phenotype, or the response to calcilytics, suggesting that other parameters impact the response to the drug.
Keywords: PTH, hypoparathyroidism, hypocalcemia, calcium-sensing receptor, calcilytic
TRIAL REGISTRATION.
ClinicalTrials.gov Identifier: NCT02204579
INTRODUCTION
Autosomal dominant hypocalcemia type 1 (ADH1) is a rare genetic disorder of mineral homeostasis (OMIM 601198) caused by gain-of-function mutations of the calcium-sensing receptor gene (CAR) (3q13.3-q21.1).(1,2) The extracellular calcium receptor (CaR) is a G-protein-coupled receptor for which extracellular calcium (Ca2+o) is the primary physiological ligand, and it plays the major role in regulating systemic calcium homeostasis.(3–5) Gain-of-function mutations in the G-protein subunit α11(Gα11) protein (GNA11) (19p13.3) downstream of CaR have also been identified as causative for autosomal dominant hypocalcemia type 2 (ADH2) (OMIM #615361).(6–8)
CaRs are prominently expressed in parathyroid glands and the kidney, specifically in the thick ascending limb of the loop of Henle, distal tubules, and collecting ducts, where they regulate parathyroid hormone (PTH) secretion and calcium reabsorption, respectively.(3,9) Increases in Ca2+o activate the receptor and trigger downstream signaling leading to suppressed PTH secretion and renal calcium reabsorption. Thus, heterozygous mutations in ADH1 decrease CaR half-maximal activation (EC50) to Ca2+o such that PTH secretion is decreased and renal calcium excretion increased. Decreased PTH leads to hypocalcemia and may result in symptoms that include peripheral and oral paresthesias, muscle cramps, tetany and seizures. Increased renal calcium excretion results in development of nephrocalcinosis, nephrolithiasis, and impaired renal function in some patients.(10)
Conventional therapy for ADH1 patients who require treatment includes calcium and vitamin D analogs; however, the rise in blood calcium exacerbates the hypercalciuria, placing patients at increased risk of renal complications. (10) Thus, current practice for those on treatment is to maintain calcium levels near or slightly below the lower limit of normal. However, some patients continue to experience neuromuscular and cognitive symptoms of hypocalcemia and sustain renal complications. Because of the inadequacy of conventional treatment, and its potential for morbidities, precision therapy that could normalize both blood calcium and urinary calcium excretion in ADH1 patients who require treatment would represent a significant improvement.
Calcilytics, CaR negative allosteric modulators, increase PTH secretion and decrease renal calcium excretion. NPSP795 (SHP635), one such calcilytic, and its structurally-related compounds NPSP790 and NPS2143 were shown to increase PTH in rats, dogs, and monkeys (11), and in addition, were shown to increase blood calcium as well as decrease renal calcium excretion in PTH infusion-clamped rats (12), suggesting a potential benefit in ADH1. Moreover, the calcilytic NPS2143 has been shown to reduce signaling responses of cells with gain-of-function CAR mutations causative of ADH1 (13), and increased blood calcium after a single intraperitoneal injection in a mouse model of ADH1 (14), the Nuf mouse. (15) Similarly, NPS2143 reduced mutant Val62 Gα11 signaling responses in vitro and led to an increase in plasma PTH and calcium concentrations in two animal models of ADH2. (16,17) The calcilytic JTT-305 (MK-5442) resulted in increased serum calcium and decreased urinary calcium by stimulating endogenous PTH secretion and prevented renal calcification in knock-in mice with human CAR (C129S) and CAR (A843E) mutations. (18)
We thus hypothesized that the calcilytic NPSP795 may be effective in treating ADH1, and that by assessing the effect of NPSP795 on subject mutations in vitro and comparing the results to clinical findings we could gain insight into genotype/phenotype correlations as well as potentially predict how patients with specific mutations may respond to NPSP795. The present proof-of-concept study was designed to assess the pharmacodynamics (PD), pharmacokinetics (PK), efficacy, as assessed by change in PTH and PTH AUC, and safety of NPSP795 in adult patients with ADH1. In vitro studies assessed the potency of Ca2+o on CaR-induced intracellular Ca2+ (Ca2+i) mobilization, and ERK and p38MAPK phosphorylation in the patient mutations, and the effect of NPSP795 on these parameters and the correlation between these parameters and each patients’ clinical response, as assessed by PTH AUC.
METHODS
Study participants.
Adults with a previously established clinical diagnosis of ADH1, confirmed by CAR gene mutation, BMI ≥ 18.5 to < 39 kg/m2, and 25-hydroxy-vitamin D > 25 ng/mL were enrolled in this study from June 2014 to April 2015. Key exclusion criteria were treatment with PTH 1–84 or 1–34 within the previous 6 months; hypocalcemia requiring more than 6 IV calcium infusions per year; hypocalcemic seizures within the past 3 months; glomerular filtration rate (GFR) < 25 mL/minute/1.73 m2; abnormal hepatic, hematologic, and/or clotting function; 12-lead resting electrocardiogram (ECG) with clinically significant abnormalities; concomitant medications with potential to interfere with NPSP795 metabolism; and history of thyroid or parathyroid surgery.
Study design.
This was an open-label, non-randomized, single-center, intra-subject dose-escalating phase IIb study in adults with ADH1. The study medication, NPSP795, a calcilytic, was provided by NPS Pharmaceuticals, Inc.
After screening and baseline assessments, subjects were admitted to the National Institutes of Health (NIH) Clinical Center for a 5-day, 4-night admission. Subjects who were treated with calcitriol discontinued the medication 2 days prior to the start of NPSP795. Home calcium supplements were administered up until the day of the first NPSP795 infusion. Thereafter, calcium supplementation was administered based on clinical symptoms of hypocalcemia as deemed necessary by the investigators. Subjects fasted from midnight until 4 hours after each infusion start. When not fasting, they consumed approximately 1000 mg/day of calcium from dietary sources throughout the study, but the diet was otherwise not standardized. The ionized calcium level was measured prior to each NPSP795 infusion and had to be 0.75 to 1.25 mmol/L (3–5 mg/dL) to start the infusion.
Subjects received 5 mg/10min NPSP795 via intravenous infusion on Day 1 with a plan to repeat the same dose if the ionized calcium was ≥ 1.12 mmol/L or the PTH level was > than the upper limit of normal (65 pg/mL). NPSP795 was chosen as the compound for this study because it was the most potent calcilytic that was available from the pharmaceutical collaborator. Because this was the first study to assess the effects of this class of drugs in ADH1, NPSP795 was administered intravenously in order to more rigorously control blood concentrations of the drug. The starting dose was selected because it was tested in previous healthy volunteer studies (NPSP7975 = SB-423562), was well-tolerated with no safety concerns and resulted in an increase in serum PTH (11). If there was no increase in ionized calcium or PTH, the dose of NPSP795 was increased the following day. Every 1 hour during the testing period, an investigator assessed tolerability of the infusion and monitored the ionized calcium levels and blood PTH levels. Because no subjects met the ionized calcium or PTH criteria to repeat a dose of NPSP795, they all received 15 mg/3.5h on Day 2 and 30 mg/3.5 h on Day 3 via intravenous infusion. These doses were determined using the indirect pharmacodynamic response model generated from healthy volunteer data in combination with the No Observed Adverse Effect Level of the drug in pre-clinical toxicology studies in non-human primates. Subjects underwent serial sampling via intravenous catheter to assess PK, PD, and safety parameters starting at baseline prior to each drug infusion. Subjects resumed home medications the morning following the final infusion of NPSP795 and were discharged home to the care of their local physician.
Study objectives and assessments.
The primary objectives of the study were to assess the safety and tolerability of NPSP795 when administered as multiple, dose-escalating i.v. infusions and to assess the PD effects and preliminary efficacy on change from baseline ionized calcium, blood and urinary calcium, and PTH. Renal ultrasounds were performed at the outpatient screening visit.
Safety assessments included evaluation for adverse events, physical examinations, ECGs, vital signs, bedside ionized calcium measurements, and standard clinical laboratory evaluations. Safety and tolerability were monitored continuously during the study while subjects were admitted to the NIH Clinical Center. A telephone follow-up safety assessment was performed approximately 14 days following discharge.
Sample collection.
To measure relevant PK/PD parameters such as NPSP795 drug concentrations, ionized calcium, blood and urine calcium, PTH, blood and urine phosphate, blood and urine creatinine, we collected samples from subjects at various time points depending on the dose of NPSP795. For NPSP795 5 mg/10min dose, blood sampling for PK and PTH determinations were performed at baseline, every 5 minutes for 15 minutes, every 15 minutes for 30 minutes, every 30 minutes until hour 4, and at 8 hours. Ionized calcium was measured at baseline, every 15 minutes for the first 2 hours and every 30 minutes thereafter until hour 4. For the 3.5h NPSP795 infusions, PK and PTH determinations were performed at baseline, every 15 minutes for 30 minutes, every 30 minutes until hour 4, and at hours 5 and 5.5; ionized calcium was measured at baseline, every 15 minutes for the first 2 hours and every 30 minutes thereafter until hour 4, and at hours 5 and 8 thereafter. Blood and spot urine sampling for determination of additional PD and other parameters was performed at baseline, 1, 2, 3, 4, 8, and 12 hours for all NPSP795 doses.
Routine blood and urine chemistries and complete blood count (CBC) were performed at the NIH Clinical Center Department of Laboratory Medicine. iPTH was determined via electrochemiluminescence immunoassay (Roche Cobas e601 analyzer; NIH, Bethesda, MD, USA), and 25-hydroxy-vitamin D was measured by chemiluminescence immunoassay (NIH, Bethesda, MD, USA). Ionized calcium measurements were performed at the subject’s bedside using the Radiometer ABL80 FLEX CO-OX blood gas analyzer (Radiometer America, Brea, CA, USA). NPSP795 blood concentrations were determined via a liquid chromatography/ tandem mass spectrometry assay with a lower limit of quantitation of 10.0 ng/mL that was validated in accordance with the FDA Guidance for Industry. Estimated GFR was calculated using the CKD-EPI equation. FECa was determined using the following calculation: (Urine-calcium*Plasma creatinine) / (Urine-creatinine*Plasma-total calcium).
Study approval.
This study was conducted in accordance with the ethical principles of the Declaration of Helsinki, and it received approval from the Institutional Review Board of the National Institute of Diabetes and Digestive and Kidney Diseases, NIH. All participants provided written informed consent before participating in any study procedures. The study was registered with ClinicalTrials.gov (NCT02204579).
In vitro studies: Generation of stable cell lines expressing WT or mutant CARs.
Site-directed mutagenesis was performed using the Stratagene QuikChange™ II kit according to the manufacturer’s instructions. Briefly, a pair of complementary primers of 25–35 bases was designed for each mutagenesis reaction with the mutation placed at the middle of the primers (Supplemental Table 1). The template, a cassette version of human CaR in pcDNA3.1(+) was amplified using Pfu II DNA polymerase with these primers for 18 cycles in a DNA thermal cycler. After digestion of the template DNA with DpnI the amplified mutant DNA was transformed into DH5α Escherichia coli. The incorporation of the desired mutations and absence of other mutations were confirmed by automated DNA sequencing (Eurofin MWG). Successful mutants and wt CaR were excised using restriction sites either side of the receptor (HindII/ApaI) in the multiple cloning site, before being ligated into a pcDNA5/FRT plasmid for generation of stable cell lines using the Flp-In system (ThermoFisher).
Generation of cell lines.
Stably expressing cell lines were developed using the Flp-In system (ThermoFisher) for generating constitutive expression cells lines. Commercially available Flp-In-293 cell lines from ThermoFisher are derived from HEK293 cells and stably express the pFRT/lacZeo plasmid containing an integrated Flp Recombinase Target (FRT) site. Flp-In-293 cells were maintained in 25-cm2 culture flasks and transfected with both pcDNA5/FRT/CaR (containing either WT or one of the ADH mutants) and pOG44 plasmid at a 9:1 ratio using Lipofectamine 2000™ according to the manufacturer’s instructions. Transfection of pOG44 leads to expression of Flp Recombinase and catalyses a homologous recombination effect between the FRT sites in pcDNA5/FRT/CaR and Flp-In-293 cells. Cells were selected over 2 – 3 weeks through media containing 150 ng/mL hygromycin. Resistant cells were then screened for activity in response to Ca2+o.
Receptor expression.
As part of the initial screening process the effect of ADH mutations on cell surface expression using transiently transfected FLAG-tagged WT or ADH mutant constructs was examined. This version of the CaR has a FLAG-tag between residues 371 and 372 in a loop tolerant of in-frame insertions. (19)
Cell surface expression by ELISA.
Quantification of total and cell surface expression was completed using an ELISA based assay that has been previously published. (20) HEK293 cells were transfected with WT or one of the 5 ADH Flag-tagged CaR constructs using Lipofectamine2000™ according to the manufacturer’s instructions. After ~ 24 hours transfected HEK293 cells were cultured into Poly-D-Lysine (Sigma) coated 96 well plates. Once cell reached an approximate density of 100% cells were washed once with TBS-T (0.05 M Tris, 0.15 M CaCl, 0.05% (w/v) Tween-20, pH 7.4) and fixed for 15 mins on ice with either 4% paraformaldehyde in PBS (137 mM NaCl, 2.7 mM KCl, 10 mM Na2HPO4, 1.8 mM KH2PO4, pH 7.4) to determine surface expression or methanol to determine total expression. After washing once with TBS-T, cells were blocked for 1 h at room temperature in 1% (w/v) skim milk in TBS-T, before being incubated with 1:1000 monoclonal FLAG M2 horse-radish peroxidase (HRP)-conjugated antibody (Sigma-Aldrich) in blocking solution for 1 h at room temperature. After incubation with the antibody, cells were washed three times with TBS-T before being incubated with a HRP substrate (3,3’5,5’ tetramethylbenzidence (TMB) liquid substrate solution) for 30 min in the dark. Enzyme reaction was stopped by adding equal volumes of 1 M HCl. Supernatant samples were transferred to a new plate and A450 values were obtain through a plate reader.
Measurements of Ca2+i in populations of cells using a plate reader.
Cells were plated in 96 well plates and grown to confluence before being loaded with 2 μM Fluo-4 for 30 min. Using a Fluoroskan Ascent plate reader (ThermoFisher Scientific), an initial baseline reading of ten measurements (at a calcium concentration of 0.2 mM) was taken to determine the 0 sec value. Calcium solutions which increased calcium concentration to 0.2 – 8 mM, in the presence and absence of 1 μM NPSP795 or vehicle control (0.01% DMSO), were dispensed into a single well and emission at 538 nm for each well was then followed for 30 s (1 reading every 5 seconds). Dose response curves were generated from the peak fluorescence upon the addition of the calcium solution and corrected for the initial baseline measurement. Peak fluorescence was then normalized to a 10 mM calcium + 2 μM ionomycin response to enable comparison between different plates.
Measurement of ERK and p38MAPK Phosphorylation.
These assays were carried out as described elsewhere. (21) Briefly, cells were incubated for 10-mins in either Experimental Buffer (0.5mM Ca2+o) alone or in buffer supplemented with either a) various concentrations of Ca2+o (2 – 10mM), or b) various concentrations of NPSP795 (1–1000nM; equal DMSO concentration in all samples) in the presence of either 2.4 mM Ca2+o (ADH mutants) or 3.4 mM Ca2+o (Wild-type); these Ca2+o being close to ~EC80 values for these receptors (with regards to ERK activation). Where [CaCl2] was increased, [NaCl] was reduced accordingly to normalize ionic strength. Where NPSP795 was used, cells were pre-exposed to the calcilytic for 30-secs before application of the high Ca2+o/NPSP795 co-treatment. The cell lysate supernatant was stored at −80°C until use, whereupon an aliquot was mixed with 5X Laemmli buffer and boiled for 3-min prior to immunoblotting (40–60 μl sample/lane) using the phospho-specific anti-ERK antibody or anti-p38MAPK antibody (1:5000; Cell Signaling). Protein equivalency of the samples was demonstrated initially by Ponceau staining the blot (prior to blocking) and then by stripping and reprobing with either total anti-ERK or anti-β-actin antibodies. Relative immunoreactivity was determined by densitometry.
Statistics.
The statistical analyses for the clinical research study were performed using SAS® software version 9. A mixed model repeat measures analysis with unstructured covariance matrix and Tukey adjustment was used. A p value of less than 0.05 was considered statistically significant. Statistical analyses performed for the in vitro studies using GraphPad Prism v5 included one-way ANOVA and Dunnett’s post-test when comparing log EC50 of CaR mutants to that of WT. Unpaired two-tailed Student’s t-tests were used to assess differences between log EC50 of CaRs in the presence or absence of NPSP795. Statistical analyses performed to assess correlations between in vitro and clinical findings included linear regression analysis using GraphPad Prism v7.
RESULTS
Subject characteristics.
Of the 9 patients screened, 8 were eligible, and 5 subjects with a mean age of 39.8 years (range 23–55) and mean BMI of 32.8 kg/m2 (range 29.4–37.2) completed the study (Supplemental Figure 1). Baseline demographics, disease characteristics, and CAR genotype of subjects enrolled are summarized in Table 1. All subjects had hypocalcemia, inappropriately low PTH levels, and had been diagnosed in childhood. Four subjects presented with hypocalcemic seizures, and 1 subject was tested for hypocalcemia after her mother was diagnosed with ADH1. Subjects 1 and 4 were first-degree cousins and shared the same mutation, A840V. Subject 5 was found to have a novel CAR mutation, E228A. Four subjects had low GFR (< 90 mL/min/1.73m2), and 3 subjects had evidence of nephrocalcinosis/nephrolithiasis on renal ultrasound at baseline.
Table 1.
Subject baseline demographics, biochemical profile, and disease characteristics.
| Subject # |
Age | Sex | Ethnicity | CaR Mutation |
Ca (8.6–10.2 mg/dL) |
Phos (2.5–4.5 mg/dL) |
iPTH (15–65 pg/mL) |
Cr (0.67–1.17 mg/dL) |
eGFR (≥90 mL/min/1.73m2) |
FECa | Renal Ultrasound |
|---|---|---|---|---|---|---|---|---|---|---|---|
| 1 | 55 | M | Caucasian | A840VΩ | 7.5 | 3.6 | 13.4 | 1.17 | 70 | 0.04 | Normal |
| 2 | 46 | M | Caucasian | Q245R | 7.1 | 3.3 | 9.5 | 1.13 | 78 | 0.03 | NC/NL |
| 3 | 23 | F | Caucasian | E228K | 7.6 | 5.6 | 5.0 | 1.43 | 51 | 0.04 | NC |
| 4 | 51 | F | Caucasian | A840VΩ | 8 | 5.6 | 12.4 | 1.03 | 62 | 0.01 | NC |
| 5 | 24 | M | Caucasian | E228AΨ | 8.5 | 4.3 | 6.9 | 1.05 | 99 | 0.01 | Normal |
Non-fasting laboratory studies obtained during screening visit while on treatment with calcium and calcitriol.
First degree cousins.
Novel mutation.
CaR = Calcium sensing receptor; Phos = phosphorus; iPTH = intact parathyroid hormone; Cr = creatinine; eGFR = estimated glomerular filtrate rate; FECa = fractional excretion of calcium; NC = nephrocalcinosis; NL = nephrolithiasis
Efficacy outcomes.
Subjects received 5 mg/10min NPSP795 on Day 1 with a plan to repeat the same dose if the ionized calcium was ≥ 1.12 mmol/L or the PTH level was > than the upper limit of normal (65 pg/mL). Because no subjects met the ionized calcium or PTH criteria to repeat a dose of NPSP795, all subjects received 15 mg/3.5h on Day 2 and 30 mg/3.5 h on Day 3 (Figure 1). Infusions of NPSP795 resulted in significant increases in blood levels of NPSP795 that were sustained during the infusion period (Figure 2A–C). NPSP795 resulted in a dose- and concentration-dependent increase in percent change in PTH from baseline, the primary endpoint, (Figure 2 D–F), that was paralleled by changes in PTH blood levels (Figure 2G–I). The maximum mean percent change (± 1SD) in PTH was 128.6% (±139%) at 15min following 5 mg/10min dose of NPSP795 (p=0.048), 49% (±47%) at 210min following 15 mg/3.5h dose (p=0.149), and 121% (±91%) at 210 min following the 30 mg/3.5h dose (p=0.013) (Figure 2D–F). The peak mean PTH (± 1SD) was 17.4 pg/mL (± 16) at 15min following 5 mg/10min dose of NPSP795, 13.7 pg/mL (± 5.9) at 210 min following 15 mg/35h dose, and 21 pg/mL (± 14) at 210min following 30 mg/3.5h dose (Figure 2G–I).
Figure 1. NPSP795 Clinical Study Design.
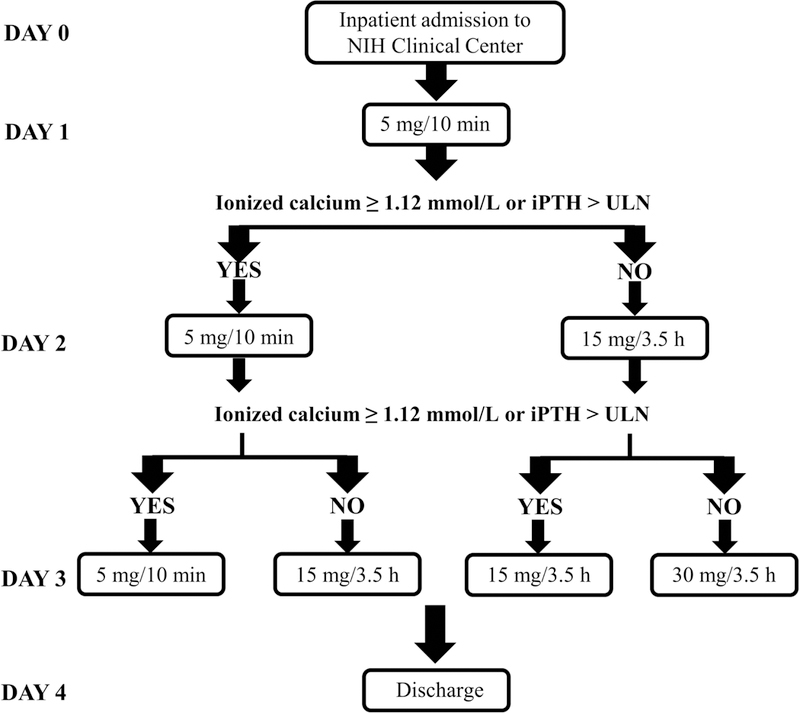
After an initial outpatient screening visit, subjects were admitted to the National Institutes of Health (NIH) Clinical Center. An i.v. dose of 5 mg/10min NPSP795 was administered on day 1, and subjects underwent serial sampling for pharmacokinetic/pharmacodynamic parameters. If subjects had an increase in ionized calcium to the normal range or an increase in intact parathyroid hormone (iPTH) to greater than the upper limit of normal (ULN), the same dose of NPSP795 would be administered on day 2. If subjects did not meet the ionized calcium or iPTH parameters, 15 mg/3.5h NPSP795 would be administered on day 2 along with serial sampling. The same criteria were used to determine the dose of NPSP795 on day 3. Subjects were discharged home on day 4.
Figure 2. Pharmacokinetic and pharmacodynamic effects of NPSP795.

NPSP795 concentrations significantly increased after infusion as predicted from modeling studies (A-C) and resulted in a rapid and concentration-dependent increase in % change in PTH (D-F) and PTH (G-I). Significant effects on PTH were seen at the highest concentrations in NPSP795 during the 5 mg bolus infusion on day 1 (D) and with the 30 mg infusion on day 3 (F, I). The fractional excretion of calcium (FECa) (J-L) decreased by > 30% following the 15 mg/3.5h, and >40% 30 mg/3.5h doses but did not reach statistical significance. The ionized calcium levels (M-O) remained stable during NPSP795 infusions despite fasting and calcium and calcitriol doses being withheld. Statistical analysis was performed using mixed model repeat measures analysis.
While fractional excretion of calcium (FECa) was decreased at the higher exposures of NPSP795, the changes were not statistically significant. The mean (±1SD) maximum decrease in the FECa occurred during the 15 mg/3.5h (maximum −36% (± 27%) at 120min) and 30 mg/3.5h (maximum of −43% (± 25%) at 120min) doses (Figure 2J–L).
The changes in PTH and FECa were not sufficient to result in an increase in blood calcium levels (Figure 2M–O). Of note, prescribed calcitriol was discontinued 2 days prior to study start, calcium supplements were discontinued at least 12 hours prior to study start, and subjects were fasted for the first four hours of dosing and serial sampling. Subjects received between 250–1200 mg of elemental calcium supplementation in the evening. Two subjects required rescue calcium for symptoms of hypocalcemia including paresthesias and muscle cramping that totaled 600 and 1,800 mg of elemental calcium (Supplemental Table 2). Thus, while ionized calcium levels did not rise in response to NPSP795, they remained stable and did not decline during NPSP795 administration despite fasting and withholding of calcitriol, consistent with an effect of NPSP795 infusion on maintaining blood calcium levels.
Safety.
NPSP795 infusions were generally well-tolerated. In total, 1 serious adverse event and 2 adverse events (AEs) were reported by 3 subjects during the study. Subject 1, who was obese and had a family history of cholelithiasis, developed symptomatic cholelithiasis on the morning of day 4 after receiving the 3 doses of NPSP795. The symptoms resolved, and he was discharged home to the care of his primary physician. However, symptoms returned upon discharge, and the subject underwent a laparoscopic cholecystectomy. The subject did well post-operatively without additional adverse events. Considering the timing of the symptoms in relation to NPSP795 dosing, the investigators concluded that the SAE was unlikely to be related to the study drug. The other two AEs, facial swelling and bilateral nipple sensitivity, which occurred 72 and 48 hours after the last dose of study drug, respectively, were deemed unrelated to NPSP795 and resolved without incident. No deaths were reported during the study or follow-up period. The study was discontinued after data from 5 subjects revealed the short-acting nature of NPSP795 and lack of effect on blood ionized calcium.
Response by genotype.
Despite similar blood concentrations of NPSP795 (Figure 3B), there was wide variability in the response to this calcilytic across genotypes as assessed by PTH AUC (Figure 3A). This is particularly evident in comparing subjects 1 and 4, who had the same CAR mutation (A840V), and had markedly different increases in PTH AUC (Figure 3C). In fact, while the NPSP795 AUC in subject 1 was generally lower than subject 4 (Figure 3D), the PTH AUC in subject 1 was higher than in subject 4. In addition, subject 3 (E228K mutation) had almost no response to NPSP795 in terms of PTH AUC (Figure 3E), and was considered a non-responder, yet subjects 3 and 5 (E228A mutation) had similar exposure to NPSP795 (Figure 3F). Baseline PTH and dose of calcium supplementation prior to study entry for each subject was compared to the respective PTH AUC. There were no statistically significant correlations between these clinical parameters and PTH AUC as assessed by linear regression analysis.
Figure 3. Clinical response to NPSP795 by CaR genotypes.
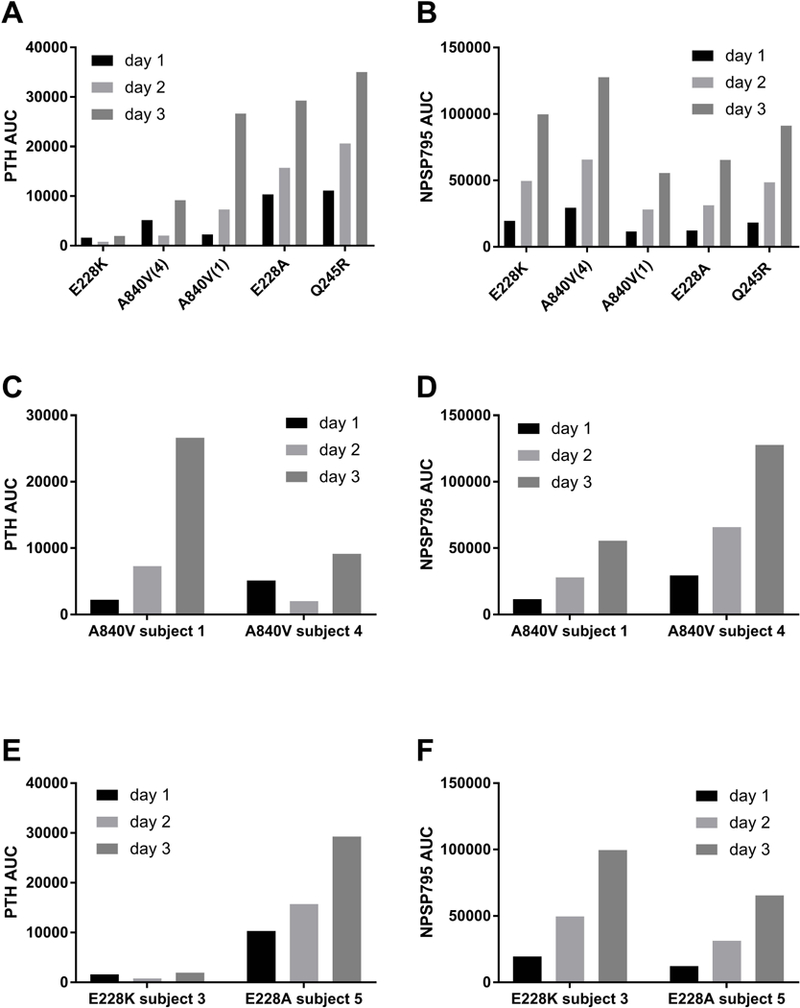
PTH area under the curve (AUC) varied widely across the different CAR mutations despite overall similar exposure to NPSP795 (B). The subject with E228K mutation in the CAR had little to no response to NPSP795 (A). Subjects 1 and 4 were first-degree cousins with the same A840V CAR mutation but had widely different responses to NPSP795 (C). Differences in response were not accounted for by differences in NPSP795 clearance, as subject 4 had higher NPSP795 exposure (D), but less of a response. Of note, subjects 3 and 5 both had E228 mutations, K and A, respectively, but markedly different responses. Subject 3 had little response (E), but robust NPSP795 blood levels (F).
In vitro analyses. Response by genotype.
To assess potential genotype/phenotype correlations and understand variability in clinical response to NPSP795, stable cell lines expressing wild-type (WT) and subject mutant CaRs were generated in HEK293-derived Flp-In-293s cells, and the Ca2+o concentration at which half-maximal (EC50) Ca2+i occurred was measured. The same parameter was assessed for an increase in ERK and p38 phosphorylation in parallel. In addition, the NPSP795 concentration at which these parameters were half-maximally inhibited (IC50) was determined. The EC50 for Ca2+i mobilization, and ERK and p38 phosphorylation for all mutant CaRs were significantly less than WT (Table 2). Likewise, NPSP795 significantly increased all these parameters (Table 2). These changes were not ascribed to differences in total or cell surface expression (Supplemental Figure 4). Also, comparable results were obtained in transient and stable transfections (not shown). Together, these results suggest that the enhanced signaling responses to Ca2+o, and the ability of calcilytics to restore such response, were not due to differences in mutant receptor expression. All EC50 data were compared to the clinical parameter PTH AUC. There were no statistically significant correlations between any in vitro finding and PTH AUC as assessed by linear regression analysis.
Table 2.
Summary of in vitro and PTH AUC findings.
| EC50 Ca2+i mobilization (mM) |
EC50 ERK phosphorylation (mM) |
EC50 P38MAPK phosphorylation (mM) |
IC50 NPSP795 Ca2+i mobilization (μM) |
IC50 NPSP795 ERK phosphorylation (nM) |
IC50 NPSP795 P38MAPK phosphorylation (nM) |
Day 3 PTH AUC |
|
|---|---|---|---|---|---|---|---|
| WT | 2.9 | 3.0 | 4.2 | 5.2 | 112 | 88 | |
| Q245R | 1.0 | 2.0 | 2.0 | 1.76 | 52 | 58 | 35040 |
| E228K | 0.8 | 1.7 | 1.6 | 0.04 | 91 | 69 | 1937 |
| E228A | 0.7 | 2.1 | 2.2 | 1.25 | 32 | 10 | 29280 |
| A840V | 1.3 | 2.0 | 2.3 | 1.15 | 50 | 70 | Subject 1: 26648 |
| Subject 4: 9141 |
DISCUSSION
Hypoparathyroidism, in particular ADH1, is a disease for which there remains a need for better therapeutics. (10,22,23) Given that ADH1 results from gain-of-function mutations in the CAR, negative allosteric modulators of the CaR, calcilytics, represent a rational, precision medicine approach to treating this disease. Through a public/private partnership between the NIDCR and NPS Pharmaceuticals (acquired by Shire in 2015), the short-acting calcilytic NPSP795, which was initially developed as a treatment for osteoporosis, , was repurposed to study the potential for efficacy in patients with ADH1. In this proof-of-principle, dose-finding study the initial question was if parathyroid glands in patients with ADH1, which have been essentially dormant for life, would respond to a calcilytic. This was clearly shown to be the case. There were dose-dependent increases in PTH that were significant at the highest drug exposure levels (Figure 3). The on- and off-effect was rapid, with PTH levels rising rapidly after infusion and dropping rapidly in a single phase, exponential decay pattern following cessation of drug infusion (Figure 2). At the highest levels of exposure, there appeared to be a decrease in FECa although it did not reach statistical significance (Figure 2K–L) but was consistent with the predicted effect of a calcilytic on renal calcium handling, and points to the fact that the study was underpowered to see a significant effect on FECa. The short-acting nature of NPSP795 could also account for the lack of sustained effect on FECa.
All subjects required both calcitriol and calcium prior to enrolling in the study to maintain blood calcium levels. Throughout the study, all subjects were kept on a fixed, relatively low dose calcium diet (1,000 mg/day), and no subjects were taking calcitriol. All subjects received some supplemental calcium at bedtime to avoid symptomatic hypocalcemia while fasting, and two subjects required a rescue calcium for symptoms of hypocalcemia (Supplemental Table 2). The maintenance of blood calcium levels (Figure 2M–O) with significantly decreased medication would be very unusual in patients with treatment-dependent ADH1 such as those studied and is consistent with an effect of study drug at maintaining blood calcium. However, it is likely the case that substantially higher doses of NPSP795 will be needed to have significant effects on FECa and blood calcium. It was previously shown in a single-dose study of PTH 1–84 in patients with hypoparathyroidism that blood levels of PTH near 200 pg/ml, ten times the levels achieved in this study, were needed to illicit a clear effect on FECa and blood calcium(24).
Of note was the marked variability in response to NPSP795 in terms of effects on PTH that was not explained by differences in drug levels. The differences in PTH response to NPS795 were particularly striking in the two patients with the same mutation (subjects 1 and 4, first-degree cousins) (Figure 3C). Probably some of the difference in PTH response between the two subjects can be explained by differences in drug levels (Figure 3D), but it is likely most of the difference is explained by other factors such as metabolism, body mass, diet, sex hormones, renal function, etc. In addition, there was no relationship between PTH AUC and NPSP795 drug levels (Figure 3). These differences in response, especially between the first-degree cousins, suggest that there are additional factors that control PTH secretion, such as disease-modifying genes, that are not well understood and require further investigation.
This study is limited by the lack of a placebo or control group and a small number of subjects that represented only 4 CaR mutations. Although the urinary FECa results suggested a decrease with exposure to NPSP795, this did not reach statistical significance, which may have been achieved with a larger number of subjects and a control group. In addition, referral bias may affect our findings. As a tertiary referral center, these subjects may be more severely affected which could diminish potential generalizability of the findings.
While this proof-of-principle study was unable to demonstrate significant effects on urinary FECa and blood calcium due to the small number of subjects and limited drug exposure, it clearly demonstrated that calcilytics can rapidly stimulate PTH secretion in ADH1 and that it is highly likely that with adequate drug exposure calcilytics may be an effective treatment for ADH1. Further, they may represent a treatment for other forms of hypoparathyroidism, including ADH2, due to their independent actions on the kidney, and possibly even idiopathic hypercalciuria.
Supplementary Material
ACKNOWLEDGEMENTS:
The authors are thankful to the subjects for their participation in the trial. This research was supported by NPS Pharmaceuticals, Inc., and by the intramural research program of the NIH, NIDCR.
FUNDING. This research was supported by NPS Pharmaceuticals, Inc., and, in part, by the intramural research program of the NIH, NIDCR.
The NIDCR Investigators (MSR, BB, LCG, RIG, JS, and MTC) received non-salary financial support from NPS Pharmaceuticals to conduct the research described herein and financial support from Shire for research investigating pharmaceutical agents not discussed in this work. SCB, MS, DR, MBK, and DTW received financial support from NPS Pharmaceuticals to conduct research described herein. DG, JG, EK, and RR were employees of NPS Pharmaceuticals when this research was conducted. MSR became an employee of Ultragenyx Pharmaceuticals in September 2017, after work on this project was completed.
Footnotes
Disclosures:
REFERENCES
- 1.Pearce SH, Williamson C, Kifor O, Bai M, Coulthard MG, Davies M, et al. A familial syndrome of hypocalcemia with hypercalciuria due to mutations in the calcium-sensing receptor. N Engl J Med. October 10 1996;335(15):1115–22. [DOI] [PubMed] [Google Scholar]
- 2.Baron J, Winer KK, Yanovski JA, Cunningham AW, Laue L, Zimmerman D, et al. Mutations in the Ca(2+)-sensing receptor gene cause autosomal dominant and sporadic hypoparathyroidism. Hum Mol Genet. May 1996;5(5):601–6. [DOI] [PubMed] [Google Scholar]
- 3.Brown EM, Gamba G, Riccardi D, Lombardi M, Butters R, Kifor O, et al. Cloning and characterization of an extracellular Ca(2+)-sensing receptor from bovine parathyroid. Nature. December 9 1993;366(6455):575–80. [DOI] [PubMed] [Google Scholar]
- 4.Nemeth EF, Scarpa A. Rapid mobilization of cellular Ca2+ in bovine parathyroid cells evoked by extracellular divalent cations. Evidence for a cell surface calcium receptor. J Biol Chem. April 15 1987;262(11):5188–96. [PubMed] [Google Scholar]
- 5.Hebert SC, Brown EM, Harris HW. Role of the Ca(2+)-sensing receptor in divalent mineral ion homeostasis. J Exp Biol. January 1997;200(Pt 2):295–302. [DOI] [PubMed] [Google Scholar]
- 6.Nesbit MA, Hannan FM, Howles SA, Babinsky VN, Head RA, Cranston T, et al. Mutations affecting G-protein subunit alpha11 in hypercalcemia and hypocalcemia. N Engl J Med. June 27 2013;368(26):2476–86. [DOI] [PMC free article] [PubMed] [Google Scholar]
- 7.Mannstadt M, Harris M, Bravenboer B, Chitturi S, Dreijerink KM, Lambright DG, et al. Germline mutations affecting Galpha11 in hypoparathyroidism. N Engl J Med. June 27 2013;368(26):2532–4. [DOI] [PMC free article] [PubMed] [Google Scholar]
- 8.Piret SE, Gorvin CM, Pagnamenta AT, Howles SA, Cranston T, Rust N, et al. Identification of a G-Protein Subunit-alpha11 Gain-of-Function Mutation, Val340Met, in a Family With Autosomal Dominant Hypocalcemia Type 2 (ADH2). J Bone Miner Res. June 2016;31(6):1207–14. [DOI] [PMC free article] [PubMed] [Google Scholar]
- 9.Riccardi D, Brown EM. Physiology and pathophysiology of the calcium-sensing receptor in the kidney. Am J Physiol Renal Physiol. March 2010;298(3):F485–99. [DOI] [PMC free article] [PubMed] [Google Scholar]
- 10.Roszko KL, Bi RD, Mannstadt M. Autosomal Dominant Hypocalcemia (Hypoparathyroidism) Types 1 and 2. Front Physiol. 2016;7:458. [DOI] [PMC free article] [PubMed] [Google Scholar]
- 11.Kumar S, Matheny CJ, Hoffman SJ, Marquis RW, Schultz M, Liang X, et al. An orally active calcium-sensing receptor antagonist that transiently increases plasma concentrations of PTH and stimulates bone formation. Bone. February 2010;46(2):534–42. [DOI] [PubMed] [Google Scholar]
- 12.Loupy A, Ramakrishnan SK, Wootla B, Chambrey R, de la Faille R, Bourgeois S, et al. PTH-independent regulation of blood calcium concentration by the calcium-sensing receptor. J Clin Invest. September 2012;122(9):3355–67. [DOI] [PMC free article] [PubMed] [Google Scholar]
- 13.Letz S, Rus R, Haag C, Dorr HG, Schnabel D, Mohlig M, et al. Novel activating mutations of the calcium-sensing receptor: the calcilytic NPS-2143 mitigates excessive signal transduction of mutant receptors. J Clin Endocrinol Metab. October 2010;95(10):E229–33. [DOI] [PubMed] [Google Scholar]
- 14.Hannan FM, Walls GV, Babinsky VN, Nesbit MA, Kallay E, Hough TA, et al. The Calcilytic Agent NPS 2143 Rectifies Hypocalcemia in a Mouse Model With an Activating Calcium-Sensing Receptor (CaSR) Mutation: Relevance to Autosomal Dominant Hypocalcemia Type 1 (ADH1). Endocrinology. September 2015;156(9):3114–21. [DOI] [PMC free article] [PubMed] [Google Scholar]
- 15.Hough TA, Bogani D, Cheeseman MT, Favor J, Nesbit MA, Thakker RV, et al. Activating calcium-sensing receptor mutation in the mouse is associated with cataracts and ectopic calcification. Proc Natl Acad Sci U S A. September 14 2004;101(37):13566–71. [DOI] [PMC free article] [PubMed] [Google Scholar]
- 16.Gorvin CM, Hannan FM, Howles SA, Babinsky VN, Piret SE, Rogers A, et al. Galpha11 mutation in mice causes hypocalcemia rectifiable by calcilytic therapy. JCI Insight. February 9 2017;2(3):e91103. [DOI] [PMC free article] [PubMed] [Google Scholar]
- 17.Roszko KL, Bi R, Gorvin CM, Brauner-Osborne H, Xiong XF, Inoue A, et al. Knockin mouse with mutant Galpha11 mimics human inherited hypocalcemia and is rescued by pharmacologic inhibitors. JCI Insight. February 9 2017;2(3):e91079. [DOI] [PMC free article] [PubMed] [Google Scholar]
- 18.Dong BZ, Endo I, Ohnishi Y, Kondo T, Hasegawa T, Amizuka N, et al. Calcilytic Ameliorates Abnormalities of Mutant Calcium-Sensing Receptor (CaSR) Knock-In Mice Mimicking Autosomal Dominant Hypocalcemia (ADH). Journal of Bone and Mineral Research. November 2015;30(11):1980–93. [DOI] [PubMed] [Google Scholar]
- 19.Bai M, Janicic N, Trivedi S, Quinn SJ, Cole DE, Brown EM, et al. Markedly reduced activity of mutant calcium-sensing receptor with an inserted Alu element from a kindred with familial hypocalciuric hypercalcemia and neonatal severe hyperparathyroidism. J Clin Invest. April 15 1997;99(8):1917–25. [DOI] [PMC free article] [PubMed] [Google Scholar]
- 20.Goolam MA, Ward JH, Avlani VA, Leach K, Christopoulos A, Conigrave AD. Roles of intraloops-2 and −3 and the proximal C-terminus in signalling pathway selection from the human calcium-sensing receptor. FEBS Lett. September 17 2014;588(18):3340–6. [DOI] [PubMed] [Google Scholar]
- 21.Ward DT, McLarnon SJ, Riccardi D. Aminoglycosides increase intracellular calcium levels and ERK activity in proximal tubular OK cells expressing the extracellular calcium-sensing receptor. J Am Soc Nephrol. June 2002;13(6):1481–9. [DOI] [PubMed] [Google Scholar]
- 22.Mannstadt M, Bilezikian JP, Thakker RV, Hannan FM, Clarke BL, Rejnmark L, et al. Hypoparathyroidism. Nat Rev Dis Primers. August 31 2017;3:17055. [DOI] [PubMed] [Google Scholar]
- 23.Bilezikian JP, Khan A, Potts JT Jr., Brandi ML, Clarke BL, Shoback D, et al. Hypoparathyroidism in the adult: epidemiology, diagnosis, pathophysiology, target-organ involvement, treatment, and challenges for future research. J Bone Miner Res. October 2011;26(10):2317–37. [DOI] [PMC free article] [PubMed] [Google Scholar]
- 24.Clarke BL, Kay Berg J, Fox J, Cyran JA, Lagast H. Pharmacokinetics and pharmacodynamics of subcutaneous recombinant parathyroid hormone (1–84) in patients with hypoparathyroidism: an open-label, single-dose, phase I study. Clin Ther. May 2014;36(5):722–36. Epub 2014/05/08. [DOI] [PubMed] [Google Scholar]
Associated Data
This section collects any data citations, data availability statements, or supplementary materials included in this article.