

Abstract
Cancer immunotherapies have demonstrated durable responses in a range of different cancers. However, only a subset of patients responds to these therapies. We set out to test if non-invasive imaging of tumor perfusion and vascular inflammation may be able to explain differences in T-cell infiltration in pre-clinical tumor models, relevant for treatment outcomes. Tumor perfusion and vascular cell adhesion molecule (VCAM-1) density were quantified using magnetic resonance imaging (MRI) and correlated with infiltration of adoptively transferred and endogenous T-cells. MRI biomarkers were evaluated for their ability to detect tumor rejection 3 days after T-cell transfer. Baseline levels of these markers were used to assess their ability to predict PD-L1 treatment response. We found correlations between MRI-derived VCAM-1 density and infiltration of endogenous or adoptively transferred T-cells in some preclinical tumor models. Blocking T-cell binding to endothelial cell adhesion molecules (VCAM-1/ICAM) prevented T-cell mediated tumor rejection. Tumor rejection could be detected 3 days after adoptive T-cell transfer prior to tumor volume changes by monitoring the extracellular extravascular volume fraction. Imaging tumor perfusion and VCAM-1 density before treatment initiation was able to predict the response of MC38 tumors to PD-L1 blockade. These results indicate that MRI based assessment of tumor perfusion and VCAM-1 density can inform about the permissibility of the tumor vasculature for T-cell infiltration which may explain some of the observed variance in treatment response for cancer immunotherapies.
Abbreviations: ADC, apparent diffusion coefficient; CAR, chimeric antigen receptor; CTLA-4, cytotoxic T-lymphocyte-associated protein 4; DCE, dynamic contrast enhancement; DMEM, Dulbecco's Modified Eagle Medium; FA, flip angle; FCS, fetal calf serum; FOV, field of view; ICAM, intercellular adhesion molecule; IgG, immunoglobulin G; IL-2, interleukin 2; INF-y, interferon gamma; MPIO, microparticles of iron oxide; MRI, magnetic resonance imaging; NEX, number of excitations; PD-L1, programmed death ligand 1; PFA, paraformaldehyde; TE, echo time; TNF, tumor necrosis factor alpha; TR, repetition time; VCAM-1, vascular cell adhesion molecule 1
Introduction
Recent advancements in our understanding of immune cell activation and inhibition have led to the development of cancer immunotherapies. Clinically approved chimeric antigen receptor (CAR) T-cell therapies and immune checkpoint inhibitors (CTLA-4, PD-1/PD-L1) have demonstrated durable response rates between 20% and 50% in a range of cancers [1], [2], [3], [4], [5]. Development of predictive biomarkers becomes particularly important as the majority of patients do not benefit from these therapies with the potential for strong side effects. T-cell density and localization have been identified as predictive biomarkers for treatment response in colorectal cancer [6]. Additional biomarkers, such as tumor cell PD-L1 expression, neo-antigen availability or transforming growth factor beta (TGF-β), have been recently proposed [7], [8], [9]. However, these require invasive biopsies which are not always feasible and prone to sampling errors. Non-invasive imaging techniques have been proposed to overcome these limitations [10], [11], [12], [13]. Although pre-clinical studies have shown some promising results for positron emission tomography (PET) based T-cell imaging [14], [15], [16] using labeled antibodies, these findings have not been validated clinically so far.
While accurate quantification of T-cell density is likely to be informative, additional biomarkers may be required to predict treatment response. Aside from T-cell receptor recognizable neo-antigens, all immunotherapies require direct interaction of cytotoxic T-cells with tumor cells. This is facilitated by recruitment of T-cells to tumors and extravasation into the tumor parenchyma. However, the tumor vasculature is characterized by irregular, leaky, and poorly perfused vessels with low adhesion molecule expression [17], [18]. These abnormalities have long been recognized as an impediment for efficient T-cell infiltration [19], [20], [21]. Several approaches such as Rgs5 knock out, low dose anti-angiogenic treatment or vascular endothelial cadherin targeting among others have led to a more normal appearing vascular phenotype with synergistic efficacy for immunotherapies in preclinical models [21], [22], [23].
T-cell infiltration in the tumor parenchyma requires blood flow driven passive transport of T-cells into tumors, slowdown of T-cells through interaction with selectins (tethering/rolling), chemokine induced polarization of T-cells and firm attachment through vascular cell adhesion molecule (VCAM-1)/intercellular adhesion molecule (ICAM) integrin interactions [24]. Stimulation of endothelial cells with pro-inflammatory cytokines such as tumor necrosis factor alpha (TNF) or interferon gamma (IFN-γ) can increase the expression of cell adhesion molecules leading to increased T-cell infiltration [20], [25].
Previous studies have shown that VCAM-1 targeted antibodies conjugated to microparticles of iron oxide (VCAM-MPIO) can be used as a magnetic resonance imaging (MRI) contrast agent to detect acute inflammation in the brain [26]. Furthermore VCAM-MPIO has been used to detect renal inflammation following local ischemia [27] and inflammation associated with micro-metastases [28]. However, this approach has not been used to characterize the role of vascular inflammation for T-cell infiltration so far.
We therefore decided to test if VCAM-MPIO could quantify vascular VCAM-1 density in tumors non-invasively, where the size of MPIO limits targeting to intravascular VCAM-1. We assessed if k-trans, a dynamic contrast enhancement MRI-derived parameter for tumor perfusion and permeability in combination with vascular VCAM-1 density correlate with T-cell infiltration in different tumor models. To verify the importance of these interactions, antibodies blocking T-cell binding to vascular adhesion molecules (VCAM-1/ICAM) were evaluated in an adoptive T-cell transfer model. Using this model, serial MRI was performed to find early treatment response biomarkers for T-cell mediated tumor rejection. Finally, MRI biomarkers were used to predict response to checkpoint blockade (PD-L1) in a murine colon carcinoma model.
Material and Methods
Tumor Cell Lines
Different tumor cell lines were selected based on VCAM-1 expression in the tumor vasculature (Supplementary Figure 1) to cover low and high VCAM-1 densities. EL4 mouse lymphoma cells (ATTC; TIB-39), E.G7-OVA mouse lymphoma (ATTC; CRL-2113), CT26 mouse colon cancer cells (ATCC; CRL-2638), and MC38 mouse colon cancer cells (National Cancer Institute/NIH) were cultured in DMEM supplemented with 10% FCS, 100 U/ml penicillin, and 100 μg/ml streptomycin at 37 °C in a humidified chamber with 5% carbon dioxide.
VCAM- and IgG-MPIO Preparation
To enable dual modality imaging, VCAM-1 or isotype control antibodies (immunoglobulin G, IgG; BD 553330, BD 553927) were buffer exchanged to PBS using NAP25 gel filtration tubes (GE Healthcare). Buffer exchanged antibodies were concentrated to 6 mg/kg (Amicon Ultra-4, 30 kDa, EMD Millipore) and 30% (volumetric) of 0.1 M sodium borate buffer pH 9.5 were added. The chelator p-SCN-Bn-Deferoxamine (Macrocyclics, B-705) was dissolved in DMSO, 4 mol deferoxamine/mol antibody were added to the antibody solution and incubated at 37°C for 90 minutes. Excess chelator was removed via buffer exchange and coupling efficiency was checked with LC–MS. Chelator coupled antibodies were covalently attached to tosylactivated Dynabeads (MPIO microparticles of iron oxide) following manufacturer's protocol (Invitrogen 65501) using 1 mg antibody for 25 mg Dynabeads. Binding of VCAM-MPIO and IgG-MPIO to stimulated endothelial cells was tested as outlined below. For MRI, antibody-MPIO were re-suspended 1 minute prior to injection using 0.45 mg particles for a 25 g mouse in 100 μl saline. For PET (positron emission tomography) imaging, antibody-MPIO were loaded with 68Ga at pH 4 for 15 minutes at room temperature followed by several washing steps leading to an activity of approximately 1200 μCi/mg particle.
In Vitro Binding of IgG- and VCAM-MPIO
Murine endothelial cells (MS1, ATCC, CRL-2279) were cultured in DMEM supplemented with 10% FCS, 100 U/ml penicillin, and 100 μg/ml streptomycin at 37 °C in a humidified chamber with 5% carbon dioxide. MS1 cells were plated in 6-well plates and grown until 80% confluent. Fresh media or fresh media containing TNF (10 or 30 ng/ml) was added and cells were incubated overnight. IgG- or VCAM-MPIO were diluted in full culture medium 18 μg/ml media. Culture media was removed from 6-well plates, and 3-ml particle suspension were added to each well in duplicates. Plates were incubated on an orbital shaker at 37° Celsius for 30 minutes. Following incubation, media was replaced with PBS and incubated on an orbital shaker for 5 minutes. This washing step was repeated five times. After the last washing step, cells were fixed with 2% paraformaldehyde (PFA) for 10 minutes at room temperature. Cells were stained for VCAM-1 as outlined below. Stained cells were imaged on a Nikon A1 confocal microscope (20× air objective). Confocal fluorescence images were acquired to visualize nuclei and VCAM-1 binding while transmission light images were acquired to visualize bound MPIO. Bound MPIO were detected based on automatic threshold-based segmentation using an in-house written Matlab script.
T-Cell Binding to Endothelial Cells
Murine endothelial cells (MS1) were seeded in parallel plate flow chambers (80176, Ibidi, Germany) and incubated for 1 day. To stimulate adhesion molecule expression, media was replaced with fresh media containing 30 ng/ml TNF and incubated overnight. Flow chambers were placed on a heated Nikon Eclipse Ti stage with a 10× objective. Activated T-cells suspended in binding buffer (Hanks' Balanced Salt Solution with Ca and Mg + 3% bovine serum albumin) were pumped through chambers with syringe pumps. Endothelial cells were incubated with blocking antibodies (VCAM-1 or ICAM, 10 μg/ml) for 15 minutes prior to T-cell exposure. T-cells were pumped through the channel at 1 dyn/cm2 for 2 minutes, followed by 2 minutes settling phase without flow, and a 2 minutes wash phase with binding buffer at 5 dyn/cm2. Fluorescence images were recorded every 100 ms (Zyla 5.5 sCMOS, Oxford Instruments, UK). Blocking antibodies against T-cell expressed targets (CD18, CD49d, 10 μg/ml) were mixed with T-cells suspended in binding buffer. The percentage of retained cells was calculated based on automatic detection of T-cells at the start and end of the washing phase.
Syngeneic Tumor Models
All animal procedures were performed in accordance with guidelines from the Institutional Animal Care and Use Committee (IACUC) at Genentech Inc. Female Balb/c, C57BL/6 or NSG (n = 12, n = 82, n = 28, 20–25 g; Jackson Laboratory, ME) were inoculated subcutaneously on the right hind leg with tumor cells (105/mouse) re-suspended in 100 μl Hank's Balanced Salt solution. Balb/c mice were used for CT26 (n = 12) while C57BL/6 mice were used for B16F10 (n = 12), EL4 (n = 24) and MC38 (n = 47). NSG mice were used for E.G7-OVA tumor inoculations (n = 10). Body weights and tumor volumes (caliper measurements) were recorded every 3–4 days. MRI was performed on all tumors except for n = 10 EL4 used for PET and n = 20 MC38 tumors used for control and PD-L1 control groups. Only a subset tumors was used for histology.
Ultrasound Imaging
Mice were anesthetized with 4% sevoflurane (Zoetis, Japan) and maintained at 2% on a heated platform in prone position. Tumor and surrounding areas were shaved and depilatory cream (Reckitt Benckiser, UK) was applied for approximately 1 minute, removed with dry gauze followed by water-soaked gauze. Following hair removal, ultrasound gel (Aquasonic, Parker Labs, NJ) was applied for acoustic coupling. Hair removal was performed for all tumors except MC38 control (n = 10), MC38 PD-L1 not undergoing MRI imaging (n = 10) and EL4 tumors used for PET imaging (n = 10). A Vevo 2100 ultrasound system (Visualsonics, Canada) with a 40 MHz probe was used to acquire 3D volumes covering the tumor. Tumor volumes were estimated by manual segmentation.
PET Imaging
PET imaging was conducted using Siemens Inveon PET/CT scanners (Siemens Preclinical Solutions, Knoxville, TN, USA). Animals were administered approximately 100 μCi (71–105) 68Ga-VCAM-MPIO or 68Ga-IgG-MPIO via indwelling tail vein catheter and scanned for 45 minutes. All PET scans were immediately followed by a CT scan for anatomical reference and attenuation correction of PET data. Data were iteratively reconstructed to a voxel size of 0.4×0.4×0.8 mm3. Ellipsoidal regions of interest (ROIs) were manually defined around the heart, liver, spleen, and tumor. Decay-corrected signal intensity was measured as percentage of the injected dose per gram tissue (%ID/g).
Tracer Kinetic Modeling
Tracer kinetics in blood and tumor were approximated by a linear compartmental model fitted to PET imaging data. Tracer time-activity curves for blood were obtained by drawing ROIs within the heart, which was used as a surrogate for blood. Blood and tumor kinetics were described by a 5-compartment model (Supplementary Figure 2E) where the former was characterized by pharmacokinetic clearance (CL) and volume (V) parameters and served to drive kinetics within tumor, described by a standard PET tracer tissue uptake model [29]. A delay compartment was included to capture the lag time between administration of tracer via tail vein and arrival at the heart. The model was implemented using SimBiology (The Mathworks, Inc., Natick, MA).
Adoptive T-Cell Transfer
Spleens from CD4-tdtomato-TCR-OTI mice (in-house strain) were excised and homogenized through a 70 μm nylon mesh. CD8 positive T-cells were isolated through negative selection using magnetic beads following manufactures instructions (130–104-075, Miltenyi, Germany). CD8 T-cells were activated with CD3/CD28 beads (25 μl beads/1E6 cells, 11452D, Life Technologies, CA) for 48 hours in RPMI 1640 media containing 10% fetal bovine serum, 1% Penicillin Streptomycin, 1× GlutaMax, 1 mM Pyruvate, 50 μM 2-mercaptoethanol and 50 IU/ml recombinant interleukin 2 (IL-2, 212–12, PeproTech, CA). Following activation, CD3/CD28 beads were removed and T-cells re-suspended to 1E6 cells/ml in fresh media and IL-2 every 24–48 hours. T-cells were expanded for 5–8 days, washed once in PBS and infused into anesthetized mice via tail vein catheters (10E6 cells in 100 μl of saline).
FACS Analysis of Circulating T-Cells
Two days after adoptive T-cell transfer and IgG control or CD18/CD49d antibody administration, mice were anesthetized and 100 μl of blood were collected from lateral tail veins in EDTA tubes. Samples were kept at room temperature until red blood cell lysis was completed (red blood cell lysis buffer, Sigma). Cells were washed twice with PBS and re-suspended in FACS buffer (PBS + 2% donkey serum + 2 mM EDTA). DAPI 1 μg/ml was added and the fraction of tdTomato positive cells in circulating blood cells was determined using FACS (FACSAria, BD Biosciences, CA).
Magnetic Resonance Imaging
MRI was performed on a 9.4 T horizontal bore scanner (Bruker, Ettlingen, Germany) with a 86 mm diameter volume transmit and a 4-channel mouse phased array receive only CryoProbe. Tumors were embedded in dental paste (Cavex, The Netherlands) to reduce susceptibility artifacts from the tumor/air boundary. Ultrasound was used to track tumor growth for all tumors undergoing MRI. This included hair removal which facilitated the application of dental paste on the skin covering the tumor. Pre-MPIO contrast imaging included T2 mapping, apparent diffusion coefficient (ADC) mapping, T2* mapping, and dynamic contrast enhancement (DCE) MRI. Following pre-MPIO contrast imaging, animals were removed from the magnet and 4.5 mg/kg MPIO conjugated to either VCAM-1 (VCAM-MPIO) or Rat-IgG (IgG-MPIO) were infused via a tail vein catheter. Mice were kept anesthetized outside of the magnet for 10 minutes (except for B16F10 which were kept for 40 minutes due to slower clearance of non-bound particles from tumors, data not shown) after which T2* mapping was repeated. The following imaging parameters were used: T2-mapping: 2D RARE: TR 3000 ms, TE 8, 16, 24, 32, 40, 56, 64, 72 ms, NEX 1, FOV 25.6×25.6 mm2, 0.5 mm slice thickness, 20 coronal slices, matrix 128×128; stimulated-echo diffusion: TR 3000 ms, TE 8.5 ms, maximum diffusion gradient 37 G/cm, δ/Δ 1/136 ms, b-values (310, 407, 607, 904, 1207) NEX 1, FOV 25.6×25.6 mm2, 0.5 mm slice thickness, 20 slices, matrix 128×64 (zero filled to 128); T2* multi-gradient-echo: TR 50 ms, TE 1.8, 4.3, 6.8, 9.3, 14.3, 16.8, 19.3 ms, FA 12°, FOV 25.6×25.6×10 mm3, matrix 213×213×83 (120 μm isotropic), NEX 1; DCE: 3D-gradient echo, FOV 25.6×25.6×10 mm3, Matrix 128×128×20 (0.5 mm slice thickness), TR 5 ms, TE 1.2 ms, FA 2° and 10° pre-contrast, tail vein infusion of 80 μl Gadolinium DTPA (Magnevist, Bayer) 0.5 M (1.6 μmol Gadolinium/g body weight), acquisition of 170 data sets with FA 10° (approx. 18 min). Total imaging time per mouse was roughly 1 hour 40 minutes (including 10 minutes wait time after MPIO infusion).
MRI Data Analysis
Multispectral tissue classification and DCE analysis were performed as previously described [30], [31]. Briefly; proton density, T2 and ADC maps were used for k-means classification into four tissue classes: viable tumor tissue, sub-cutaneous adipose tissue, a low-T2 necrotic class (necrosis 1) and a high-ADC necrotic class (necrosis 2). The low-T2 necrotic class represents active or recent hemorrhage, and the high-ADC necrotic class has been found to represent an acellular, “cyst-like” regions [31]. A Tofts model was fitted to DCE data to calculate vascular parametric maps [30]. Post-MPIO T2* volumes were registered to pre-contrast T2* volumes using the transformation matrix from registering first-echo image volumes (TE 1.8 ms). Following registration, voxel-based changes in T2* were calculated. Registered image volumes were also used to estimate hypointense volumes. Images were corrected for decreasing sensitivity of the receive array in the slice direction followed by global Otsu thresholding on images with an echo time of 6.8 ms. Multispectral tissue class maps were used as segmentation masks for T2* change and hypointensity maps to limit the analysis to viable tumor tissue.
Immunohistochemistry and Histological Methods
Tumor bearing mice were injected with 100 μl of saline containing 1 mg/ml biotinylated tomato lectin (B-1175, Vector Laboratory, CA) via lateral tail veins. Mice were anesthetized with isoflurane (Henry Schein, NY) 15 minutes after lectin injections, the tips of right atria were cut off and mice were perfused (5 ml/min) with 20 ml cold PBS followed by 15 ml cold PBS containing 4% paraformaldehyde (PFA) through a 25G butterfly needle inserted into the left ventricle. Excised tumors were fixed overnight at 4 °C in PBS with 4% PFA, transferred into 30% sucrose in PBS, and kept at 4 °C until equilibrated (2–3 days). Tumors were embedded in optimum cutting temperature compound (OCT, Sakura Feintek, CA) and frozen in hexane containing dry ice. Tumors were aligned in cryomolds to match the imaging slice orientations. Tumor sections were cut (30 μm thickness) with a cryostat (Leica, Germany) collected on glass slides, dried and stored at −20 °C. Coronal center slices of tumors were used for staining.
Immunofluorescence: Sections were equilibrated to room temperature, washed twice 10 min with PBS, permeabilized with 2% Triton-X (Sigma) in PBS for 1 hour at room temperature followed by incubation in blocking solution (5% donkey serum in PBS+ 0.1% Tween-20, + 0.5% Triton-X, Sigma) for 1 hour. Sections were incubated with primary antibodies (see Table 2) diluted in blocking solution overnight at 4 °C in a humidified chamber. After washing three times for 15 minutes with PBS+ 0.1% Tween-20, sections were incubated with secondary antibodies diluted in blocking solution for 1 hour at room temperature in a humidified chamber. Secondary antibody staining was followed by a final washing step (three times, 15 min). Glass slides were covered with cover slides using self-hardening mounting media. Confocal microscopy was performed using a Nikon A1 microscope (Nikon, Japan). Stitched images covering entire tumor cross-sections were acquired using a 20× air objective (0.61×0.61 μm, in-plane resolution).
Table 2.
List of antibodies
| Antibody/Agent | Dilution | Vendor | Order no. |
|---|---|---|---|
| Donkey secondary antibodies | 1:400 | Jackson Immunoresearch | |
| Streptavidin | 1:600 | Vector laboratories | SA-5649 |
| Endomucin | 1:400 | R&D Systems | AF4666 |
| F4/80 | 1:200 | AbD SeroTec | MCA497G |
| CD3 | 1:100 | BD Biosciences | 553308 |
| α Smooth muscle actin | 1:400 | Sigma | C6198 |
| VCAM-1 | 1:100 | BD Biosciences | 553330 |
| MPIO conjugation | |||
| VCAM-1 | BD Biosciences | 553330 | |
| IgG⁎,& | BD Biosciences | 553927 | |
| Blocking T-cell binding | |||
| CD49d#,& | BD Biosciences | 553313 | |
| CD49d#,& | BD Biosciences | 553154 | |
| CD49d | eBiosciences | 16–0492-82 | |
| VCAM-1 | GeneTex | GTX14360 | |
| VCAM-1 | eBiosciences | 16–0492-82 | |
| VCAM-1& | BD Biosciences | 553330 | |
| CD54 | Invitrogen | 16–0541-81 | |
| ICAM | R&D Systems | AF796 | |
| CD18#,& | BD Biosciences | 557440 | |
IgG antibodies used for in vivo blocking experiments, #In vivo blocking CD18/CD49d antibody mixture, &Antibodies used for Figure 4.
Microscopy Image Analysis
Confocal microscopy: To reduce image noise, image guided filtering (Matlab) was used with the following parameters (Neighborhood size 3, 6, 3, 3, 3, 3, 4, 4, respectively, for DAPI, Lectin, CD3, tdTomato, a-SMA, NG2, F4/80, VCAM-1). For vessel detection (endomucin/lectin), thresholds were followed by watershed segmentation (Matlab) to separate touching vessels and removal of filled areas <33 μm2 and >8000 μm2. Vessel density was expressed as vessels/mm2 based on centroid positions of detected vessels. Vessel maps were dilated (disk with 6-pixel radius) and overlaid on smooth muscle actin (SMA), NG2 and VCAM-1 staining's to define vessel associated SMA, NG2 and VCAM-1. To estimate T-cell and macrophage density, thresholded objects within single cell size range (>100 <1000 pixels) were classified as individual cells. For larger objects, cell nuclei were detected based on watershed segmentation of corresponding DAPI images. Detected nuclei were classified as positively stained cells. To reduce data requirements, parametric maps were resized to 50×50 μm.
Confocal data registration: Manual regions of interest (ROIs) were drawn on parametric confocal maps to remove non-tumor tissue (skin). Appropriate slices for registration to 3D MRI data were selected by matching ROI area with multispectral classification-based tumor area of individual imaging slices. Confocal images and derived maps were automatically registered with affine transformations (translation, rotation and scale) to MRI data (T2 maps) using corresponding DAPI density maps from lectin stained slides. Mattes mutual information was used as registration metric for automatic registration implemented in Matlab. Since DAPI density is primarily and indicator of cell density, tumor shape and the extend and shape of necrotic areas were major determinants for the registration of confocal microscopy derived maps to MRI data. All subsequent confocal parametric maps were registered by matching their DAPI maps to the registered lectin DAPI map.
Statistical Analysis
Results are shown as mean ± SD unless stated otherwise. One-way analysis of variance (ANOVA) was performed to assess differences in specific uptake of PET tracers or differences between treatment groups. Wilcoxon rank-sum tests were used to determine differences between IgG and VCAM-1 groups for different tumor models or IgG and CD18/CD49d groups for blocking experiments. Linear regressions were used to evaluate correlations between different parameters. A Dixon outlier test was used which led to the removal of one data point for the EL4 T-cell density vs. VCAM density regression. To visualize correlations between different MRI derived parameters and tumor volume change following PD-L1 treatment a correlation matrix was plotted using the corrgram library. Multiple linear regression analysis was performed to test correlations between these parameters. Statistical analysis was performed using R software version 3.2.4. The following significance levels were used *P < .05, **P < .01, ***P < .001.
Results
VCAM-MPIO Showed Fast Tumor Uptake
We conjugated VCAM-1 antibodies to a chelator and microparticles of iron oxide (MPIO) to generate a contrast agent suitable for PET and MRI imaging. In vitro experiments showed strong binding of VCAM-MPIO to naïve and tumor necrosis factor alpha (TNF) stimulated murine endothelial cells with low binding of control IgG-MPIO (Supplementary Figure S2, A–C). Furthermore, no differences were observed for VCAM-MPIO binding to stimulated murine endothelial cells regardless if antibodies were conjugated with chelators or not (Supplementary Figure S2D), indicating that chelation did not alter binding affinities. Following initial in vitro characterization, dynamic PET imaging was performed in mice bearing EL4 tumors which have high vascular VCAM-1 expression. While IgG-MPIO accumulated primarily in the liver and spleen, VCAM-MPIO showed high uptake in liver, bone marrow, lymph nodes and tumors (Figure 1 A,B). VCAM- and IgG-MPIO had a fast distribution phase leading to stable blood and tumor concentrations 5 minutes after particle administration (Figure 1, C and D). VCAM-MPIO uptake in tumors reached 3.0 ± 1.0% of the injected dose while control IgG-MPIO uptake was 0.4 ± 0.1% 5 minutes after injection, demonstrating high specificity for the inflamed tumor vasculature (Figure 1E). Multi-compartment PET kinetic modeling results were consistent with fast tissue distribution, slow overall clearance and strong tumor binding of VCAM-MPIO (Supplementary Figure S2E, Table 1). The high tumor uptake and the fast distribution kinetic indicate that VCAM-MPIO are well suited for MRI after a wait period of 5–10 minutes outside of the MRI scanner following particle injection. Microparticles of iron oxide (MPIO, 1 μm diameter) offer larger T2 and T2* changes compared to nanometer sized particles. However, their large magnetic moments causes aggregation at high concentration in the presence of strong magnetic fields [32]. To prevent this, MPIO need to be injected outside of the strong magnetic field present in MRI systems. MRI can be performed after particles have been diluted in the blood and bound to their targets. Having demonstrated the suitability of VCAM-MPIO to detect inflammation in the tumor vasculature using PET, we next decided to test if the amount of VCAM-MPIO bound in tumors would generate sufficient MRI contrast for quantification.
Figure 1.
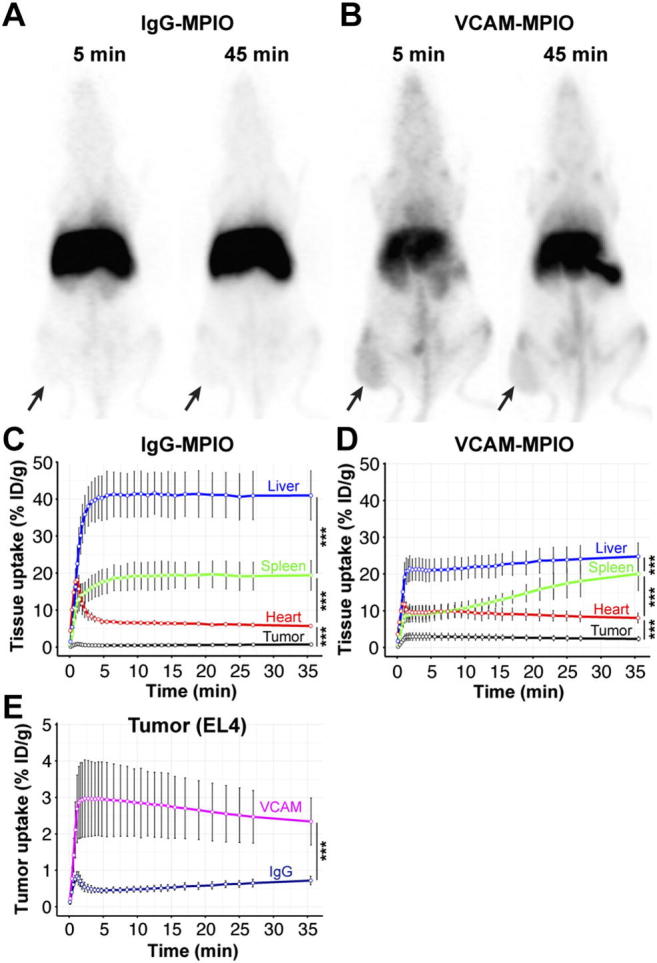
VCAM-MPIO showed tumor uptake and a fast distribution phase. (A) Maximum intensity projection of PET data 5 and 45 minutes after infusion of 68Ga-IgG-MPIO control particles. Particles accumulated in the liver and spleen without appreciable uptake in EL4 tumors (black arrows) (B) Maximum intensity projection 5 and 45 minutes after 68Ga-VCAM-MPIO particle infusion showed high uptake in the liver, spleen, and lymph nodes in EL4 tumors. (C) Quantification of specific uptake in liver, spleen, tumor, and heart (surrogate for blood pool) during the first 45 minutes following 68Ga-IgG-MPIO (n = 4 mice) or (D)68Ga-VCAM-MPIO (n = 6 mice) infusion. (E) VCAM-MPIO showed tumor specific uptake (3% ID/g) while IgG-MPIO increased initially but returned to less than 0.5% ID/g 5 minutes after infusion. ***P < .01 one-way-ANOVA. Data are shown as mean ± SD.
Table 1.
Fitted kinetic parameters. CL, CLd, V1 and V2 are standard pharmacokinetic parameters representing systemic clearance, distribution clearance, central distribution volume and peripheral distribution volume, respectively. While k1 and k2 represent nonspecific distribution kinetics within tumor, k3 and k4 represent approximately linear target-specific kinetics, e.g., binding/dissociation, as described by Innis et al. [29]
| CL (ml/min) | CLd (ml/min) | V1 (ml) | V2 (ml) | k1 (1/min) | k2 (1/min) | k3 (1/min) | k4 (1/min) | k_heart (1/min) | |
|---|---|---|---|---|---|---|---|---|---|
| VCAM-MPIO | 0.06 ± 0.03 | 5.0 ± 2.7 | 5.1 ± 1.5 | 4.9 ± 1.7 | 1.7 ± 2.2 | 185 ± 236 | 18.1 ± 15.3 | 1.8 ± 2.1 | 1.8 ± 0.6 |
| IgG-MPIO | 0.06 ± 0.03 | 2.9 ± 0.9 | 2.7 ± 0.4 | 11.6 ± 0.4 | 0.2 ± 0.1 | 14 ± 10 | 0.05 ± 0.004 | 0.01 ± 0.002 | 1.4 ± 0. 3 |
VCAM-MPIO Binding Led to Strong MRI Contrast Changes
Control IgG-MPIO administration led to minimal changes in the number and distribution of hypointense (black) voxels between pre- and post-contrast T2* weighted images highlighting low nonspecific binding in line with our PET data (Figure 2, A and B). In contrast, VCAM-MPIO injection led to a substantial increase in the number of hypointense voxels in most areas of EL4 tumors (Figure 2, C and D). However, VCAM-MPIO injection into mice with B16F10 tumors did not visibly increase hypointense areas (Figure 2, E and F). This was expected since B16F10 tumors have low vascular VCAM-1 expression (Supplementary Figure 1A). These experiments showed that VCAM-MPIO generate strong contrast changes on T2* weighted images of tumors with high VCAM-1 expression. We therefore decided to test if VCAM-MPIO binding correlates with T-cell infiltration.
Figure 2.

Contrast change following VCAM-MPIO administration in EL4 and B16F10 tumors. (A,B) Infusion of control IgG-MPIO did not visibly change the number of hypointense spots on T2* weighted images (TE = 6.8 ms). Images depict central slices of EL4 tumors grown on the hindleg of mice. Post contrast acquisitions started 10 minutes after VCAM-MPIO administration and were completed 15 minutes thereafter. (C,D) Infusion of VCAM-MPIO led to a significant increase in hypointense voxels throughout tumor cross-sections. Poorly perfused areas of EL4 tumors showed frequently less contrast change. (E,F) B16F10 tumors, which are well perfused, showed no significant contrast change following VCAM-MPIO administration indicating low vascular VCAM-1 density. Hair removal had been performed prior to ultrasound and MRI imaging on all tumors used for this figure.
VCAM-MPIO Binding and Tumor Perfusion Correlate with T-Cell Infiltration
To assess if VCAM-MPIO binding and tumor perfusion may correlate with T-cell infiltration, imaging experiments were performed before and 4 days after adoptive T-cell transfer in two well perfused tumor models B16F10 and EL4 [33]. Additional imaging experiments were performed in a tumor model with an under-perfused core which develops central necrosis (CT26) without T-cell transfer on day 15 and 19 after inoculation. We confined our analysis to the viable tumor tissue based on multispectral tissue classification to avoid biasing results through differences in the amount and behavior of necrotic tissues in different tumor models. While T2* change or hypointense volume change in viable tumor tissue (post-MPIO – pre-MPIO) were not significantly different between control IgG- and VCAM-MPIO groups in B16F10 tumors, a substantial decrease in T2* and increase in hypointense volume was found following VCAM-MPIO administration in mice with EL4 tumors (Figure 3, A and B). Similarly, CT26 tumors showed a significant increase in viable tumor tissue hypointense volume following VCAM-MPIO administration, but T2* changes were not significant (Figure 3C). Representative tissue class maps, k-trans, hypointense volume change, VCAM-1 density (histology) and T-cell density (histology) maps are shown in Figure 3, D–F with additional parametric maps in the supplementary material (Supplementary Figure S3–5).
Figure 3.

VCAM-MPIO binding correlated with T-cell infiltration in some preclinical tumor models. (A) T2* changes and hypointense volume changes were not significantly different between IgG-MPIO (n = 8) and VCAM-MPIO (n = 11) groups in well perfused B16F10 tumors. (B) VCAM-MPIO administration (n = 16) led to a significant reduction in T2* and increase in hypointense volume compared to the IgG-MPIO group (n = 8, P < .001, P < .001) in EL4 tumors. (C) VCAM-MPIO (n = 10) infusion did not significantly reduce T2* compared to IgG-MPIO (n = 8) in CT26 tumors. However, hypointense volume changes were significantly different between groups (P < .001). (D) Representative parametric maps of a B16F10 tumor showing necrotic areas throughout tumor cross-sections interspersed with viable tissue. K-trans maps show high perfusion and permeability through most of the tumor. But the number of hypointense voxels did not increase following VCAM-MPIO administration. Hypointense voxels were determined by automatic threshold and are shown as white voxels (positive contrast). This was corroborated by low vascular VCAM-1 and T-cell density (adoptively transferred T-cells, tdTomato positive) on histological slides. (E) EL4 tumor cross-section showing a tumor consisting primarily of viable tissue with uniform k-trans (perfusion and permeability) and demonstrated a substantial increase in hypointense voxel density following VCAM-MPIO infusion. Hypointense voxels were determined by automatic threshold and are shown as white voxels (positive contrast). Histological maps confirmed vascular VCAM-1 expression and T-cell infiltration (adoptively transferred T-cells, tdTomato positive) in areas with hypointensity changes. (F) Example of a CT26 tumor consisting primarily of viable tissue with high perfusion and permeability rates (high k-trans). However, the number of hypointense voxels increased primarily in the tumor rim in line with areas of high vascular VCAM-1 expression and T-cell infiltration (endogenous T-cells, CD3 staining). (G-I) Hypointense volume changes following VCAM-MPIO infusion, k-trans and VCAM-1 density did not correlate with T-cell infiltration in B16F10 tumors 4 days after adoptive T-cell transfer. (r = 0.16, P = .55; r = 0.32, P = .91; r = 0.48, P = .20; n = 5). (J) No correlation was observed between T-cell infiltration and Hypointense volume change 4 days after adoptive T-cell transfer in EL4 tumors (r = 0.21, P = .73, n = 6). (K-L) K-trans and VCAM-1 density were positively correlated with T-cell density 4 days after adoptive transfer in EL4 tumors (r = 0.84, P = .03; r = 0.65, P = .05; n = 6, n = 5). (M) In CT26 tumors, correlations between T-cell density (endogenous T-cells) and hypointense volume changes were not statistically significant (r = 0.57, P = .07, n = 6). (N) T-cell density and tumor perfusion/permeability (k-trans) were correlated in CT26 tumors (r = 0.64, P = .05, n = 6) 19 days after tumor inoculation. (O) Histological quantification showed a strong correlation between vascular VCAM-1 expression and T-cell density (r = 0.79, P = .02, n = 6). Hair removal had been performed prior to ultrasound and MRI imaging on all tumors used for this figure.
The density of adoptively transferred T-cells in tumors did not correlate with hypointense volume changes (VCAM-MPIO binding, r = 0.16, P = .55), tumor perfusion as assessed by k-trans (a measure of vascular perfusion and permeability, r = 0.32, P = .91) or VCAM-1 density (r = 0.48, P = .20) in B16F10 tumors (Figure 3, G–I). Although T-cell density was not correlated with hypointense volume change in EL4 tumors (r = 0.21, P = .73), T-cell density did correlate with k-trans and VCAM-1 density 4 days after adoptive T-cell transfer (r = 0.84, P = .03; r = 0.65, P = .05, Figure 3, J–L).
Adoptive T-cell transfer was not performed in mice with CT26 tumors due to the different strain used for T-cell isolation which would lead to T-cell rejection. Instead endogenous T-cell density was measured for experiments involving CT26 tumors. T-cell density and hypointense volume changes exhibited a strong trend toward a positive correlation 19 days after CT26 tumor inoculation (r = 0.57, P = .07, Figure 3M). Furthermore, T-cell density was positively correlated with k-trans (r = 0.64, P = .05; Figure 3N). In line with these in vivo correlates, histologically determined VCAM-1 density correlated strongly with T-cell density in CT26 tumors (r = 0.79, P = .02; Figure 3O). Histological estimates of VCAM-1 density were limited to vascular associated VCAM-1 expression since some tumor cells also express high levels of VCAM-1 (Supplemental Figure S1). These experiments demonstrated that T-cell densities correlate with vascular VCAM-1 density and k-trans (tumor perfusion and permeability) in EL4 and CT26 tumor models indicating the relevance of a permissible vascular bed for T-cell infiltration. To verify this observation, we decided to block T-cell binding to cell adhesion molecules on endothelial cells.
Blocking T-Cell Binding to Endothelial Cells Prevents Tumor Rejection
Since T-cell density in tumors was correlated with VCAM-1 expression in EL4 and CT26 tumors, we decided to block T-cell binding to cell adhesion molecules on endothelial cells, to test if that could prevent rejection of ovalbumin expressing tumor cells (E.G7) by ovalbumin specific OTI T-cells. Antibodies which might block T-cell binding to endothelial cells were tested in parallel plate flow chambers with video recording of T-cell binding. We found a strong reduction in T-cell retention for CD49d (integrin-α4, a VCAM-1 binding partner) antibodies and CD18 (integrin-β2, an ICAM binding partner) antibodies. A combination of these antibodies led to 82% reduction in T-cell retention on stimulated endothelial cells exposed to 5 dyn/cm2 shear stress for 2 minutes (Figure 4A). In order to ensure strong binding between endothelial and T-cells, murine endothelial cells were stimulated with 30 ng/ml TNF, which increased VCAM-1 and ICAM expression 10–15-fold without effecting viability (Supplemental Figure S6, A and B).
Figure 4.

Blocking T-cell binding to endothelial cells, prevented tumor rejection in an adoptive transfer model. (A) T-cell retention on stimulated endothelial cells experiencing 5 dyn/cm2 shear stress was measured using parallel plate flow chambers. Incubating endothelial cells with VCAM-1 antibodies prior to T-cell binding experiments reduced T-cell retention significantly (P < .05, n = 4). Incubation with CD49d or CD18 antibodies led to significant reductions in cell retention compared to VCAM-1 and CD49d respectively (P < .05, P < .001, n = 4). Combining CD18 and CD49d reduced T-cell retention further compared to CD18 alone (P < .01, n = 4) (B) Ten million activated CD8+ OTI (OVA specific) T-cells were adoptively transferred into each NSG mouse with an E.G7-OVA tumor growing on their right hind leg. Ultrasound-based tumor volume measurements showed no differences between IgG and CD18/CD49d groups 2 days after adoptive T-cell transfer. However, 4 days later tumor volumes were significantly different (P < .001, n = 6/group). (C) MRI based multispectral tissue classification found significant differences in viable tumor volumes 3 days (P < .01, n = 6/group) after T-cell transfer which did increased further by day seven (P < .001). (D) Differences between IgG and CD18/CD49d groups were more pronounced when viable tumor tissue was normalized to tumor volume. (E) Tumor perfusion and permeability (k-trans) was not significantly different between IgG and CD18/CD49d groups 3 days after adoptive T-cell transfer. (F) The extracellular extravascular volume fraction of viable tumor tissue was significantly different between IgG and CD18/CD49 groups (P < .001, n = 6/group) 3 days after T-cell transfer. (G,H) Plasma volume (vp) and hypointense volume changes were not different between groups 3 days after T-cell transfer in viable tumor tissue. (I) The extracellular extravascular volume fraction in viable tumor tissue increased significantly during T-cell mediated tumor rejection (IgG group) while exponentially growing tumors (CD18/CD49d group) showed a slight decrease in ve (n = 6/group, P < .001). (J,K) While histological assessment of vascular VCAM-1 density did not show significant differences between IgG and CD18/CD49d groups, T-cell density was significantly different 3 days after T-cell transfer (P < .001, n = 6/group). T-cell density in the IgG group increased >10-fold between day three and seven post T-cell transfer. (L,M) Representative confocal microscopy images showing T-cell accumulation around perfused vessels in the IgG group by day 11 (3 days after T-cell transfer) with few T-cells in tumors of mice treated with CD18/CD49d antibodies. Four days later, tumors of IgG treated animals contained only small areas of viable tumor cells surrounded and infiltrated by large amounts of T-cells. T-cell density in CD18/CD49d treated mice had increased marginally at day 15. DAPI: 4′,6-Diamidino-2-Phenylindole, E.G7-OVA: GFP expressing E.G7 tumor line, OTI T-cells: tdTomato expressing OTI (OVA specific) T-cells, Lectin: perfused vessel. Scale bars: 100 μm. Data shown as mean ± SD. Hair removal had been performed prior to ultrasound and MRI imaging on all tumors used for this figure.
The selected CD18/CD49d antibody mixture or IgG control antibodies were administered shortly after adoptive transfer of OTI T-cells into mice with E.G7-OVA tumors. Antibody administration was repeated 3 days after adoptive transfer. Ultrasound-based tumor volume measurements failed to detect tumor volume differences 2 days after T-cell transfer and antibody administration. FACS sorting of blood samples confirmed that antibodies did not affect circulating T-cell concentrations (Supplementary Figure S6C). However, 6 days after T-cell transfer, tumors in the IgG group had regressed while tumors in the CD18/CD49d group continued to grow exponentially (Figure 4B). MRI-based multispectral tissue classification did not detect any differences in viable tumor volume at the day of T-cell transfer, but 3 days later, viable tumor volumes were significantly different between IgG and CD18/CD49d groups (P < .01). One week after T-cell transfer viable tumor volumes had regressed to 21 ± 14 mm3 in the IgG group compared to 937 ± 217 mm3 in the CD18/Cd49d group (P < .001, Figure 4C). These differences were even more pronounced when viable tumor tissue was expressed as viable tissue fraction (P < .001, Figure 4D).
We next assessed which imaging biomarker might be an early marker for T-cell mediated tumor rejection. Although tumor volume, k-trans, plasma volume (vp) and hypointense volume changes were not different between IgG and CD18/CD49d groups 3 days after T-cell transfer, the extra cellular extra vascular volume fraction (ve) had increased significantly in tumors undergoing rejection (P < .001, Figure 4, E–H). The extra cellular volume fraction decreased slightly in exponentially growing tumors while increasing substantially and remaining high during active tumor rejection (Figure 4I). Tumor perfusion and permeability (k-trans) differences between growing tumors and tumors undergoing rejection became significant 7 days after T-cell transfer when tumor volumes had declined substantially (P < .05, Supplementary Figure S6, D and E). Histological assessment of vascular VCAM-1 expression showed slight increases in tumors undergoing rejection, however these differences were not statistically significant. But T-cell density was significantly different between IgG and CD18/CD49d groups 3 days after T-cell transfer and increased further by day seven (P < .001, Figure 4, J and L). Confocal microscopy showed T-cell accumulation around tumor vessels 3 days after adoptive transfer and T-cell spreading throughout the tumor by day seven in the IgG group. In contrast, few T-cells were detected in tumors of mice treated with CD18/CD49d antibodies (Figure 4, L and M; Supplementary Figure S7). These experiments showed that blocking T-cell/endothelial cell interaction prevents tumor rejection by adoptively transferred tumor specific T-cells. Furthermore, we identified ve as an early response biomarker for T-cell mediated tumor rejection. Since vascular VCAM-1 and k-trans were correlated with T-cell infiltration at least in some tumor models, we decided to assess if k-trans and vascular inflammation could predict treatment response to an immune checkpoint inhibitor.
Tumor Perfusion and VCAM-MPIO Binding at Baseline Predict Response to PD-L1 Treatment
In order to assess if non-invasive imaging could predict checkpoint blockade response, mice were inoculated with MC38 tumor cells and assigned to Control (n = 10), PD-L1 (n = 10) and PD-L1 imaging (PD-L1 + depilatory cream, n = 21) groups after tumor volumes had reached 150–250 mm3. While control tumors continued to grow exponentially, PD-L1 treatment led to significant growth inhibition displaying a bimodal response with 40% of animals showing tumor growth inhibition while the rest continued to grow slowly (Figure 5, A and B). Our imaging experiments required hair removal which may have contributed to the effect of PD-L1 based tumor growth inhibition (Figure 5, C and D).
Figure 5.

VCAM-MPIO binding and tumor perfusion predict response to PD-L1 treatment. (A) Control (vehicle treated) MC38 tumors continued to grow exponentially between day 18 and 31. The dark blue line shows group means and SE (n = 10) (B) PD-L1 administration every 3 days (black arrows) led to substantial tumor growth inhibition with 60% of tumors growing slower than control and the remaining tumors failing to grow (n = 10). (C) Hair removal with a depilatory cream was performed prior to MRI which may have acted synergistically with PD-L1 based tumor growth inhibition (n = 20). (D) Control, PD-L1 and PD-L1 + depilatory cream groups were significantly different from each other (one-way ANOVA, P < .001). (E) Illustration of correlations between different MRI-derived parameters and tumor volume change. The following parameters are shown; Vol: tumor volume before treatment initiation, vV: viable tumor volume, N1: necrosis volume type 1, N2: necrosis volume type 2, Fat: fat volume, M0: initial magnetization viable tumor tissue, T2: T2 relaxation rate viable tumor tissue, AD: apparent diffusion coefficient viable tumor tissue, Kt: DCE-derived perfusion and permeability constant k-trans of viable tumor tissue, Ve: DCE-derived extracellular extravascular volume fraction in viable tumor tissue, Vp: DCE-derived plasma volume fraction in viable tumor tissue, T2*: change in T2* relaxation rates in viable tumor tissue following VCAM-MPIO administration, HV: hypointense volume change in viable tumor tissue following VCAM-MPIO administration, dV: change in tumor volume following 2 weeks of PD-L1 treatment. (F) Hypointense volume change following VCAM-MPIO administration at baseline was not significantly correlated with tumor volume change over 2 weeks of treatment (r = 0.20, P = .08, n = 17). (F-I) Similarly, Tumor volume change over 2 weeks of treatment was not significantly correlated with tumor k-trans, ve or vp prior to treatment start (r = 0.18, P = .09, r = 0.18, P = .1, r = 0.22, P = .07, n = 17). Data shown as mean ± SE. Tumor volumes were measured using calipers: Figure A and B (no hair removal), while caliper measurements and MRI was used for Figure C (hair removal with a depilatory cream).
We next set out to assess if any of our imaging biomarkers could predict changes in tumor volume in the PD-L1 imaging group. A correlation plot showed that DCE-derived vascular parameters and hypointense volume change following VCAM-MPIO administration were negatively correlated with tumor volume change (Figure 5E). Although correlations between tumor volume change (over 2 weeks of treatment) and baseline k-trans (tumor perfusion and permeability, r = 0.19, P = .09), Vp (plasma fraction r = 0.22, P = .07) as well as VCAM-MPIO binding (Hypointense volume change, r = 0.20, P = .08, Figure 5, F–I) were not significant. Multiple linear regression showed that tumor volume change over 2 weeks of treatment could be predicted by the baseline measurement of k-trans and hypointense volume change following VCAM-MPIO administration (r = 0.36, P = .05) or Vp and hypointense volume change (r = 0.37, P = .05). This indicates that VCAM-MPIO and k-trans or Vp can at least partially predict treatment response for PD-L1 blockade in a preclinical tumor model. Combining other parameters such as tumor volume and necrosis type 2 volume prior to treatment start (Figure 5, J and K) with perfusion or VCAM binding parameters did not increase their associations with tumor volume change.
Discussion
We aimed to test if non-invasive MRI-based assessment of tumor perfusion and vascular VCAM-1 density could function as biomarkers for T-cell infiltration and treatment response in cancer immunotherapy models. Dynamic contrast enhancement MRI was used to assess tumor perfusion and permeability (k-trans) while VCAM-1 antibodies conjugated to MPIO were used to measure vascular VCAM-1 density in-vivo. Large iron oxide particles (1 μm diameter) offer strong contrast changes and high sensitivity on T2* weighted MR images. Furthermore, the size of these particles prevents their extravasation into the tumor parenchyma limiting particle binding to intravascular targets. However, these particles can aggregate at high concentration in the presence of strong magnetic fields [32]. To circumvent this problem, previous studies have injected microparticles of iron oxide (MPIO) 30–45 minutes prior to imaging [26], [27]. This approach works well when baseline imaging is not required for organs with fairly homogenous T2* intensities such as the brain. But tumors are very heterogeneous and can have large T2* differences due to micro-hemorrhages necessitating baseline imaging. The concept of pre- and post-MPIO imaging has been demonstrated before for cyclic RGD targeted particles [34]. In order to understand MPIO kinetics, without biasing results through particle aggregation, PET imaging was performed. PET imaging and kinetic analysis showed VCAM-MPIO have a fast distribution phase reaching maximum contrast 5 minutes after administration followed by slow clearance enabling post-contrast imaging after a short wait period. A short blood half-life for VCAM-MPIO has been reported previously [35]. However, dynamic binding in inflamed organs or tumors has not been assessed previously. Tumor uptake reached 3% of injected dose within 5 minutes and did not change significantly over the next 45 minutes, indicating a long window suitable for post-MPIO imaging. Our PET study did not assess tumor viability, we could hence not assess if the specific uptake of viable tumor tissue was higher than the 3% estimated for the entire tumor volume.
Following kinetic assessment, we performed MRI in different tumor models to evaluate particle induced contrast changes. We observed strong increases in the number of hypointense voxels following VCAM-MPIO administration in EL4 tumors. The use of pre- and post-contrast images and parametric maps enables quantification in areas with existing hypointensities on T2*-weighted images. However, image registration errors may introduce additional sources of variation using this approach. Hypointense volume changes are less susceptible to registration errors and therefore more sensitive to VCAM-MPIO induced contrast changes compared to relative T2* changes in tumors with small areas of contrast agent binding such as CT26. Nonetheless, the utility of pre-contrast T2* maps became apparent when B16F10 tumors were imaged which present with variable degrees of micro hemorrhages.
We next wanted to assess if in vivo binding of VCAM-MPIO, as detected by MRI, might correlate with T-cell infiltration. To that end, adoptive T-cell transfer was performed in well perfused tumor models (EL4 and B16F10), with follow-up MRI 4 days after T-cell transfer. While VCAM-MPIO administration in EL4 tumors led to significant reductions in T2* and increases in hypointense voxels when compared to control, no changes were observed in B16F10 tumors. In contrast to small molecule contrast agents or PET imaging many hours after antibody tracer administration, the use of large particles restricts sampling to the inner wall of perfused vessels. We have previously shown that vascular density and T-cell density correlate strongly in a range of tumor models [33]. However, while k-trans, a measure of tumor perfusion and permeability, was correlated with T-cell density in EL4 tumors, no correlation was found for B16F10 tumors. This is likely due to the very low number of T-cells accumulating in B16F10 tumors. We used OTI T-cells for these experiments, which do not recognize EL4 or B16F10 tumors, in order to avoid confounding T-cell infiltration with cytotoxic effects. Similarly, T-cell density and VCAM-1 density were correlated in EL4 tumors while no correlations were found for B16F10 tumors, which also showed no change in T2* or hypointense volume following VCAM-MPIO administration. Although the importance of the vasculature for T-cell infiltration has been shown previously [21], [22], [25], the role of vascular VCAM-1 density for T-cell infiltration in tumors has not been quantified previously. Furthermore, the analysis of VCAM-1 expression needs to be limited to the vasculature since some tumor cells express high levels of VCAM-1, which has been reported previously [36]. Although a perfused vasculature expressing suitable adhesion molecules is required for T-cell infiltration additional factors are needed for efficient T-cell infiltration into the tumor parenchyma [37].
We also imaged VCAM-1 density in a different syngeneic tumor model (CT26) without T-cell transfer, to verify if these observations hold true for endogenous T-cells which had a longer time period to infiltrate the tumor parenchyma and the vasculature could have changed after T-cell infiltration. Hypointense volume changes following VCAM-MPIO administration demonstrated a strong trend toward being positively correlated with T-cell density in CT26 tumors. Moreover, k-trans and T-cell density were strongly correlated. These results indicated that an inflamed and perfused tumor vasculature may be required for T-cell infiltration in certain tumor models. As mentioned above, no correlations between T-cell density and any of the measured parameters were found for B16F10 tumors.
To verify the importance of vascular cell adhesion molecule expression for T-cell infiltration, we decided to block T-cell binding to endothelial cells using antibodies. We found strong reductions in the number of T-cells retained under high shear rates for CD49d and CD18 antibodies in agreement with previously published data [38], [39]. In vivo experiments with the combination of these antibodies administered shortly after adoptive T-cell transfer prevented T-cell mediated tumor rejection, highlighting the importance of T-cell/CD18-CD49d interaction for T-cell extravasation. The relative importance of VCAM-1 and ICAM for T-cell adhesion is dependent on the T-cell activation and endothelial stimulation state [40]. Clinically, natalizumab which binds to human α4-integrin (CD49d) has been shown to reduce T-cell infiltration in multiple sclerosis [41], but β2-integrin (CD18) blocking antibodies failed to demonstrate clinical benefits following myocardial infarctions [42]. For the purpose of this study VCAM-1 targeted MPIO were used to assess vascular inflammation leading to high levels of cell adhesion molecules on the surface of endothelial cells. Other adhesion molecules or combinations therefore could potentially be used as alternative markers for vascular inflammation.
The clinical development of cancer immunotherapies has demonstrated that conventional criteria for treatment success evaluation such as RECIST do not work well for this class of drugs [43]. We therefore tested if any of our MRI biomarkers could detect early treatment response 3 days after T-cell transfer when tumor volumes had not yet changed. Although multispectral tissue classification was able to differentiate between IgG and CD18/CD49d groups based on viable tumor volume 3 days after T-cell transfer, there was no difference between pre-treatment and 3 days post-treatment within each group. Hence, early treatment response could not be detected using multispectral tissue classification (which is primarily determined by T2 and ADC differences). However, the extracellular extravascular volume fraction (ve) did increase significantly 3 days after T-cell transfer in the IgG group (active tumor rejection). Therefore, ve might be a suitable early response biomarker for cancer immunotherapies. The high sensitivity of ve is probably due to localized effects of infiltrating T-cells around the vasculature which is corroborated by histological identification of T-cell accumulation around tumor vessels. T-cell mediated tumor cell killing around the vasculature is associated with an increase in ve, while overall cell death throughout the tumor parenchyma is too small to be detected via ADC increases at early stages of tumor rejection. Dynamic contrast enhancement has been used previously to assess E.G7 tumor regression. Increased vascular volumes were detected in regressing tumors 10 days after implantation but ve was not different [44]. These differences are likely a reflection of differences in tumor size at the time of imaging more comparable to 7 days post T-cell transfer in our model. Our findings are supported by a similar finding for adoptive NK cell immunotherapy in rats where ve was the most sensitive marker for early treatment response [45]. The clinical availability of DCE-MRI should facilitate the evaluation of ve as an early response biomarker for cancer immunotherapies. However, accurate measurement of DCE parameters in clinical settings can be challenging.
Given the correlations observed between tumor perfusion and VCAM-MPIO binding with T-cell infiltration in EL4 and CT26 tumors, we decided to test the predictive power of these markers in MC38 tumors undergoing PD-L1 treatment. PD-L1 treatment led to tumor growth inhibition in line with previous pre-clinical and clinical findings [3], [46]. Chemical hair removal was performed in the imaging group which appeared to have a synergistic effect with PD-L1. Localized inflammation following chemical hair removal has been reported before [47]. Although chronic inflammation is one of the hallmarks of cancer [48], inflammation increases blood flow and expression of cell adhesion molecules in the vasculature which can increase T-cell infiltration and may lead to vascular re-modeling [49].
Imaging tumor perfusion and vascular VCAM-1 density prior to treatment start might be predictive of treatment response over the following 2 weeks with PD-L1 treatment in MC38 tumors. Approximately one third of the variance in tumor volume change could be explained with the combination of pre-treatment k-trans and hypointense volume change following VCAM-MPIO administration indicating that additional factors are required to explain tumor growth under these conditions. The combination of hypointense volume change and plasma volume fraction (vp) or T2* change and k-trans showed similar associations with tumor volume change during PD-L1 treatment. Modeling responses with non-linear models might also be beneficial but would require more data. Nonetheless, the observed predictive power compares favorably to preclinical PET studies which could predict treatment response only several days after treatment initiation often at a time where tumor volumes were already divergent [11], [14], [15]. PET has a higher specific sensitivity compared to MRI. With new PET tracers for cancer immunotherapies currently under development, PET may offer a higher sensitivity to predict treatment response in the future. MPIO used in this study would not be suitable for clinical use as they are not biodegradable. However, the development of biodegradable MPIO with the potential for use in humans has been reported recently [50].
Overall, our study demonstrates that in-vivo imaging of tumor perfusion and vascular inflammation are correlated with infiltration of adoptively transferred and endogenous T-cells in some tumor models. Blocking T-cell binding to cell adhesion molecules on endothelial cells prevents tumor rejection in an adoptive transfer model using ovalbumin expressing tumor cells highlighting the importance of vascular adhesion molecules for T-cell infiltration. Furthermore, DCE-MRI derived extracellular extravascular volume fraction is a sensitive imaging marker that could detect early treatment response during T-cell mediated tumor rejection before any changes in tumor volume were detectable, indicating its potential utility for clinical trials. Finally, tumor perfusion (k-trans) and VCAM-1 imaging at baseline could explain some of the observed changes in tumor volume following PD-L1 treatment in a pre-clinical model functioning as a predictive biomarker.
Acknowledgement
We would like to thank all the members of the biomedical imaging department for helpful discussions.
Footnotes
Conflict of Interest statement: J.R. was an employee of Genentech Inc. H.G., A.O., M.H., V.J., J.O., G.Z.F., S.W., D.S., J.S., and R.A.D.C. are employees and shareholders of Genentech Inc.
Funding: This study was funded by Genentech Inc.
Supplementary data to this article can be found online at https://doi.org/10.1016/j.neo.2019.08.003.
Appendix A. Supplementary data
Supplementary figures
References
- 1.Dudley ME, Wunderlich JR, Robbins PF, Yang JC, Hwu P, Schwartzentruber DJ, Topalian SL, Sherry R, Restifo NP, Hubicki AM. Cancer regression and autoimmunity in patients after clonal repopulation with antitumor lymphocytes. Science. 2002;298(5594):850–854. doi: 10.1126/science.1076514. [DOI] [PMC free article] [PubMed] [Google Scholar]
- 2.Morgan RA, Dudley ME, Wunderlich JR, Hughes MS, Yang JC, Sherry RM, Royal RE, Topalian SL, Kammula US, Restifo NP. Cancer regression in patients after transfer of genetically engineered lymphocytes. Science. 2006;314(5796):126–129. doi: 10.1126/science.1129003. [DOI] [PMC free article] [PubMed] [Google Scholar]
- 3.Brahmer JR, Tykodi SS, Chow LQ, Hwu WJ, Topalian SL, Hwu P, Drake CG, Camacho LH, Kauh J, Odunsi K. Safety and activity of anti-PD-L1 antibody in patients with advanced cancer. N Engl J Med. 2012;366(26):2455–2465. doi: 10.1056/NEJMoa1200694. [DOI] [PMC free article] [PubMed] [Google Scholar]
- 4.Snyder A, Makarov V, Merghoub T, Yuan J, Zaretsky JM, Desrichard A, Walsh L.A, Postow MA, Wong P, Ho TS. Genetic basis for clinical response to CTLA-4 blockade in melanoma. N Engl J Med. 2014;371(23):2189–2199. doi: 10.1056/NEJMoa1406498. [DOI] [PMC free article] [PubMed] [Google Scholar]
- 5.Herbst RS, Baas P, Kim DW, Felip E, Perez-Gracia JL, Han JY, Molina J, Kim JH, Arvis CD, Ahn MJ. Pembrolizumab versus docetaxel for previously treated, PD-L1-positive, advanced non-small-cell lung cancer (KEYNOTE-010): a randomised controlled trial. Lancet. 2016;387(10027):1540–1550. doi: 10.1016/S0140-6736(15)01281-7. [DOI] [PubMed] [Google Scholar]
- 6.Galon J, Costes A, Sanchez-Cabo F, Kirilovsky A, Mlecnik B, Lagorce-Pages C, Tosolini M, Camus M, Berger A, Wind P. Type, density, and location of immune cells within human colorectal tumors predict clinical outcome. Science. 2006;313(5795):1960–1964. doi: 10.1126/science.1129139. [DOI] [PubMed] [Google Scholar]
- 7.Rizvi NA, Hellmann MD, Snyder A, Kvistborg P, Makarov V, Havel JJ, Lee W, Yuan J, Wong P, Ho TS. Cancer immunology. Mutational landscape determines sensitivity to PD-1 blockade in non-small cell lung cancer. Science. 2015;348(6230):124–128. doi: 10.1126/science.aaa1348. [DOI] [PMC free article] [PubMed] [Google Scholar]
- 8.Herbst RS, Soria JC, Kowanetz M, Fine GD, Hamid O, Gordon MS, Sosman JA, McDermott DF, Powderly JD, Gettinger SN. Predictive correlates of response to the anti-PD-L1 antibody MPDL3280A in cancer patients. Nature. 2014;515(7528):563–567. doi: 10.1038/nature14011. [DOI] [PMC free article] [PubMed] [Google Scholar]
- 9.Mariathasan S, Turley SJ, Nickles D, Castiglioni A, Yuen K, Wang Y, Kadel E.E., III, Koeppen H., Astarita J.L., Cubas R. TGFbeta attenuates tumour response to PD-L1 blockade by contributing to exclusion of T cells. Nature. 2018;554(7693):544–548. doi: 10.1038/nature25501. [DOI] [PMC free article] [PubMed] [Google Scholar]
- 10.Aerts HJ, Velazquez ER, Leijenaar RT, Parmar C, Grossmann P, Carvalho S, Bussink J, Monshouwer R., Haibe-Kains B, Rietveld D. Decoding tumour phenotype by noninvasive imaging using a quantitative radiomics approach. Nat Commun. 2014;5:4006. doi: 10.1038/ncomms5006. [DOI] [PMC free article] [PubMed] [Google Scholar]
- 11.Antonios JP, Soto H, Everson RG, Moughon DL, Wang AC, Orpilla J, Radu C, Ellingson BM, Lee JT, Cloughesy T. Detection of immune responses after immunotherapy in glioblastoma using PET and MRI. Proc Natl Acad Sci U S A. 2017;114(38):10220–10225. doi: 10.1073/pnas.1706689114. [DOI] [PMC free article] [PubMed] [Google Scholar]
- 12.deSouza NM, Riches SF, Vanas NJ, Morgan VA, Ashley SA, Fisher C, Payne GS, Parker C. Diffusion-weighted magnetic resonance imaging: a potential non-invasive marker of tumour aggressiveness in localized prostate cancer. Clin Radiol. 2008;63(7):774–782. doi: 10.1016/j.crad.2008.02.001. [DOI] [PubMed] [Google Scholar]
- 13.van der Veen EL, Bensch F, Glaudemans A, Lub-de Hooge MN, de Vries EGE. Molecular imaging to enlighten cancer immunotherapies and underlying involved processes. Cancer Treat Rev. 2018;70:232–244. doi: 10.1016/j.ctrv.2018.09.007. [DOI] [PubMed] [Google Scholar]
- 14.Tavare R, Escuin-Ordinas H, Mok S, McCracken MN, Zettlitz KA, Salazar FB, Witte ON, Ribas A, Wu AM. An effective immuno-PET imaging method to monitor CD8-dependent responses to immunotherapy. Cancer Res. 2016;76(1):73–82. doi: 10.1158/0008-5472.CAN-15-1707. [DOI] [PMC free article] [PubMed] [Google Scholar]
- 15.Rashidian M, Ingram JR, Dougan M, Dongre A, Whang KA, LeGall C, Cragnolini JJ, Bierie B, Gostissa M, Gorman J. Predicting the response to CTLA-4 blockade by longitudinal noninvasive monitoring of CD8 T cells. J Exp Med. 2017;214(8):2243–2255. doi: 10.1084/jem.20161950. [DOI] [PMC free article] [PubMed] [Google Scholar]
- 16.Alam IS, Mayer AT, Sagiv-Barfi I, Wang K, Vermesh O, Czerwinski DK, Johnson EM, James ML, Levy R, Gambhir SS. Imaging activated T cells predicts response to cancer vaccines. J Clin Invest. 2018;128(6):2569–2580. doi: 10.1172/JCI98509. [DOI] [PMC free article] [PubMed] [Google Scholar]
- 17.Griffioen AW, Damen CA, Martinotti S, Blijham GH, Groenewegen G. Endothelial intercellular adhesion molecule-1 expression is suppressed in human malignancies: the role of angiogenic factors. Cancer Res. 1996;56(5):1111–1117. [PubMed] [Google Scholar]
- 18.Piali L, Fichtel A, Terpe HJ, Imhof BA, Gisler RH. Endothelial vascular cell adhesion molecule 1 expression is suppressed by melanoma and carcinoma. J Exp Med. 1995;181(2):811–816. doi: 10.1084/jem.181.2.811. [DOI] [PMC free article] [PubMed] [Google Scholar]
- 19.Dirkx AE, oude Egbrink MG, Castermans K, van der Schaft DW, Thijssen VL, Dings RP, Kwee L, Mayo KH, Wagstaff J, Bouma-ter Steege JC. Anti-angiogenesis therapy can overcome endothelial cell anergy and promote leukocyte-endothelium interactions and infiltration in tumors. FASEB J. 2006;20(6):621–630. doi: 10.1096/fj.05-4493com. [DOI] [PubMed] [Google Scholar]
- 20.Johansson A, Hamzah J, Payne CJ, Ganss R. Tumor-targeted TNFalpha stabilizes tumor vessels and enhances active immunotherapy. Proc Natl Acad Sci U S A. 2012;109(20):7841–7846. doi: 10.1073/pnas.1118296109. [DOI] [PMC free article] [PubMed] [Google Scholar]
- 21.Shrimali RK, Yu Z, Theoret MR, Chinnasamy D, Restifo NP, Rosenberg SA. Antiangiogenic agents can increase lymphocyte infiltration into tumor and enhance the effectiveness of adoptive immunotherapy of cancer. Cancer Res. 2010;70(15):6171–6180. doi: 10.1158/0008-5472.CAN-10-0153. [DOI] [PMC free article] [PubMed] [Google Scholar]
- 22.Hamzah J, Jugold M, Kiessling F, Rigby P, Manzur M, Marti HH, Rabie T., Kaden S, Gröne HJ, Hämmerling GJ. Vascular normalization in Rgs5-deficient tumours promotes immune destruction. Nature. 2008;453(7193):410–414. doi: 10.1038/nature06868. [DOI] [PubMed] [Google Scholar]
- 23.Zhao Y, Ting KK, Li J, Cogger VC, Chen J, Johansson-Percival A, Ngiow SF, Holst J, Grau G, Goel S. Targeting vascular endothelial-cadherin in tumor-associated blood vessels promotes T-cell-mediated immunotherapy. Cancer Res. 2017;77(16):4434–4447. doi: 10.1158/0008-5472.CAN-16-3129. [DOI] [PubMed] [Google Scholar]
- 24.Melder RJ, Munn LL, Yamada S, Ohkubo C, Jain RK. Selectin- and integrin-mediated T-lymphocyte rolling and arrest on TNF-alpha-activated endothelium: augmentation by erythrocytes. Biophys J. 1995;69(5):2131–2138. doi: 10.1016/S0006-3495(95)80087-1. [DOI] [PMC free article] [PubMed] [Google Scholar]
- 25.Sabel MS, Skitzki J, Stoolman L, Egilmez NK, Mathiowitz E, Bailey N, Chang WJ, Chang AE. Intratumoral IL-12 and TNF-alpha-loaded microspheres lead to regression of breast cancer and systemic antitumor immunity. Ann Surg Oncol. 2004;11(2):147–156. doi: 10.1245/aso.2004.03.022. [DOI] [PubMed] [Google Scholar]
- 26.McAteer MA, Sibson NR, von Zur Muhlen C, Schneider JE, Lowe AS, Warrick N, Channon KM, Anthony DC, Choudhury RP. In vivo magnetic resonance imaging of acute brain inflammation using microparticles of iron oxide. Nat Med. 2007;13(10):1253–1258. doi: 10.1038/nm1631. [DOI] [PMC free article] [PubMed] [Google Scholar]
- 27.Akhtar AM, Schneider JE, Chapman SJ, Jefferson A, Digby JE, Mankia K, Chen Y, McAteer M.A., Wood KJ, Choudhury RP. In vivo quantification of VCAM-1 expression in renal ischemia reperfusion injury using non-invasive magnetic resonance molecular imaging. PLoS One. 2010;5(9) doi: 10.1371/journal.pone.0012800. [DOI] [PMC free article] [PubMed] [Google Scholar]
- 28.Serres S, Soto MS, Hamilton A, McAteer MA, Carbonell WS, Robson MD, Ansorge O, Khrapitchev A, Bristow C, Balathasan L, Ansorge O, Khrapitchev A, Bristow C, Balathasan L. Molecular MRI enables early and sensitive detection of brain metastases. Proc Natl Acad Sci U S A. 2012;109(17):6674–6679. doi: 10.1073/pnas.1117412109. [DOI] [PMC free article] [PubMed] [Google Scholar]
- 29.Innis RB, Cunningham VJ, Delforge J, Fujita M, Gjedde A, Gunn RN, Holden J, Houle S, Huang SC, Ichise M. Consensus nomenclature for in vivo imaging of reversibly binding radioligands. J Cereb Blood Flow Metab. 2007;27(9):1533–1539. doi: 10.1038/sj.jcbfm.9600493. [DOI] [PubMed] [Google Scholar]
- 30.Berry LR, Barck KH, Go MA, Ross J, Wu X, Williams SP, Gogineni A, Cole MJ, Van Bruggen N, Fuh G. Quantification of viable tumor microvascular characteristics by multispectral analysis. Magn Reson Med. 2008;60(1):64–72. doi: 10.1002/mrm.21470. [DOI] [PubMed] [Google Scholar]
- 31.Carano RA, Ross AL, Ross J, Williams SP, Koeppen H, Schwall RH, Van Bruggen N. Quantification of tumor tissue populations by multispectral analysis. Magn Reson Med. 2004;51(3):542–551. doi: 10.1002/mrm.10731. [DOI] [PubMed] [Google Scholar]
- 32.Helgesen G, Skjeltorp AT, Mors PM, Botet R, Jullien R. Aggregation of magnetic microspheres: Experiments and simulations. Phys Rev Lett. 1988;61(15):1736–1739. doi: 10.1103/PhysRevLett.61.1736. [DOI] [PubMed] [Google Scholar]
- 33.Riegler J, Labyed Y, Rosenzweig S, Javinal V, Castiglioni A, Dominguez CX, Long JE, Li Q, Sandoval W, Junttila MR. Tumor elastography and its association with collagen and the tumor microenvironment. Clin Cancer Res. 2018;24(18):4455–4467. doi: 10.1158/1078-0432.CCR-17-3262. [DOI] [PubMed] [Google Scholar]
- 34.Melemenidis S, Jefferson A, Ruparelia N, Akhtar AM, Xie J, Allen D, Hamilton A, Larkin JR, Perez-Balderas F, Smart SC. Molecular magnetic resonance imaging of angiogenesis in vivo using polyvalent cyclic RGD-iron oxide microparticle conjugates. Theranostics. 2015;5(5):515–529. doi: 10.7150/thno.10319. [DOI] [PMC free article] [PubMed] [Google Scholar]
- 35.Patel N, Duffy BA, Badar A, Lythgoe MF, Arstad E. Bimodal imaging of inflammation with SPECT/CT and MRI Using Iodine-125 Labeled VCAM-1 Targeting Microparticle Conjugates. Bioconjug Chem. 2015;26(8):1542–1549. doi: 10.1021/acs.bioconjchem.5b00380. [DOI] [PubMed] [Google Scholar]
- 36.Schlesinger M, Bendas G. Vascular cell adhesion molecule-1 (VCAM-1)--an increasing insight into its role in tumorigenicity and metastasis. Int J Cancer. 2015;136(11):2504–2514. doi: 10.1002/ijc.28927. [DOI] [PubMed] [Google Scholar]
- 37.Melero I, Rouzaut A, Motz GT, Coukos G. T-cell and NK-cell infiltration into solid tumors: a key limiting factor for efficacious cancer immunotherapy. Cancer Discov. 2014;4(5):522–526. doi: 10.1158/2159-8290.CD-13-0985. [DOI] [PMC free article] [PubMed] [Google Scholar]
- 38.Bonder CS, Norman MU, Swain MG, Zbytnuik LD, Yamanouchi J, Santamaria P, Ajuebor M, Salmi M, Jalkanen S, Kubes P. Rules of recruitment for Th1 and Th2 lymphocytes in inflamed liver: a role for alpha-4 integrin and vascular adhesion protein-1. Immunity. 2005;23(2):153–163. doi: 10.1016/j.immuni.2005.06.007. [DOI] [PubMed] [Google Scholar]
- 39.Jones DA, McIntire LV, Smith CW, Picker LJ. A two-step adhesion cascade for T cell/endothelial cell interactions under flow conditions. J Clin Invest. 1994;94(6):2443–2450. doi: 10.1172/JCI117612. [DOI] [PMC free article] [PubMed] [Google Scholar]
- 40.Shimizu Y, Newman W, Gopal TV, Horgan KJ, Graber N, Beall LD, van Seventer G.A., Shaw S. Four molecular pathways of T cell adhesion to endothelial cells: roles of LFA-1, VCAM-1, and ELAM-1 and changes in pathway hierarchy under different activation conditions. J Cell Biol. 1991;113(5):1203–1212. doi: 10.1083/jcb.113.5.1203. [DOI] [PMC free article] [PubMed] [Google Scholar]
- 41.Polman CH, O'Connor PW, Havrdova E, Hutchinson M, Kappos L, Miller DH, Phillips JT, Lublin FD, Giovannoni G, Wajgt A. A randomized, placebo-controlled trial of natalizumab for relapsing multiple sclerosis. N Engl J Med. 2006;354(9):899–910. doi: 10.1056/NEJMoa044397. [DOI] [PubMed] [Google Scholar]
- 42.Baran KW, Nguyen M, McKendall GR, Lambrew CT, Dykstra G, Palmeri ST, Gibbons R.J., Borzak S., Sobel B.E., Gourlay S.G. Double-blind, randomized trial of an anti-CD18 antibody in conjunction with recombinant tissue plasminogen activator for acute myocardial infarction: limitation of myocardial infarction following thrombolysis in acute myocardial infarction (LIMIT AMI) study. Circulation. 2001;104(23):2778–2783. doi: 10.1161/hc4801.100236. [DOI] [PubMed] [Google Scholar]
- 43.Chiou VL, Burotto M. Pseudoprogression and immune-related response in solid tumors. J Clin Oncol. 2015;33(31):3541–3543. doi: 10.1200/JCO.2015.61.6870. [DOI] [PMC free article] [PubMed] [Google Scholar]
- 44.Hu DE, Beauregard DA, Bearchell MC, Thomsen LL, Brindle KM. Early detection of tumour immune-rejection using magnetic resonance imaging. Br J Cancer. 2003;88(7):1135–1142. doi: 10.1038/sj.bjc.6600814. [DOI] [PMC free article] [PubMed] [Google Scholar]
- 45.Rygh CB, Wang J, Thuen M, Gras Navarro A, Huuse EM, Thorsen F, Poli A, Zimmer J, Haraldseth O, Lie SA. Dynamic contrast enhanced MRI detects early response to adoptive NK cellular immunotherapy targeting the NG2 proteoglycan in a rat model of glioblastoma. PLoS One. 2014;9(9) doi: 10.1371/journal.pone.0108414. [DOI] [PMC free article] [PubMed] [Google Scholar]
- 46.Blank C, Brown I, Peterson AC, Spiotto M, Iwai Y, Honjo T, Gajewski TF. PD-L1/B7H-1 inhibits the effector phase of tumor rejection by T cell receptor (TCR) transgenic CD8+ T cells. Cancer Res. 2004;64(3):1140–1145. doi: 10.1158/0008-5472.can-03-3259. [DOI] [PubMed] [Google Scholar]
- 47.Qin W, Baran U, Wang R. Lymphatic response to depilation-induced inflammation in mouse ear assessed with label-free optical lymphangiography. Lasers Surg Med. 2015;47(8):669–676. doi: 10.1002/lsm.22387. [DOI] [PMC free article] [PubMed] [Google Scholar]
- 48.Hanahan D, Weinberg RA. Hallmarks of cancer: the next generation. Cell. 2011;144(5):646–674. doi: 10.1016/j.cell.2011.02.013. [DOI] [PubMed] [Google Scholar]
- 49.Ganss R, Ryschich E, Klar E, Arnold B, Hammerling GJ. Combination of T-cell therapy and trigger of inflammation induces remodeling of the vasculature and tumor eradication. Cancer Res. 2002;62(5):1462–1470. [PubMed] [Google Scholar]
- 50.Perez-Balderas F, van Kasteren SI, Aljabali AA, Wals K, Serres S, Jefferson A, Sarmiento Soto M, Khrapitchev AA, Larkin JR, Bristow C. Covalent assembly of nanoparticles as a peptidase-degradable platform for molecular MRI. Nat Commun. 2017;8:14254. doi: 10.1038/ncomms14254. [DOI] [PMC free article] [PubMed] [Google Scholar]
Associated Data
This section collects any data citations, data availability statements, or supplementary materials included in this article.
Supplementary Materials
Supplementary figures