Abstract
Current histological and anatomical analysis techniques, including fluorescence in situ hybridisation, immunohistochemistry, immunofluorescence, immunoelectron microscopy and fluorescent fusion protein, have revealed great distribution diversity of mRNA and proteins in the brain. However, the distributional pattern of small biomolecules, such as lipids, remains unclear. To this end, we have developed and optimised imaging mass spectrometry (IMS), a combined technique incorporating mass spectrometry and microscopy, which is capable of comprehensively visualising biomolecule distribution. We demonstrated the differential distribution of phospholipids throughout the cell body and axon of neuronal cells using IMS analysis. In this study, we used solarix XR, a high mass resolution and highly sensitive MALDI-FT-ICR-MS capable of detecting higher number of molecules than conventional MALDI-TOF-MS instruments, to create a molecular distribution dataset. We examined the diversity of biomolecule distribution in rat brains using IMS and hypothesised that unsupervised machine learning reconstructs brain structures such as the grey and white matters. We have demonstrated that principal component analysis (PCA) can reassemble the grey and white matters without assigning brain anatomical regions. Hierarchical clustering allowed us to classify the 10 groups of observed molecules according to their distributions. Furthermore, the group of molecules specifically localised in the cerebellar cortex was estimated to be composed of phospholipids.
Subject terms: Imaging, Classification and taxonomy, Structural biology
Introduction
The mammalian brain is composed of a multitude of cell types, and its spatial structure is commensurately highly complex. Regions of the brain have been distinguished and segmented using several criteria, including macro- and micro-scale anatomical and neurological measures1–6. Recent molecular anatomical approaches, such as fluorescence in situ hybridisation, immunohistochemistry, immunofluorescence, immunoelectron microscopy and fluorescent fusion protein, have comprehensively distinguished the distributions of mRNA7–12 and proteins13–15. Molecular biological approaches, such as Brainbow, have the potential to demonstrate the distributions of different neuronal cells in animal brains16,17. The brain-mapping project could also show both fibre structures and neuronal networks of the whole brain18–20. At present, several brain atlases are available, including those of mice, rats and humans (Allen Brain Atlas, http://portal.brain-map.org/; Human Protein Atlas, https://www.proteinatlas.org/)21–26. Although these atlases can display distributions of mRNA and proteins in the brain, the distributions of biomolecules, such as lipids, carbohydrates and amino acids, in the brain remain unclear.
The distributions of biomolecules in the brain can be analysed using several techniques. Among these are radioisotope and fluorescent tagging, with applicable spatial resolutions ranging between those of optical microscopy and electron microscopy, as well as techniques relating to mRNA and proteins27–30. However, since some metabolic processes convert labelled molecules into other forms, fluorescent tags can change the biological nature of molecules and immunostaining is applicable only to a restricted range of biomolecules, these techniques are unsuited to the observation of most biomolecule distributions. Mass spectrometry has the potential to comprehensively analyse a wider range of biomolecules. Through a combination of histological techniques, e.g. laser microdissection and micro-extraction, mass spectrometry can analyse tissue-specific compositions of biomolecules31,32. These approaches have high detection sensitivity of biomolecules, but their spatial resolutions are several hundred micrometres. To investigate the distributions of biomolecules in the brain with a high spatial resolution like optic microscopy, an alternative technique is required.
Imaging mass spectrometry (IMS), integrating mass spectrometry and microscopy, can visualize the distribution of biomolecules at a spatial resolution of a few micrometres33. Using the technique, we have observed the distribution of biomolecules, especially lipid species, in the brain, both with and without pathological changes and revealed that several biomolecules had distinct distributions34–37. We also demonstrated a gradient distribution of axon phospholipid species38,39 and the polarity of phospholipid delivery40. These findings showed the differential distribution of lipid species in cell bodies and neuronal fibres, namely in the white and grey matters. Conversely, we recently demonstrated that the compositions of biomolecules are highly similar in different areas of the same tissues and even within different organs41.
These previous findings led us to the possibility that it can classify the distributions of biomolecules in the brain at least as three groups: in white matter, in grey matter and homogeneously expressed. Pattern analysis, one of unsupervised machine learning techniques, can automatically and unbiasedly classify molecules with their properties42,43. We hypothesise that principal component analysis (PCA) was able to reconstruct the distributions of molecules localised in the grey and white matters. Furthermore, using hierarchical clustering, we have discovered a novel group of molecules distributed in a specific region. Here, we examine the diversity of biomolecule distribution in the brain using IMS and unsupervised machine learning techniques. For the IMS analysis, we selected dihydroxybenzoic acid (DHB), a widely used Matrix Assisted Laser Desorption/Ionisation (MALDI) matrix, for the ionisation of phospholipids34. An IMS dataset was constructed using solarix XR, the most recent MALDI-IMS instrument, installed on a Fourier transform ion cyclotron resonance mass spectrometer (FT-ICR-MS), with a high molecular sensitivity and mass resolution44,45. Using such an instrument, IMS can measure the distributions of many more molecules compared with the previous generation of IMS instruments, such as time-of-flight mass spectrometry (TOF-MS). Finally, we challenged to investigate the diversity of molecule distributions in the brain.
Results
MALDI-IMS analysis of the rat brain section was conducted using MALDI-FT-ICR-MS
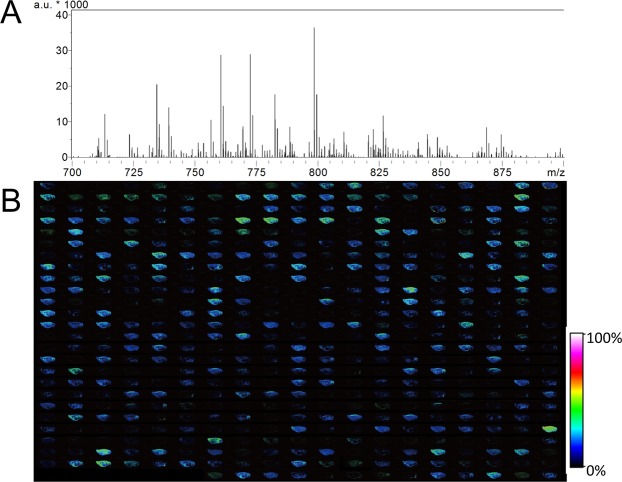
MALDI-IMS analyses were conducted using a solarix XR MALDI-IMS instrument furnished with FT-ICR-MS. Mass spectra were obtained at multiple points from the sagittal section of rat brains. After the acquisition, we performed peak picking in the mass range from 700 to 900 using fleximaging 4.1 software. For the obtained peaks, we manually selected distributions derived from biomolecules and output the dataset. We assigned distributions overlapping with the brain region as biomolecules and excluded that were detected homogeneously on the brain and the slide or had higher intensities outside of the brain as artefacts. Dataset construction and analysis procedures are summarised in Fig. 1. MALDI-IMS analysis allowed us to obtain a mass spectrum of 55,495 points from the sagittal section of rat brains (Fig. 2A). After the manual selection, we acquired a dataset containing 488 distributions derived from biomolecules (Fig. 2B).
Figure 1.
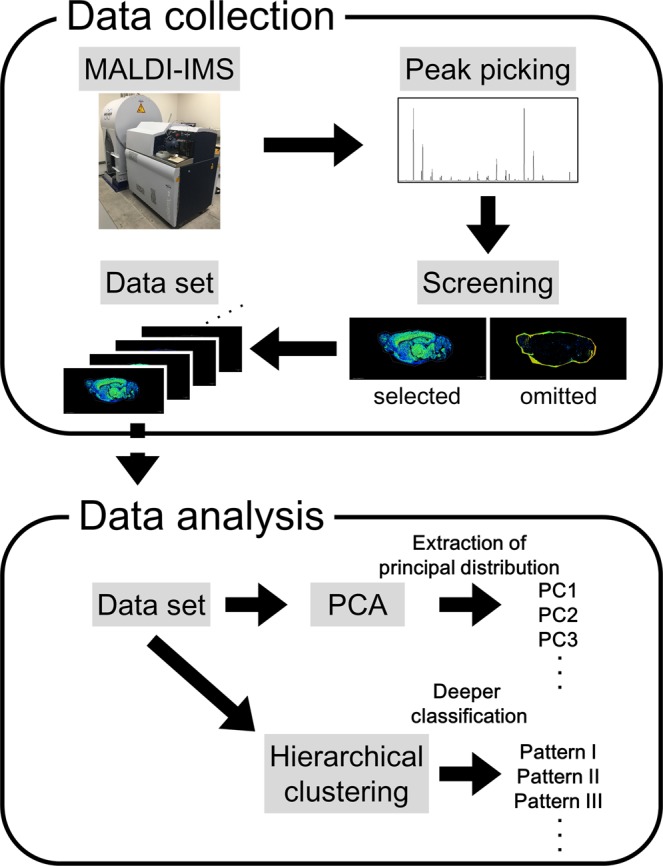
Schematic image of IMS data collection and analysis. The data collection has four steps: MALDI-IMS of the sagittal section of a rat brain, peak picking from the mass spectrum, screening of the distributions of biomolecules and the construction of an IMS dataset. Data analysis was undertaken by performing PCA to extract the principal distribution from the IMS dataset. Hierarchical clustering was used to classify molecules by their patterns of distribution.
Figure 2.
Data collection from rat brain sagittal sections using MALDI-FT-ICR-IMS. (A) Average mass spectrum of all measured points. The x-axis corresponds to the mass range between m/z 700 to 900, whereas the y-axis shows relative signal intensity. a.u., arbitrary unit. (B) Lineup of all biomolecule distributions from a sagittal section of a rat brain in an IMS dataset, for which the number of distributions was 488. The signal intensity of each spot is shown using a rainbow scale.
Intensity distribution of the PC1 reassembly of grey and white matter using PCA
Using the IMS dataset, we performed PCA and reassembled the distribution of biomolecules using SCiLS Lab software. This showed that the distribution of PC1 chiefly overlapped with the regions corresponding to grey matter: the cerebral cortex, cerebellar cortex, interbrain, midbrain, olfactory bulb, striatum, hippocampus and hypothalamus (Fig. 3A). On the other hand, PC2 was mostly observed in fibre tracts: corpus callosum, fornix, stria terminalis, internal capsule, olfactory nerve layer, lateral olfactory tract, cerebral peduncle, arbor vitae, pons and medulla (Fig. 3B). The distribution of PC2 also overlapped with the interbrain, midbrain and hindbrain. PC3 was found to be almost uniformly present throughout the brain, albeit with slightly lesser intensity in the cerebral cortex and a stronger intensity in the medulla (Fig. 3C). These intensity distributions indicate that there are at least three major distributions of biomolecules in rat brains. The Contributions of PC1, PC2 and PC3 were 19.8% 9.1% and 6.0%, respectively.
Figure 3.
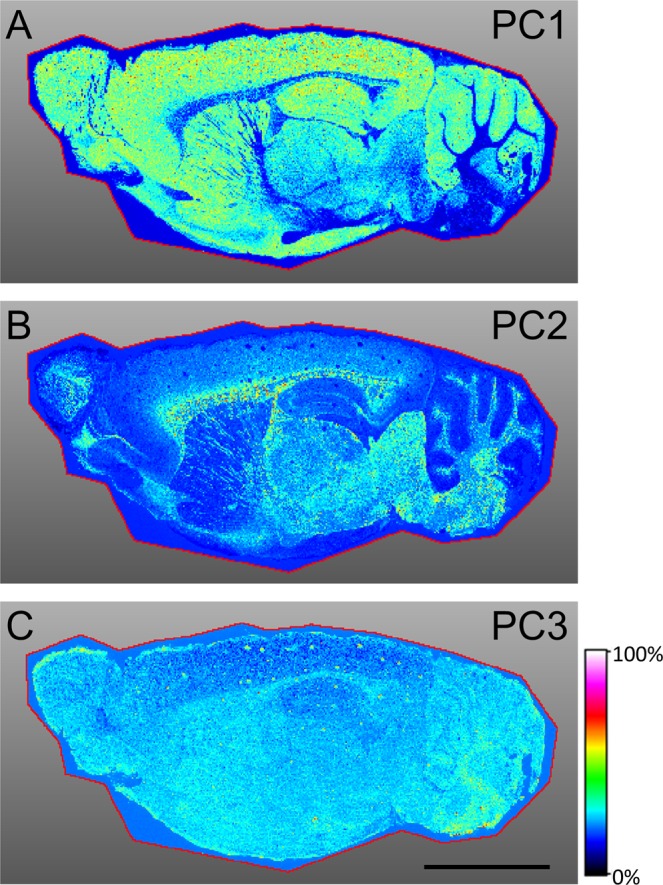
PCA of the sagittal section of a rat brain. Rainbow scale, intensity distributions of (A) PC1, (B) PC2 and (C) PC3 were displayed using a rainbow colour scale. The red line indicates the border of the region of interest (ROI). The area of ROI surrounded the whole brain section. Black scale bar = 5 mm.
Pattern recognition using hierarchical clustering analysis
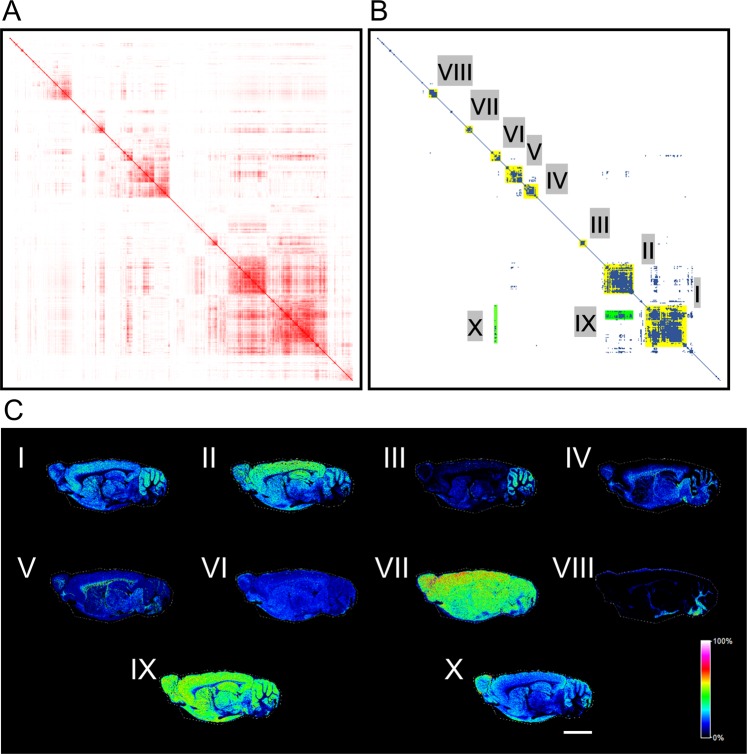
To classify these three major distribution patterns in detail, we performed hierarchical clustering analyses using the same IMS dataset. SCiLS Lab software was used to produce heat maps with similarity values (Fig. 4A and Table S1). The diagonal line indicates combinations where the distributions have the same m/z. Following this, we selected points denoting higher similarity between pairs of distributions on the heat map using a threshold similarity value of 0.5 and obtained eight distributional groups (I–VIII) on the diagonal line and two groups (IX and X) out of the line (Fig. 4B). We found that these groups had distinct distributions (Fig. 4C and Table S2). The occupancies of each group in the total distributions are listed in Table 1.
Figure 4.
Hierarchical clustering of an IMS dataset. Heat maps showing (A) the relative values of cosine similarities in red colour gradient and (B) spots having the values larger than 0.5 in blue. Groups consisting of more than seven biomolecules on the diagonal line were marked in yellow (I–VIII) and those of out of the line in green. (C) Representative distributions of each group (I to X). The rainbow colour scale reflects the signal intensity of each sampling point. Scale bar = 5 mm.
Table 1.
The number and the ratio of molecules in each group out of the total molecules in the hierarchical clustering.
| Group | Number | Ratio (%) |
|---|---|---|
| I | 59 | 12.1 |
| II | 43 | 8.8 |
| III | 7 | 1.4 |
| IV | 19 | 3.9 |
| V | 23 | 4.7 |
| VI | 13 | 2.7 |
| VII | 9 | 1.8 |
| VIII | 11 | 2.3 |
| Grouped total | 184 | 37.7 |
Of these, group I was the largest, primarily localised in the cerebral cortex, cerebellar cortex, interbrain, midbrain, olfactory bulb, striatum, hippocampus and hypothalamus; its distributional pattern was similar to that of PC1 of PCA (Figs 3A and 4C). Group II was the second largest, with a distribution similar to that of group I and PC1 (Figs 3A and 4C); however, the signals present in the cerebellar cortex were slightly higher than other regions in group I, whereas the cerebral cortex showed the stronger signal intensity in group II. Groups IX and X also displayed similar distributions to PC1, but their signal intensities, where detected, were homogeneous (Figs 3A and 4C). Group III was chiefly observed in the cerebellar cortex (Fig. 4C). No signals were observed in the fibre tracts in groups I, II, III, IX and X (Fig. 4C) although, contrarily, we detected significant fibre tract signals for groups IV and VIII (Figs 3B and 4C). In group VIII, signals were detected in the corpus callosum, fornix, internal capsule, cerebral peduncle, arbor vitae, pons and medulla (Fig. 4C). The distribution of group IV resembled PC2, being located in the fibre tracts (corpus callosum, fornix, stria terminalis, internal capsule, olfactory nerve layer, lateral olfactory tract, cerebral peduncle, arbor vitae, pons and medulla), as well as in the interbrain, midbrain and hindbrain (Figs 3B and 4C). Signals were observed throughout the brain, but strongly detected in fibre tracts in group V (Fig. 4C). In groups VI and VII, homogeneous signal intensities were detected throughout the brain section as with PC3 (Figs 3C and 4C). Group VII showed high signal intensity in the cerebral cortex compared to other regions (Fig. 4C).
Molecules highly distributed in the cerebellar cortex were estimated to be phospholipids
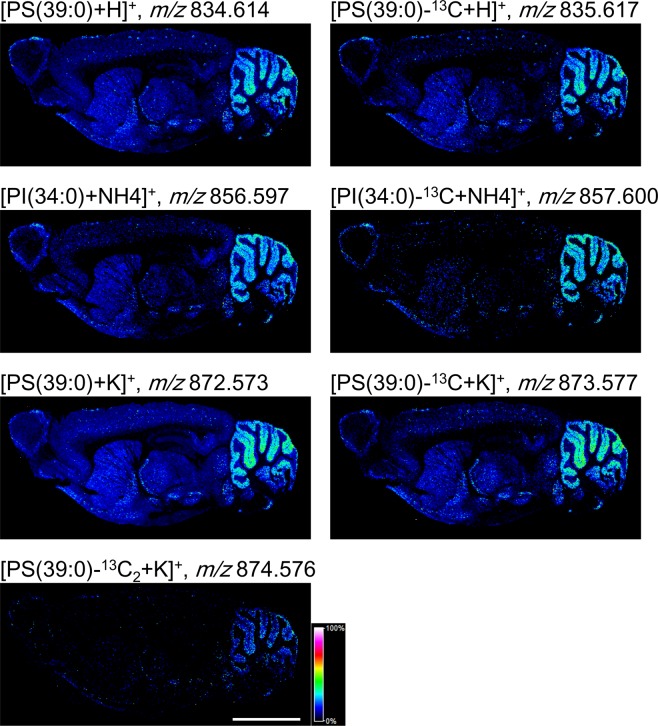
Hierarchical clustering found a group of molecules that were highly expressed in the cerebellar cortex (Fig. 4C, group III). The group C contained seven molecular distributions and some of them exhibited mass differences between m/z values of 1.0 Da: m/z 834.614 and m/z 835.617, m/z 874.576 and m/z 857.600, and m/z 872.573, m/z 873.577 and m/z 874.576. We then hypothesized the mass differences were derived from 13C-isotopes and calculated isotope patterns of these molecules. At first, we estimated the m/z values of the smaller ions using the Human Metabolome Database and assigned m/z 834.614 to [PS(39:0) + H]+, m/z 856.597 to [PI(34:0) + NH4]+ and m/z 872.573 to [PS(39:0) + K]+. The observed mass spectra were well fitted to the relative intensities of the calculated isotope patterns (Fig. 5 and Table 2). The results demonstrated that m/z 835.617 was 13C-isotope of [PS(39:0) + H]+, m/z 857.600 was that of PI(34:0) + NH4]+, and m/z 873.577 and m/z 874.576 were that of [PS(39:0) + K]+. It suggests that the group C was just composed of isotopes of two phospholipids with different adducts.(Fig. 6). We showed the theoretical and observed masses of the phospholipids and their isotopes with the mass errors in Table 3.
Figure 5.
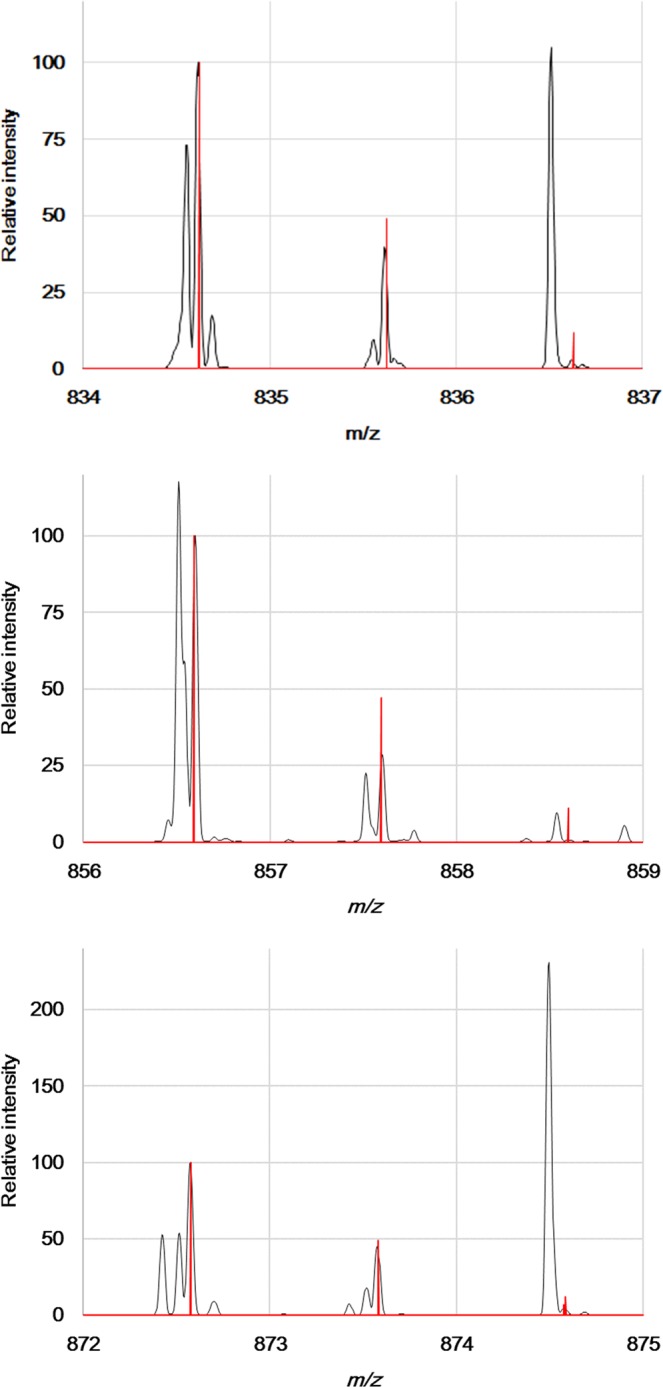
The comparison of observed mass spectra and the calculated isotope pattern. The graphs showing mass spectra from m/z 834 to 837, m/z 856 to 859, and m/z 872 to 875 (black lines). The red lines indicated the calculated isotope patterns of [PS(39:0) + H]+, [PI(34:0) + NH4]+ and [PS(39:0) + K]+.
Table 2.
Relative intensities and mass differences of the molecules in the group C.
| m/z | Relative intensity | Difference in mass from a lighter molecule | m/z | Relative intensity | Difference in mass from a lighter molecule |
|---|---|---|---|---|---|
| (observed) | (observed) | (observed) | (theoretical) | (theoretical) | (theoretical) |
| 834.614 | 100 | 1.003 | 834.6225 | 100 | 1.0034 |
| 835.617 | 40 | 835.6258 | 49 | 1.0034 | |
| 836.6292 | 12 | ||||
| 856.597 | 100 | 1.003 | 856.5916 | 100 | 1.0034 |
| 857.600 | 28 | 857.5949 | 47 | 1.0034 | |
| 858.5983 | 11 | ||||
| 872.573 | 100 | 1.004 | 872.5783 | 100 | 1.0034 |
| 873.577 | 44 | 0.999 | 873.5817 | 49 | 0.9948 |
| 874.576 | 4 | 874.5765 | 7 | 0.0086 | |
| 874.5851 | 12 |
Figure 6.
The molecular group distributed within the cerebellar cortex. Representative distributions of molecules belonging to group III. The rainbow colour scale reflects the signal intensity of each sampling point. Scale bar = 5 mm.
Table 3.
Assignment of ions distributed throughout the cerebellar cortex.
|
m/z
(observed) |
Estimated molecule |
Theoretical mass |
Adduct |
m/z
(adduct) |
delta ppm |
|---|---|---|---|---|---|
| 834.614 | PS(39:0) | 833.6146 | [M + H]+ | 834.6224 | −10.06 |
| 835.617 |
PS(39:0) isotopic |
834.6179 | [M + H]+ | 835.6258 | −10.53 |
| 856.597 | PI(34:0) | 838.5571 | [M + NH4]+ | 856.5915 | 6.42 |
| 857.600 |
PI(34:0) isotopic |
839.5605 | [M + NH4]+ | 857.5949 | 5.95 |
| 872.573 | PS(39:0) | 833.6146 | [M+K]+ | 872.5783 | −6.07 |
| 873.577 |
PS(39:0) isotopic |
834.6179 | [M+K]+ | 873.5816 | −5.27 |
| 874.576 |
PS(39:0) isotopic |
835.6213 | [M+K]+ | 874.5850 | −10.29 |
Discussion
In this study, we developed a novel approach for IMS data analysis that produces an unbiased reconstruction of tissue structure using a large IMS dataset. We demonstrated that typical brain structures could be reassembled using PCA; PC1 corresponded to grey matter and PC2 to fibre tracts. This result suggests that, despite the diversity of molecular distribution in the brain, its structure can be reconstructed using PCA. Furthermore, PC3 showed an almost homogeneous distribution throughout the studied brain sections, indicating that many biomolecules in the brain have endemic distributions. In previous IMS studies, we observed that phosphatidylcholine(PC) species showed own distinct distributions expressed in white matter, grey matter and ubiquitously36,46, but we could not determine which pattern of distribution was greatly observed in the brain with a small number of biomolecule distributions. In this study, we revealed that the number of molecules enriched in grey or white matters were greater than that of molecules expressed homogeneously.
Hierarchical clustering allowed the distributional patterns of biomolecules to be classified at a finer resolution. Therein, groups I, II and III showed very similar signal distributions, but different signal intensities in each region of the brain. Because the molecules in groups I, II and III were expressed in regions corresponding to grey matter, we consider that these molecules are produced or stored in the cell body, such as neurotransmitters47. The molecules of group III were mostly distributed in the cerebellar cortex and were estimated to be phospholipids using the m/z values of ions from the Human Metabolome Database. We hypothesise that these phospholipids have an important role in the region, but their functions in the cerebellar cortex have not been completely investigated. The molecules classified into groups IV and V were found to spatially associate with white matter, suggesting that they are delivered to fibre tracts from grey matter or synthesised in glial cells or directly in the axon. To elucidate this, we attempted to assign obtained m/z values to various molecules. The molecules in group IV were detected in the interbrain, midbrain, hindbrains, pons and medulla, whereas those in group V were observed with weak signal intensities but throughout the brain. It, therefore, seems that the molecules classified into group IV may be synthesised in the brain stem and those from group V are characteristic of the whole brain. The molecules in groups VI and VII were expressed throughout the brain, but the signal intensities of group VII were stronger in the cerebral cortex than in other regions. We believe that this high signal intensity may reflect the localities where the molecules in group VII are synthesised and stored. It is also possible that these molecules are synthesised in regions showing high signal intensity and then dispersed throughout the brain. The ubiquitous expression of these molecules probably implies that they are essential for cellular survival. Contrary to our expectations, we obtained distributional patterns that showed the highest signal intensities in the cerebellar cortex and medulla but could not observe any molecules showing signals specifically in the cerebral cortex, interbrain, midbrain, olfactory bulb, striatum, hippocampus, hypothalamus, pons, or arbor vitae. This suggests either that there are no such molecules or that their numbers are very small. If the criteria for molecular grouping were changed, we would possibly detect molecule groups distributed in these specific brain regions.
As reported in several studies including the present study, IMS is a powerful tool to observe distributions of several small molecules33–46,48–55. Compared with IMS instruments equipped with TOF-MS, FT-ICR-IMS is highly sensitive, can distinguish molecules with very similar molecular weights and, therefore, is able to collect a large number of biomolecule distributions44,45,51. As demonstrated, MALDI-FT-ICR-IMS could collect approximate 500 distributions in a range of m/z 700–900, and the number was large enough to perform clustering analysis. Notably, we found phospholipid species showing high expressions specifically in the cerebellar cortex. However, we obtained duplications of distributions derived from the 13C-isotopes and the same molecules with different adducts. Based on Fig. 5, we estimate that approximately half of the distributions may come from 13C-isotopes. If we exclude these duplications, the number of distributions in each group may drop down, but the ratio will not change. Furthermore, we think some extra steps would be required to reduce such duplications, for example, ammonium sulfate pre-treatment to samples as we previously reported34, and post data analysis to remove distributions of isotopes. In conclusion, we believe that the combination of MALDI-FT-ICR-IMS and unsupervised machine learning techniques is a rapid approach to unbiasedly and automatically classify molecules based on distribution and to easily identify novel molecular groups localised in specific regions.
In the future, similar analyses should be performed with IMS datasets collected using other matrices and different mass ranges33,49,56. Such comparative analyses can provide further patterns of molecular distributions. In addition, LC-MS/MS analysis should be conducted to assign the detected m/z to specific molecules and to identify the molecules classified into each group. Identification of molecules could facilitate elucidation of their interrelationships. For instance, we can investigate whether the molecules are in the same metabolic pathways, belong to the same molecular classes and have the same biological functions. To accelerate and automate the data collection process, we plan to apply unsupervised machine learning for screening biomolecule distributions and excluding distributions of isotopes. A further potential research direction involves the investigation of the functions of identified molecules combining their distribution with the knowledge of neuronal anatomy.
Materials and Methods
Animals
All experimental procedures were approved by the Ethics Committee of the Hamamatsu University School of Medicine (the ethical number for the animal experiment: #2017083) and carried out in accordance with the approved guidelines. Wister male rats aged 8 weeks were purchased from Japan SLC (Hamamatsu, Japan).
Chemicals and materials
Methanol, diethyl ether and ultrapure water were purchased from Wako Pure Chemical Industries (Osaka, Japan). Sodium trifluoroacetate, used as the calibration standard, was purchased from Sigma-Aldrich Japan (Meguro, Japan)51. A MALDI matrix, DHB, was purchased from Bruker Daltonics (Fremont, CA, USA)53, whereas 100 Ω indium tin oxide (ITO)-coated glass slides were purchased from Matsunami Glass Ind., Ltd. (Osaka, Japan)55.
Sample preparation
All rats were anaesthetised by diethyl ether before whole brain samples were quick-frozen with powdered dry-ice. These brain samples were stored at −80 °C prior to making sections. The sagittal sections of the frozen brains were sectioned with a thickness of 10 μm at −20 °C using a Cryostat (CM1950, Leica Microsystems K.K., Tokyo, Japan), and the resulting slices were mounted onto ITO glass slides. The matrix was applied onto slides as a 1.0-μm thick layer by sublimation using iMLayer (Shimadzu Corporation, Kyoto, Japan).
MALDI-IMS analysis
All brain sections were analysed using solarix XR, FT-ICR-IMS (Bruker Daltonics) with an m/z range of 650–1150. The laser diameter was set at the smallest value (~25 μm), laser spot raster at 50 μm, laser shot count at 200, time of flight to 0.7 ms and the positive mode was used. Sodium trifluoroacetate (TFA, [M + Na]+) was used for the external calibration of FT-ICR-MS57.
Data analysis
We obtained mass spectrum data from each measuring point through the brain sections by MALDI-IMS analyses. Data analysis was performed using fleximaging 4.1 (Bruker Daltonics)51 and SCiLS Lab (version 2015b, SCiLs, Bremen, Germany)54. Peak picking used a signal-to-noise threshold of 10 and a width of 0.2 Da. To select the distribution patterns of biomolecules, we manually judged signals that showed higher intensities on the brain section as biomolecules. We performed PCA using the following parameters: algorithm, PCA; denoising, None; interval width, ±0.004 Da; interval processing mode, maximum; normalisation, none; number of components, 5; scaling: unit variance and spectrum mode: individual. Hierarchical clustering was performed using m/z image generation in SCiLS Lab for all screened distributions to obtain a m/z correlation plot. The anatomical position of the rat brain was judged using the Rat Brain in Stereotaxic Coordinates58 and Rat Brain Atlas (http://labs.gaidi.ca/rat-brain-atlas/). For assignment of molecules, we performed LC-MS searches in the Human Metabolome Database (http://www.hmdb.ca/) using the following criteria: positive ion mode, adduct type [M + H]+, [M + NH4]+, [M + Na]+ and [M + K]+] and the threshold of 10 ppm.
Supplementary information
Acknowledgements
This study was supported by MEXT/JSPS KAKENHI Grant Number JP15H05898B1, Japan Agency for Medical Research and Development (AMED) under Grant Number JP19gm0910004 and Imaging Platform supported by the Ministry of Education, Culture, Sports, Science and Technology (MEXT), Japan. We thank Bruker, Japan, for technical support.
Author Contributions
M.N. and M.H. contributed equally to the work. M.N., M.H. and M.S. conceived and wrote the main manuscript text. M.N., K.I. and F.Y. performed the main experiments. M.N., M.H. and M.S. analysed, interpreted the data and discussed the results. H.Y. and T.K. critically reviewed the manuscript. M.S. supervised and provided suggestions to improve the manuscript. All authors reviewed the manuscript and approved the final version of the manuscript.
Competing Interests
The authors declare no competing interests.
Footnotes
Publisher’s note Springer Nature remains neutral with regard to jurisdictional claims in published maps and institutional affiliations.
Makoto Nampei and Makoto Horikawa contributed equally.
Supplementary information
Supplementary information accompanies this paper at 10.1038/s41598-019-49819-1.
References
- 1.Voogd J, Koehler PJ. Historic notes on anatomic, physiologic, and clinical research on the cerebellum. Handb. Clin. Neurol. 2018;154:3–26. doi: 10.1016/B978-0-444-63956-1.00001-1. [DOI] [PubMed] [Google Scholar]
- 2.Faillenot I, Heckemann RA, Frot M, Hammers A. Macroanatomy and 3D probabilistic atlas of the human insula. Neuroimage. 2017;150:88–98. doi: 10.1016/j.neuroimage.2017.01.073. [DOI] [PubMed] [Google Scholar]
- 3.Leggio M, Olivito G. Topography of the cerebellum in relation to social brain regions and emotions. Handb. Clin. Neurol. 2018;154:71–84. doi: 10.1016/B978-0-444-63956-1.00005-9. [DOI] [PubMed] [Google Scholar]
- 4.Ashida R, Cerminara NL, Brooks J, Apps R. Principles of organization of the human cerebellum: macro- and microanatomy. Handb. Clin. Neurol. 2018;154:45–58. doi: 10.1016/B978-0-444-63956-1.00003-5. [DOI] [PubMed] [Google Scholar]
- 5.Kennedy, H., Van Essen, D. C. & Christen, Y. (eds). Micro-, Meso- and Macro-Connectomics of the Brain. (Springer, 2016). [PubMed]
- 6.Stoodley Catherine J., Schmahmann Jeremy D. The Cerebellum: From Embryology to Diagnostic Investigations. 2018. Functional topography of the human cerebellum; pp. 59–70. [DOI] [PubMed] [Google Scholar]
- 7.La Manno G, et al. Molecular diversity of midbrain development in mouse, human, and stem cells. Cell. 2016;167:566–580.e19. doi: 10.1016/j.cell.2016.09.027. [DOI] [PMC free article] [PubMed] [Google Scholar]
- 8.He L, et al. Single-cell RNA sequencing of mouse brain and lung vascular and vessel-associated cell types. Sci. Data. 2018;5:180160. doi: 10.1038/sdata.2018.160. [DOI] [PMC free article] [PubMed] [Google Scholar]
- 9.Saunders A, et al. Molecular diversity and specializations among the cells of the adult mouse brain. Cell. 2018;174:1015–1030.e16. doi: 10.1016/j.cell.2018.07.028. [DOI] [PMC free article] [PubMed] [Google Scholar]
- 10.Ishihara, K. & Akiba, S. A comprehensive diverse ‘-omics’ approach to better understanding the molecular pathomechanisms of down syndrome. Brain Sci. 7 (2017). [DOI] [PMC free article] [PubMed]
- 11.Bakken TE, et al. A comprehensive transcriptional map of primate brain development. Nature. 2016;535:367–375. doi: 10.1038/nature18637. [DOI] [PMC free article] [PubMed] [Google Scholar]
- 12.Morris JA, et al. Divergent and nonuniform gene expression patterns in mouse brain. Proc. Natl. Acad. Sci. 2010;107:19049–19054. doi: 10.1073/pnas.1003732107. [DOI] [PMC free article] [PubMed] [Google Scholar]
- 13.Ping L, et al. Global quantitative analysis of the human brain proteome in Alzheimer’s and Parkinson’s disease. Sci. Data. 2018;5:1–12. doi: 10.1038/sdata.2018.36. [DOI] [PMC free article] [PubMed] [Google Scholar]
- 14.Gabbe BJ, et al. The relationship between compensable status and long-term patient outcomes following orthopaedic trauma. Med. J. Aust. 2007;187:14–17. doi: 10.5694/j.1326-5377.2007.tb01108.x. [DOI] [PubMed] [Google Scholar]
- 15.Li X, et al. Generation of a whole-brain atlas for the cholinergic system and mesoscopic projectome analysis of basal forebrain cholinergic neurons. Proc. Natl. Acad. Sci. 2017;115:201703601. doi: 10.1073/pnas.1703601115. [DOI] [PMC free article] [PubMed] [Google Scholar]
- 16.Livet J, et al. Transgenic strategies for combinatorial expression of fluorescent proteins in the nervous system. Nature. 2007;450:56–62. doi: 10.1038/nature06293. [DOI] [PubMed] [Google Scholar]
- 17.Herget U, Arturo Gutierrez-Triana J, Salazar Thula O, Knerr B, Ryu S. Single-cell reconstruction of oxytocinergic neurons reveals separate hypophysiotropic and encephalotropic subtypes in larval zebrafish Brainbow-guided morphology of oxytocinergic cells. eNeuro. 2017;4:1–16. doi: 10.1523/ENEURO.0278-16.2016. [DOI] [PMC free article] [PubMed] [Google Scholar]
- 18.Okano, H., Miyawaki, A. & Kasai, K. Brain/MINDS: brain-mapping project in (2015). [DOI] [PMC free article] [PubMed]
- 19.Okano H, et al. Brain/MINDS: A Japanese national brain project for marmoset neuroscience. Neuron. 2016;92:582–590. doi: 10.1016/j.neuron.2016.10.018. [DOI] [PubMed] [Google Scholar]
- 20.Mano T, et al. Whole-brain analysis of cells and circuits by tissue clearing and light-sheet microscopy. J. Neurosci. 2018;38:9330–9337. doi: 10.1523/JNEUROSCI.1677-18.2018. [DOI] [PMC free article] [PubMed] [Google Scholar]
- 21.Sunkin SM, et al. Allen Brain Atlas: An integrated spatio-temporal portal for exploring the central nervous system. Nucleic Acids Res. 2013;41:D996–D1008. doi: 10.1093/nar/gks1042. [DOI] [PMC free article] [PubMed] [Google Scholar]
- 22.Salinas CBG, et al. Integrated brain atlas for unbiased mapping of nervous system effects following liraglutide treatment. Sci. Rep. 2018;8:1–12. doi: 10.1038/s41598-017-17765-5. [DOI] [PMC free article] [PubMed] [Google Scholar]
- 23.Uhlen M, et al. Towards a knowledge-based Human Protein Atlas. Nat. Biotechnol. 2010;28:1248–1250. doi: 10.1038/nbt1210-1248. [DOI] [PubMed] [Google Scholar]
- 24.Uhlén M, et al. Tissue-based map of the human proteome. Science. 2015;347:1260419. doi: 10.1126/science.1260419. [DOI] [PubMed] [Google Scholar]
- 25.Lein ES, et al. Genome-wide atlas of gene expression in the adult mouse brain. Nature. 2007;445:168–176. doi: 10.1038/nature05453. [DOI] [PubMed] [Google Scholar]
- 26.Hawrylycz MJ, et al. An anatomically comprehensive atlas of the adult human brain transcriptome. Nature. 2012;489:391–399. doi: 10.1038/nature11405. [DOI] [PMC free article] [PubMed] [Google Scholar]
- 27.Zinnhardt B, et al. In vivo imaging biomarkers of neuroinflammation in the development and assessment of stroke therapies - towards clinical translation. Theranostics. 2018;8:2603–2620. doi: 10.7150/thno.24128. [DOI] [PMC free article] [PubMed] [Google Scholar]
- 28.Kawasaki T, et al. Increase of 20-HETE synthase after brain ischemia in rats revealed by PET study with 11 C-labeled 20-HETE synthase-specific inhibitor. J. Cereb. Blood Flow Metab. 2012;32:1737–1746. doi: 10.1038/jcbfm.2012.68. [DOI] [PMC free article] [PubMed] [Google Scholar]
- 29.Blanco VM, et al. Phosphatidylserine-selective targeting and anticancer effects of SapC-DOPS nanovesicles on brain tumors. Oncotarget. 2014;5:7105–18. doi: 10.18632/oncotarget.2214. [DOI] [PMC free article] [PubMed] [Google Scholar]
- 30.Hofmann K, et al. Astrocytes and oligodendrocytes in grey and white matter regions of the brain metabolize fatty acids. Sci. Rep. 2017;7:1–12. doi: 10.1038/s41598-016-0028-x. [DOI] [PMC free article] [PubMed] [Google Scholar]
- 31.Yutuc, E. et al. Imaging oxysterols in mouse brain by on-tissue derivatisation-robotic liquid micro-extraction surface analysis-liquid chromatography mass spectrometry. 1–18, 10.1101/450973 (2018).
- 32.Knittelfelder O, et al. Shotgun Lipidomics combined with laser capture microdissection: a tool to analyze histological zones in cryosections of tissues. Anal. Chem. 2018;90:9868–9878. doi: 10.1021/acs.analchem.8b02004. [DOI] [PubMed] [Google Scholar]
- 33.Hansen RL, Lee YJ. High-spatial resolution mass spectrometry imaging: toward single cell metabolomics in plant tissues. Chem. Rec. 2018;18:65–77. doi: 10.1002/tcr.201700027. [DOI] [PubMed] [Google Scholar]
- 34.Sugiyama E, Masaki N, Matsushita S, Setou M. Ammonium sulfate improves detection of hydrophilic quaternary ammonium compounds through decreased ion suppression in matrix-assisted laser desorption/ionization imaging mass spectrometry. Anal. Chem. 2015;87:11176–11181. doi: 10.1021/acs.analchem.5b02672. [DOI] [PubMed] [Google Scholar]
- 35.Hameed S, et al. Direct profiling of the phospholipid composition of adult Caenorhabditis elegans using whole-body imaging mass spectrometry. Anal. Bioanal. Chem. 2015;407:7589–7602. doi: 10.1007/s00216-015-8932-7. [DOI] [PMC free article] [PubMed] [Google Scholar]
- 36.Sugiura Y, et al. Visualization of the cell-selective distribution of PUFA-containing phosphatidylcholines in mouse brain by imaging mass spectrometry. J. Lipid Res. 2009;50:1776–1788. doi: 10.1194/jlr.M900047-JLR200. [DOI] [PMC free article] [PubMed] [Google Scholar]
- 37.Sugiura Y, Shimma S, Konishi Y, Yamada MK, Setou M. Imaging mass spectrometry technology and application on ganglioside study; visualization of age-dependent accumulation of C20-ganglioside molecular species in the mouse hippocampus. PLoS One. 2008;3:e3232. doi: 10.1371/journal.pone.0003232. [DOI] [PMC free article] [PubMed] [Google Scholar]
- 38.Yang H, Sugiura Y, Ikegami K, Konishi Y, Setou M. Axonal gradient of arachidonic acid-containing phosphatidylcholine and its dependence on actin dynamics. J. Biol. Chem. 2012;287:5290–5300. doi: 10.1074/jbc.M111.316877. [DOI] [PMC free article] [PubMed] [Google Scholar]
- 39.Itsuko HY, Noriaki I, Zaima N, Sugiura Y, Yao I. Detection of characteristic distributions of phospholipid head groups and fatty acids on neurite surface by time-of-flight secondary ion mass spectrometry. Med. Mol. Morphol. 2010;43:158–164. doi: 10.1007/s00795-009-0487-2. [DOI] [PubMed] [Google Scholar]
- 40.Sugiyama E, Yao I, Setou M. Visualization of local phosphatidylcholine synthesis within hippocampal neurons using a compartmentalized culture system and imaging mass spectrometry. Biochem. Biophys. Res. Commun. 2018;495:1048–1054. doi: 10.1016/j.bbrc.2017.11.108. [DOI] [PubMed] [Google Scholar]
- 41.Sato S, Horikawa M, Kondo T, Sato T, Setou M. A power law distribution of metabolite abundance levels in mice regardless of the time and spatial scale of analysis. Sci. Rep. 2018;8:10315. doi: 10.1038/s41598-018-28667-5. [DOI] [PMC free article] [PubMed] [Google Scholar]
- 42.Guran R, et al. MALDI MSI of MeLiM melanoma: Searching for differences in protein profiles. PLoS One. 2017;12:1–15. doi: 10.1371/journal.pone.0189305. [DOI] [PMC free article] [PubMed] [Google Scholar]
- 43.Hunter M, Demarais NJ, Faull RLM, Grey AC, Curtis MA. Layer-specific lipid signatures in the human subventricular zone demonstrated by imaging mass spectrometry. Sci. Rep. 2018;8:1–12. doi: 10.1038/s41598-017-17765-5. [DOI] [PMC free article] [PubMed] [Google Scholar]
- 44.Smith DF, Schulz C, Konijnenburg M, Kilic M, Heeren RMA. Distributed computing strategies for processing of FT-ICR MS imaging datasets for continuous mode data visualization. Anal. Bioanal. Chem. 2015;407:2321–7. doi: 10.1007/s00216-014-8210-0. [DOI] [PubMed] [Google Scholar]
- 45.Smith DF, et al. An external matrix-assisted laser desorption ionization source for flexible ft-icr mass spectrometry imaging with internal calibration on adjacent samples. J. Am. Soc. Mass Spectrom. 2011;22:130–137. doi: 10.1007/s13361-010-0003-x. [DOI] [PMC free article] [PubMed] [Google Scholar]
- 46.Yuki D, et al. DHA-PC and PSD-95 decrease after loss of synaptophysin and before neuronal loss in patients with Alzheimer’s disease. Sci. Rep. 2014;4:7130. doi: 10.1038/srep07130. [DOI] [PMC free article] [PubMed] [Google Scholar]
- 47.Laurie, L.-E. Neuroscience, 5th Edition (Elsevier, 2017).
- 48.Jones EE, et al. MALDI imaging mass spectrometry profiling of proteins and lipids in clear cell renal cell carcinoma. Proteomics. 2014;14:924–935. doi: 10.1002/pmic.201300434. [DOI] [PMC free article] [PubMed] [Google Scholar]
- 49.Anderson DMG, et al. High resolution MALDI imaging mass spectrometry of retinal tissue lipids. J. Am. Soc. Mass Spectrom. 2014;25:1394–403. doi: 10.1007/s13361-014-0883-2. [DOI] [PMC free article] [PubMed] [Google Scholar]
- 50.Wang X, et al. Identification of genes expressed in the hermaphrodite germ line of C. elegans using SAGE. BMC Genomics. 2009;10:213. doi: 10.1186/1471-2164-10-213. [DOI] [PMC free article] [PubMed] [Google Scholar]
- 51.Guan M, et al. Silver nanoparticles as matrix for MALDI FTICR MS profiling and imaging of diverse lipids in brain. Talanta. 2018;179:624–631. doi: 10.1016/j.talanta.2017.11.067. [DOI] [PubMed] [Google Scholar]
- 52.Hossen A, et al. Decreased level of phosphatidylcholine (16: 0/20: 4) in multiple myeloma cells compared to plasma cells: a single-cell MALDI – IMS approach. Anal. Bioanal. Chem. 2015;407:5273–5280. doi: 10.1007/s00216-015-8741-z. [DOI] [PubMed] [Google Scholar]
- 53.Shimizu Y, et al. Matrix-assisted laser desorption/ionization imaging mass spectrometry reveals changes of phospholipid distribution in induced pluripotent stem cell colony differentiation. Anal. Bioanal. Chem. 2017;409:1007–1016. doi: 10.1007/s00216-016-0015-x. [DOI] [PubMed] [Google Scholar]
- 54.Song C, et al. Molecular and chemical dialogues in bacteria-protozoa interactions. Sci. Rep. 2015;5:1–13. doi: 10.1038/srep12837. [DOI] [PMC free article] [PubMed] [Google Scholar]
- 55.Schwartz SA, Reyzer ML, Caprioli RM. Direct tissue analysis using matrix-assisted laser desorption/ionization mass spectrometry: practical aspects of sample preparation. J. Mass Spectrom. 2003;38:699–708. doi: 10.1002/jms.505. [DOI] [PubMed] [Google Scholar]
- 56.Shibasaki Yasushi, Horikawa Makoto, Ikegami Koji, Kiuchi Ryota, Takeda Makoto, Hiraide Takanori, Morita Yoshifumi, Konno Hiroyuki, Takeuchi Hiroya, Setou Mitsutoshi, Sakaguchi Takanori. Stearate-to-palmitate ratio modulates endoplasmic reticulum stress and cell apoptosis in non-B non-C hepatoma cells. Cancer Science. 2018;109(4):1110–1120. doi: 10.1111/cas.13529. [DOI] [PMC free article] [PubMed] [Google Scholar]
- 57.Moini M, et al. Sodium Trifluoroacetate as a Tune/Calibration the Mass Range of 100–4000 Da. J Am Soc Mass Spectrom. 1998;9:977–980. doi: 10.1016/S1044-0305(98)00079-8. [DOI] [Google Scholar]
- 58.George, P. & Charles, W. The Rat Brain in Stereotaxic Coordinates, 7th Edition. Elsevier. (2013).
Associated Data
This section collects any data citations, data availability statements, or supplementary materials included in this article.


