

Abstract
Convection-enhanced delivery (CED) provides direct access of infusates to brain tumors, however, clinical translation of this technology has not been realized because of the inability to accurately visualize infusates in real-time and lack of targeting modalities against diffuse cancer cells. In this study we use time-resolved MRI to reveal the kinetics of CED processes in a glioblastoma (GBM) model using iron oxide nanoparticles (NPs) modified with a glioma targeting ligand, chlorotoxin (CTX). Mice bearing orthotopic human GBM tumors were administered a single dose of targeted CTX-conjugated NP (NPCP-CTX) or non-targeted NP (NPCP) via CED. High resolution T2-weighted, T2*-weighted and quantitative T2 MRI was utilized to image NP delivery in real-time and determine the volume of distribution (VD) of NPs at multiple time points over the first 48 h post-CED. GBM specific targeting was evaluated by flow cytometry and intracellular NP localization by histological assessment. NPCP-CTX produced a VD of 121 ± 39 mm3 at 24 h, a significant increase compared to NPCP, while exhibiting GBM specificity and localization to cell nuclei. Notably, CED of NPCP-CTX resulted in a sustained expansion of VD well after infusion, suggesting a possible active transport mechanism which was further supported by the presence of NPs in endothelial and red blood cells. In summary, we show that time-resolved MRI is a suitable modality to study CED kinetics and CTX-mediated CED facilitates extensive distribution of infusate and specific targeting of tumor cells.
Keywords: Convection-enhanced delivery, glioblastoma, iron oxide nanoparticles, chlorotoxin, magnetic resonance imaging
Introduction
Convection-enhanced delivery (CED) is an alternative infusate delivery method designed to address limitations of systemically delivered drugs for treatment of neurological diseases such as glioblastoma (GBM) (1). The use of conventionally administered chemotherapy is hindered by the presence of the blood-brain barrier (BBB) that prevents many chemotherapeutics from reaching brain tumors (2). CED bypasses the BBB affording direct delivery of infusates to tumor by slow infusion through a cannula within the tumor mass and provides broad distribution of infusate facilitated by positive pressure gradients that drive convection within the brain (3). The fluid convection process of CED provides considerably better volumes of distribution (VD) than direct diffusion controlled delivery methods such as implantable delivery wafers (Gliadel) and intraneoplastic injection (4). However, CED has demonstrated limited success in clinical trials, due to irreproducible distribution of infusate (5), poor infusate distribution to peripheral areas of diffuse gliomas and an inability to accurately visualize the distribution of infused drug in real-time. Multifunctional nanoscale materials are particularly well-suited to address these limitations by 1) providing endogenous imaging capabilities, 2) allowing for control of size and surface properties, and 3) facilitating facile addition of ligands to provide multivalent targeting of GBM (4,6).
Pre-clinical research has shown promise in nanoparticle (NP) facilitated CED to GBM with specific targeting against overexpressed surface receptors (7–9). Our previous work indicated extensive distribution of chlorotoxin (CTX) labeled iron oxide NPs throughout tumors and surrounding tissue post-CED in a GBM xenograft model (10). However, these observations were made ex vivo and therefore only at limited time points providing little insight on early time-dependent kinetics of CTX-mediated CED. Here, using real-time MR imaging, we investigate the role of the GBM targeting ligand CTX in regards to dispersion of infusate in a CED system comprised of a superparamagnetic iron oxide NP core, a poly(ethylene glycol) (PEG) grafted chitosan surface coating (NPCP), and CTX (NPCP-CTX).
Materials and Methods
Materials
All reagents were purchased from Sigma Aldrich (St. Louis, MO) unless otherwise specified. CTX was purchased from the Fred Hutchinson Cancer Research Center (Seattle, WA). The heterobifunctional linker 2-iminothiolane (2IT) was purchased from Molecular Biosciences (Boulder, CO). NHS-PEG12-maleimide (SM(PEG)12) was purchased from Thermo Fisher Scientific (Rockford, IL). Tissue culture reagents including Dulbecco’s modified Eagle medium (DMEM) and antibiotic–antimycotic were purchased from Invitrogen (Carlsbad, CA). FBS was purchased from Atlanta Biologicals (Lawrenceville, GA).
NPCP synthesis
Iron oxide NPs coated with a copolymer of chitosan-grafted-PEG were synthesized via a co-precipitation method as previously reported (11). The synthesized NPCP were purified using size exclusion chromatography in S-200 resin (GE Healthcare, Piscataway, NJ) into 100 mM sodium bicarbonate buffer, pH 8.0 containing 5 mM EDTA. A subset of NPCPs was set aside for Cy5 and/or CTX labeling while the remaining NPCP were prepared for CED. For CED, NPCPs were further purified in PBS, concentrated using a Vivaspin 2 centrifugal concentrator (Vivaproducts, Littleton, MA) to 2 mg/mL, supplemented with 2.5% 600MW PEG (w/w) and 2.5% dextrose (w/w), flash frozen in liquid nitrogen and stored at −80 °C until used.
Cy5 and CTX labeling of NPCP
NPCP (3.5mg) in 100 mM sodium bicarbonate buffer, pH 8.0, was reacted with 1 mg of Cy5 (GE Healthcare) dissolved in DMSO (10% v/v) for 1 h at room temperature, protected from light and with gentle rocking. A 1 mg/mL solution of CTX was prepared in thiolation buffer and reacted with 2IT at a 1.2:1 molar ratio of 2IT:CTX for 1 h in the dark. Concurrently, NPCP and NPCP-Cy5 were reacted with SM(PEG)12 at 216 μg of SM(PEG)12/mg Fe in the dark with gentle rocking for 30 m. The SM(PEG)12 modified NPCP/NPCP-Cy5 was then reacted with CTX-2IT at 1 μg CTX per 4.5 μg Fe for one hour in the dark to produce NPCP-CTX and NPCP-Cy5-CTX. NPs were purified using size exclusion chromatography in S-200 resin equilibrated with PBS and stored at 4°C. For CED, NPCP-Cy5, NPCP-Cy5-CTX and NPCP-CTX were concentrated using a Vivaspin 2 centrifugal concentrator to 2 mg/mL, supplemented with 2.5% 600 MW PEG (w/w) and 2.5% dextrose (w/w), flash frozen in liquid nitrogen and stored at −80°C until used.
NP characterization
To measure the hydrodynamic size and zeta potential of NPs, the NPs (2 mg/mL, 2.5% wt/wt PEG and dextrose) were diluted to 100 μg/mL in 20 mM HEPES buffer (pH 7.4) and analyzed at 37° C using a DTS Zetasizer Nano (Malvern Instruments, Worcestershire, UK).
To quantify the degree of CTX attachment to NPs, NPCP-CTX was prepared as described above except that free CTX was not purified from the NPCP-CTX reaction mixture. Free, unreacted CTX was separated from the CTX conjugated to NPs through SDS-PAGE and quantified using the Quantity One software package and a standard curve of known concentrations of CTX. CTX conjugated to NPs was calculated by subtracting the amount of free CTX remained in the reaction mixture from the total initial amount of CTX in the reaction.
A capillary viscometer (CANNON Instrument Company, State College, PA) was used to determine the viscosity of NPCP and NPCP-CTX solutions (NP concentration of 2 mg/mL with 2.5% wt/wt PEG and dextrose) with and without Cy5 fluorophore. A recirculating water bath (Thermo Fisher Scientific) was prepared at 40° C. The capillary viscometer was submerged in the water bath vertically with the water height 2 inches above the upper limit demarcation. The viscometer was equilibrated with the water bath for 15 m. A standard volume of 400 μL of sample was charged into the capillary viscometer by pipette, and the sample was equilibrated to 40° C over 5 m. Measurements were made following the manufacturer’s protocol and values were normalized to saline.
TEM images were acquired with an FEI TECNAI F20 TEM (Hillsboro, OR) operating at 200 kV. NP core diameters were analyzed with ImageJ software and the size distribution, mean diameter and standard deviation was calculated from 100 NP measurements.
Animal model
All procedures were performed in accordance with the University of Washington Institutional Animal Care and Use Committee (IACUC) guidelines and approvals. GBM6 cells were obtained from the Mayo Clinic and maintained as flank tumors in nude mice (12). For intracranial implant of GBM6 tumors, flank tumors were harvested, minced with a scalpel, then suspended into an equal volume of ice cold PBS (1 mL PBS per 1 g of tumor). Tumor cells were disaggregated by gentle pipetting then filtered through a 40 μm filter and kept on ice at 107 cells/mL. Mice (nude athymic) were anesthetized with isoflurane and affixed to the base of a stereotaxic frame with ear bars. The skull was exposed through a 1 cm midline incision, then a burr hole made 2 mm to the right of bregma and 1 mm posterior to the coronal suture using a Dremel tool equipped with a 1 mm tip. Using a Hamilton syringe attached to the stereotaxic frame, 2 μL of cells (20,000 cells) were injected over 1 m at a depth of 3 mm. After injection, the syringe was kept in place for 1 m prior to withdrawal and the incision closed with skin glue. Animals were monitored for tumor growth through Xenogen IVIS luminescent imaging. The same process outlined above was used to establish the syngeneic mouse model utilizing C57Bl/6 mice and mouse GL261 glioma cells.
Cranial implantation of cannula
Once tumors grew to approximately 30 mm3 in size, an MR compatible cranial cannula (Plastics 1, Roanoke, VA) was implanted to facilitate CED. Mice (nude athymic) were anesthetized with isoflurane and affixed to the base of a stereotaxic frame with ear bars. The skull was exposed through a 1 cm midline incision, then a burr hole made 2 mm to the right of bregma and 1 mm posterior to the coronal suture using a Dremel tool equipped with a 1 mm tip. The MR compatible cranial cannula was then placed according to the manufacturer’s instructions.
Administration of NPs
NPCP or NPCP-CTX was administered via cranial cannula to two randomized cohorts (NPCP = 4, NPCP-CTX = 5). 3 μL of NPs was infused at 1 μL/min using a Hamilton syringe.
Measurement of the MR transverse relaxation rate of aqueous NP samples
All in vivo and in vitro MRI was performed using a Bruker Avance III 14 T (Ultrashield 600 WB Plus) vertical-bore imaging system. Serial concentration gradients of NPCP and NPCP-CTX were prepared via dilution of concentrated NP stock (2 mg/mL with 2.5% wt/wt PEG and dextrose) to concentrations of 0, 10, 50, 100, 150 and 200 μg Fe/mL in PBS. Glass vials (3.25 mm I.D., 5 mm O.D., 200 μL volume) were loaded with 150 μL of NPs. Sample tubes containing NPs were fixed in place inside a reservoir of PBS; this PBS reservoir served as a homogeneous background signal to minimize magnetic susceptibility variations near the samples. The secured vials were placed in a 25 mm single-channel 1H radiofrequency receiving coil (PB Micro 2.5) at 20° C. The transverse relaxation rates for NPCP and NPCP-CTX were evaluated using a quantitative T2 multi-spin multi-echo (MSME) pulse sequence with TR = 2500 ms, TE = 6.7 + 6n ms (n = 0–16), 78 × 52 μm2 in-plane resolution, matrix 384 × 256 and 0.5 mm slice thickness for 14 slices.
In vivo MRI
After anesthetization and cannula placement, for post-CED MRI, mice were positioned in a 25 mm single-channel 1H radiofrequency receiving coil (PB Micro 2.5) centered on the head. During imaging, mice remained anesthetized with isoflurane (Piramal Healthcare) and secured in a coil-integrated respiratory monitoring system (SA Instruments; MR-compatible small animal monitoring and gating system) with nose-cone for oxygen/anesthetic, ear-bar head holder, circulating temperature control bath and residual gas extraction. A 3D fast imaging with steady state precession (FISP) scan sequence was performed (TR/TE = 15/7.5 ms, resolution 106 × 108 × 152 μm2, matrix 284 × 186 × 132) to monitor cannula positioning. Prior to NP administration, a T2-weighted 2D rapid acquisition with refocused echoes (RARE) sequence (TR/TE = 4000/27.1 ms, in-plane resolution 52 × 78 μm2, matrix 384 × 256), a T2*-weighted 2D fast low-angled shot (FLASH) (TR/TE = 1000/6.0 ms, in-plane resolution 78 × 78 μm2, matrix 256 × 256) and a 2D quantitative T2 (QT2) multi-spin multi-echo (MSME) (TR = 4000 ms, TE = 6.7 + 6n ms, (n = 0–16), in-plane resolution 52 × 78 μm2, matrix 384 × 256) sequence were acquired to form a suite of baseline imaging measurements to compare with post-CED imaging. After NP administration, the same T2-weighted, T2*-weighted and QT2 scan sequences were serially acquired in an interleaved fashion immediately after CED and at 20 m, 1 h, 4 h, 12 h and 48 h for a single animal. For a statistical comparison of VD between mice receiving CED of NPCP (n = 4) to mice receiving CED of NPCP-CTX (n = 5), the same interleaved imaging suite was acquired prior to CED and at 12 h and 24 h post-CED. Total imaging time for each scan sequence was approximately 4 m. Slices for sequential scans were prescribed identically between time points by registering the 14 transverse, 0.5 mm thick slices to extend from the notch formed between the olfactory bulb and the cerebral cortex until the anterior cerebellum.
MRI data analysis
Analysis of MRI data was performed using the FMRIB software library (FSL) (13), Bruker Paravision 5.1 analytic package and Osirix (Pixmeo). Processing stages for in vitro QT2 data included (i) region of interest (ROI) definition as a circular 100-voxel area residing within a sample cross section, (ii) automated mean T2 value and standard deviation calculation from within the 100-voxel ROI (using the Paravision 5.1 software package) and (iii) calculation of the transverse relaxation rate as the slope of the plot of R2 (computed as 1/T2 using FSL) versus Fe concentration determined through computation of the best-fit line via least-squares linear regression.
Visualization of the VD of NPs administered via CED was achieved by applying threshold color maps to the 2D transverse T2-weighted images of mice for each of the NPCP and NPCP-CTX cohorts at different time points. T2-weighted signal intensity was normalized in each image to the signal amplitude of a water phantom placed adjacent to the skull of the animal during imaging to correct for temporal fluctuations in hardware sensitivity and scan-to-scan differences in pulse power/receiver gain settings. Only voxels with a percent signal change greater than the applied threshold value (e.g., 10% or 15%) relative to pre-CED images were colored.
Similarly, the VD values of NPCP and NPCP-CTX were calculated by applying a 15% threshold to T2-weighted signal changes referred to pre-CED images after signal normalization. The volume of the voxels composing the subset of voxels representing a 15% signal change or greater was computed as the VD for each animal at the 12 h and 24 h time points. The mean and standard deviation for the VD of each cohort (n = 4 for NPCP and n = 5 for NPCP-CTX) was determined for both 12 h and 24 h time points. A student’s t-test was used to determine statistically significant differences in VD between cohorts and time points. VD for the single mouse imaged at 20 min, 1 h, 4 h, 12 h and 48 h post-CED was determined as above, and error was determined by computing the VD at each time point with thresholds of 10% and 20% instead of 15%.
QT2 images were used to determine the extent of CED over time by plotting the measured T2 values within 5 specified ROIs in tumor tissue and healthy brain for a single mouse receiving CED of NPCP-CTX or NPCP. ROIs were defined as 50-voxel squares and were prescribed in precisely the same location within the brain across all time points. The represented T2 values are displayed as the mean and standard deviation of the T2 value of the 50-voxel ROI.
Flow cytometry analysis
24 h after NP administration, animals were euthanized and tumors were isolated and placed in ice cold PBS. Tumors were sectioned and tumor cells were disassociated and passed through a 70 μm cell strainer (Thermo Fisher Scientific) to acquire a single cell suspension. Cells were then subjected to staining with GBM stem cell marker anti-CD44-PE (Abcam, Cambridge, MA) following the manufacturer’s protocol and analyzed using a BD FACSCanto flow cytometer (Beckton Dickinson, Franklin Lakes, NJ). Data analyses were performed using the FlowJo software package (Tree Star, Ashland, OR).
Histological analysis
Whole brains were removed through necropsy 48 h post-CED of NPs and preserved in 10% formalin for 48 h. Whole brains were then embedded in paraffin wax, sliced in to 5 μm thick sections, and stained with hematoxylin and eosin (H&E) or Prussian blue/Nuclear fast red using standard clinical laboratory protocols. Microscopic images of brains were acquired using an E600 upright microscope (Nikon) equipped with a CCD color camera. Additional preserved brains were provided to the University of Washington Pathology Research Services Laboratory to acquire electron micrographs.
Results
NPCPs were synthesized via co-precipitation of iron chlorides utilizing a chitosan-PEG polymer as previously described (11). NPCP-CTX was produced by immobilization of CTX on the polymer surface of NPCP through a thioether bond, to provide GBM targeting specificity. Table 1 summarizes the key physiochemical properties of NPCP and NPCP-CTX. The amount of CTX conjugated to NPCP, quantitated using a gel electrophoresis assay, was 17 ± 3 CTX molecules per NP. The hydrodynamic size of NPCP and NPCP-CTX were 55 ± 3 and 54 ± 2 nm, respectively, and zeta potentials were 2.18 ± 6.56 and 1.04 ± 8.47 mV, respectively, (Figure 1a and b). The hydrodynamic size and zeta potential of NPCP and NPCP-CTX were comparable and well within the limits for optimal CED (4). Viscosities of NPCP and NPCP-CTX, with and without Cy5 fluorophore, were measured using a capillary viscometer to ensure viscosity differences between NP constructs were not responsible for any observable differences in VD. Viscometry measurements showed no significant difference between NPs, with saline normalized values ranging from 1.18 to 1.25 (Figure 1c). The transverse MR relaxivity for NPCP and NPCP-CTX determined at a field strength of 14 T were comparable at 40.0 ± 0.8 and 40.3 ± 1.0 s−1 mM−1, respectively (Figure 1d), indicating the addition of CTX does not appreciably affect transverse MR relaxation properties of NPCP. Supplemental Fig. S1a and S1b show the TEM image of NPCP-CTX and the distribution of NPCP-CTX core diameters, respectively. The diameter of the NP iron oxide core was seen to be 7.0 ± 1.3 nm.
Table 1.
Primary physicochemical properties of NPCP and NPCP-CTX.
| Infusate | CTX molecules/NP |
Hydro- dynamic Size (nm) |
Zeta Potential (mV) |
Viscosity (Pa·sexp/Pa ·ssaline) |
Transverse Relaxivity (s−1 mM−1) |
Core size (nm) |
|---|---|---|---|---|---|---|
| NPCP | 0 | 55 ± 3 | 2.18 ± 6.56 | 1.25 ± 0.05 | 40.0 ± 0.8 | 7.0 ± 1.4 |
| NPCP-CTX | 17 ± 3 | 54 ± 2 | 1.04 ± 8.47 | 1.22 ± 0.09 | 40.3 ± 1.0 | 7.0 ± 1.4 |
Figure 1.
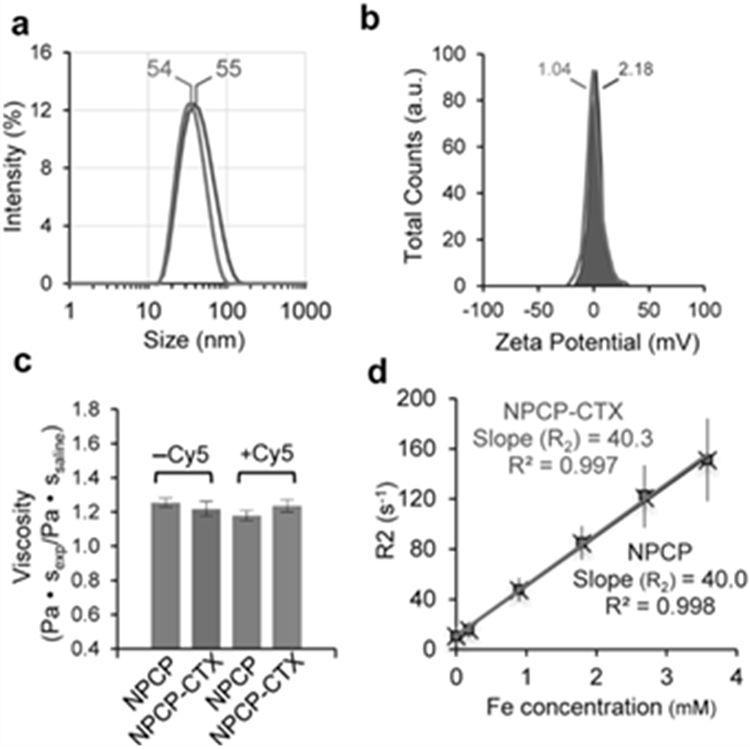
Physicochemical properties of NPCP and NPCP-CTX. (a) Hydrodynamic size distribution and (b) zeta potential of NPCP (gray) and NPCP-CTX (red). (c) Viscosity comparison of NPCP and NPCP-CTX with and without Cy5 fluorophore conjugated and normalized to the viscosity of saline. (d) Transverse MR relaxation rate, R2, of NPCP (gray) and NPCP-CTX (red) measured as a function of iron concentration at a field strength of 14 T. The slopes of the lines represent the transverse relaxivity (R2), and were calculated to be 40.0 and 40.3 s−1 mM−1 for NPCP and NPCP-CTX, respectively.
Intracranial GBM6 xenografts were established in nude athymic mice to evaluate the effects of CTX modification of NP on VD during CED. GBM6 is a clinically relevant human primary tumor that is maintained by serial subcutaneous tumor passage, thereby sustaining key molecular and morphologic phenotype of the human primary tumor (14). Tumor growth was monitored by Xenogen IVIS luminescent imaging, and once tumors were established, cannulas were placed through a burr hole made 2 mm to the right of the bregma and 1 mm posterior to the coronal suture to center the cannula within the tumor. Figure 2a schematically depicts the experimental CED configuration using a 14 T MRI system. Surface reconstruction of a 3D FISP scan sequence demonstrates cannula entry and approximate location (Figure 2b). A T2-weighted 2D coronal slice indicates the exact location of the cannula denoted by a red box around the ROI (Figure 2c). The ROI in Figure 2c is shown in an expanded view to provide more accurate cannula dimensions (Figure 2d).
Figure 2.
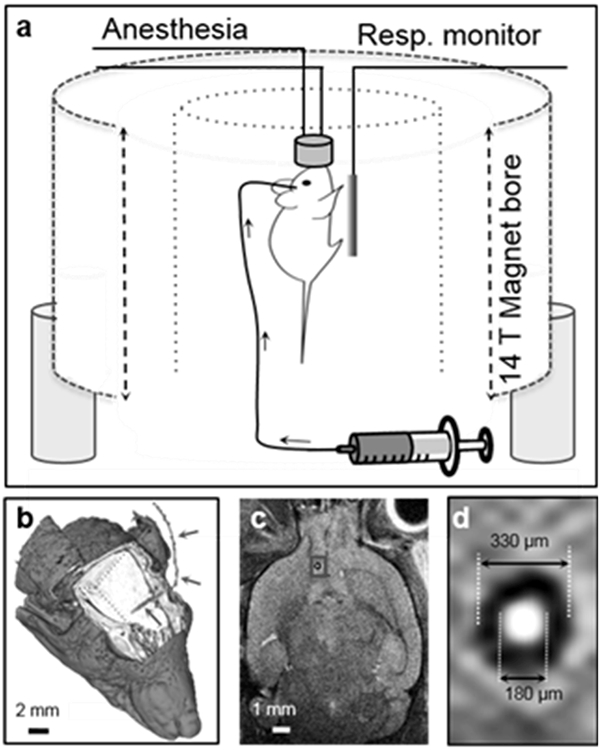
Experimental design for real-time monitoring of CED. (a) Schematic illustration of in vivo MRI using a 14 T field strength vertical bore MRI system, animal monitoring system and intracranial cannula. (b) Surface reconstruction of a cranial 3D FISP scan sequence demonstrating the cannula location (cannula marked with red arrows). (c) A coronal slice demonstrates dimensions and approximate implant location. The ROI (marked with a red frame) in (c) is enlarged and shown in (d).
NPs were delivered (3 μL, 1 μL/min) to each mouse by a CED process with the animal positioned within the magnet to facilitate serial imaging post-CED. Interleaved T2-weighted, T2*-weighted and QT2 imaging was performed before and immediately after CED and at 20 m, 1 h, 4 h, 12 h and 48 h post-CED in a representative animal for NPCP and NPCP-CTX. Additional animals were imaged pre-CED of NPs and at 12 h and 24 h after NPCP (n = 4) or NPCP-CTX (n = 5) administration to provide a statistical comparison of VD between CTX targeted and non-targeted NPs. Figure 3a and b display T2-weighted signal change at 0 h (immediately post-CED) and 48 h in 7 adjacent image slices in the transverse plane encompassing the tumor region of animals administered (a) NPCP or (b) NPCP-CTX. The blue color map denotes % T2-weighted signal change of voxels within the brain at 0 h, and the red color map denotes % T2-weighted signal change at 48 h corresponding to increased NP concentration. These images show a substantially greater VD of CTX-enabled NPs throughout the tumor space compared to non-targeted NPs at 48 h. Highly sensitive T2*-weighted transverse images of slices centered on the cannula insertion tracts of NPCP (Figure 3c) and NPCP-CTX (Figure 3d) treated animals were used to detect low concentrations of NP at the periphery of the expanding VD over time from pre-injection to 48 h post-injection. Iron oxide NP provides negative contrast enhancement; therefore, a voxel containing NP will appear darker in the MR image. The distribution of NPCP-CTX continued to increase to 48 h and broadly covered the tumor, but NPCP receded by 48 h within the transverse plane.
Figure 3.
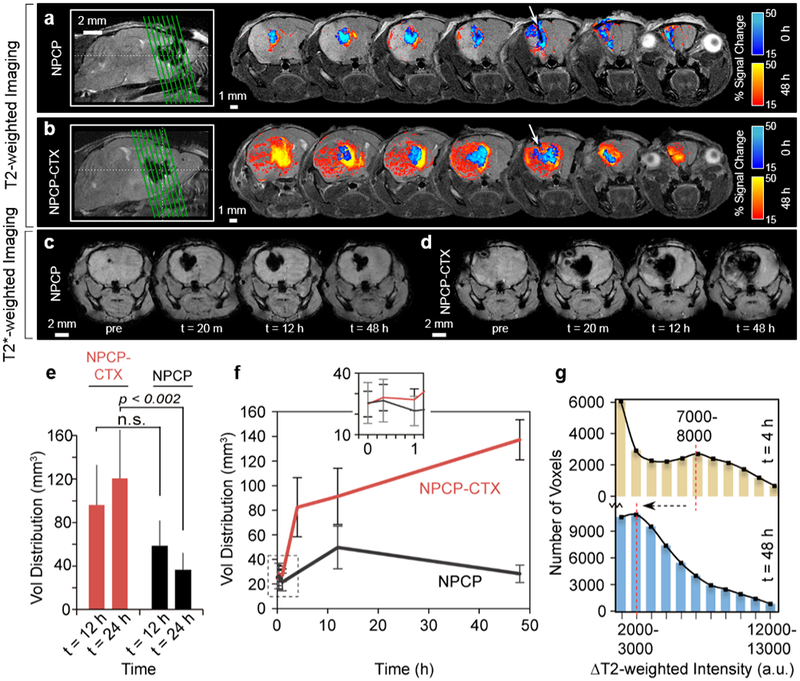
T2-weighted and T2*-weighted MRI for determination of VD. (a and b) Representative T2-weighted transverse images from 7 adjacent slices through the tumor region for (a) NPCP and (b) NPCP-CTX treated mice. The green lines in the sagittal images on the left side indicate the locations of the 7 transverse slices and the white arrows indicate cannula insertion tracts. (c and d) Highly sensitive T2*-weighted images of (c) NPCP and (d) NPCP-CTX treated mice acquired pre- and post-CED. (e) VD comparison for NPCP-CTX (red) and NPCP (black) treated mice. Error bars represent standard deviations from 3D volume determination in multiple mice for NPCP-CTX (n = 5) and NPCP (n = 4). (f) 3D VD for NPCP-CTX (red) and NPCP (black) as a function of time from an individual mouse elucidating early time point differences in VD. Error bars were determined by re-calculation of VD with ±5% change in threshold parameters (10–20%). The inset at the top of the graph shows an expanded view of the ROI marked by the dashed box. (g) Histogram of all voxels passing 15% threshold at t = 4 h (tan) and t = 48 h (blue) for NPCP-CTX. The relative shift from a small local maximum at 7000–8000 (t = 4 h) to a peak at 3000–4000 (t = 48 h) indicates a transition from a relatively low volume (number of voxels), high concentration NP distribution to a relatively high volume, low concentration NP distribution, confirming progressive dispersion of NPCP-CTX over 48 h.
VD of NPCP and NPCP-CTX at 12 h and 24 h was calculated by identifying all voxels within 2D transverse slices that passed a 15% threshold of the maximum signal change at 12 h and 24 h, respectively (Figure 3e). VD of NPCP at 12 h was 58 ± 22 mm3 and receded to 36 ± 16 mm3 at 24 h, while VD of NPCP-CTX at 12 h was 96 ± 37 mm3 and increased to 121 ± 39 mm3 at 24 h indicating a significant difference in VD between NPCP and NPCP-CTX at 24 h (p < 0.002). The ratio of VD to infused volume (VD:IV) for NPCP-CTX at 12 and 24 h was 32:1 and 40:1, respectively, which is a 3.4-fold increase compared to NPCP at 24 h. The VD for NPCP and NPCP-CTX were further evaluated using a syngeneic glioma model comprised of C57Bl/6 mice implanted intracranially with mouse GL261 glioma cells which have been shown to be targeted by CTX (15). Supplemental Fig. S2 shows the T2-weighted transverse images of the tumor regions for mice treated with (a) NPCP and (b) NPCP-CTX, and (c) a comparison in VD between NPCP-CTX and NPCP treated mice. As shown, a similar initial VD, and changes in VD over 24 h was observed. Figure 3f shows the VD calculated from a single animal both for NPCP and NPCP-CTX with closely spaced early time points. NPCP-CTX VD increased dramatically from 1 h to 4 h followed by a less dramatic, but continued progression in VD to 48 h. NPCP VD, in contrast, increased from 1 h reaching a maximum at 12h before diminishing. To evaluate the variability in NPCP-CTX concentration within the VD, change in T2-weighted intensity between pre-CED and 4 h or 48 h post-CED (ΔT2-weighted) was determined. Changes in T2-weighted intensity correlates to NP concentration, and was used to produce a histogram of all voxels passing the 15% threshold at 4 h and 48 h for NPCP-CTX (Figure 3g). The relative shift from a small local maximum at 7000–8000 of ΔT2-weighted intensity to a peak at 2000–3000 of ΔT2-weighted intensity from 4 h to 48 h indicates NPCP-CTX dispersion from a relatively high concentration in a small volume (number of voxels) to a relatively low concentration spread over a greater volume (number of voxels).
Figure 4a provides a detailed look at positive (blue) and negative (green) signal change over specified time intervals in T2-weighted transverse images from two adjacent slices centered around the cannula insertion tract. The two slices presented for each time span were chosen as representative images of the entire tumor space. Signal changes are defined as the signal intensity at the end of a time period minus the signal intensity at the beginning of the same time period. A negative contrast change (i.e., the initial signal intensity is greater than the ending signal intensity of a time period), which indicate increased NP concentration, are highlighted by the green color map while a positive contrast change (i.e., the initial signal intensity is smaller than the ending signal intensity of a time period), indicating a reduction in NP concentration, are highlighted by the blue color map. The color maps indicate the percent change in T2-weighted signal between the time intervals specified above each pair of transverse slice images. NPCP-CTX displays modest dispersion over the first 60 m post-CED, followed by significant dispersion from 60 m to 4 h and 12 h to 48 h indicating a complex dispersion/absorption process (left, Figure 4a). Between 4 and 12 h positive contrast changes were primarily observed in the central region of the tumor indicating a reduction in NPCP-CTX concentration. In comparison, a minimal change in NPCP dispersion is observed over the entire 48 h of post-CED monitoring (right, Figure 4a).
Figure 4.
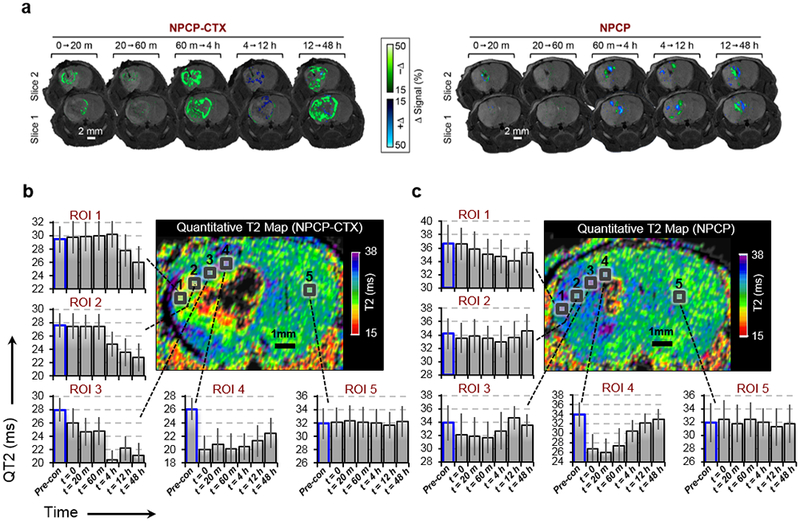
NP distribution as a function of time. (a) Change in T2-weighted signal over the specified time periods of two adjacent slices for NPCP-CTX (left) and NPCP (right) delineating the loss of NP contrast (blue color map, +Δ) and increase in NP contrast (green color map, −Δ). (b and c) Time dependent QT2 signal variation for 5 ROIs within tumor from the periphery to the injection site (ROIs 1 → 4) and in healthy brain (ROI 5) for (b) NPCP-CTX and (c) NPCP treated mice.
QT2 imaging was utilized to quantitate the time dependent distributions of NP throughout the tumor (Figure 4b and c) from pre-administration to 48 h post-CED. To avoid quantitation issues associated with NP saturation and corresponding signal loss, ROIs were selected where complete loss of signal due to NP saturation had not occurred. For example, ROIs 3 and 4 approach the point source of the NP infusion, but do not fall within the narrow region surrounding the point source that contains the highest NP concentration and subsequent complete loss of signal. For NPCP-CTX, regions close to the cannula tip (ROIs 4 and 3) show an immediate reduction in QT2 signal (i.e., increased NP accumulation) with ROI 4 displaying a drastic reduction in QT2 signal followed by a modest signal increase as NPs gradually disperse to outer regions of the tumor over time (Figure 4b). ROIs 2 and 1, near the periphery of the tumor, display no reduction in QT2 signal until 4 h and 12 h, respectively. By 48 h, NPCP-CTX is dispersed relatively evenly throughout the tumor mass as indicated by similar reductions in QT2 signal for ROIs 1–4 as compared to baseline signal (bars outlined in blue). ROI 5, located within healthy brain tissue, shows no change in signal over the 48 h period. The QT2 map of the non-targeted NPCP treated animal shows a reduction in QT2 signal immediately after CED near the cannula tip (ROIs 3 and 4), however, the initial drop in QT2 signal is transient, and returned to near baseline within hours (Figure 4c). The QT2 signal change for ROIs 1 and 2 on the periphery of the tumor show no significant change indicating minimal dispersion of NPCP to the periphery of the tumor.
The specificity of NPs toward GBM was evaluated by flow cytometry analysis of immunofluorescence CD44 staining of tumors treated with NPCP-Cy5 or NPCP-Cy5-CTX (Figure 5). CD44 is a well-studied marker for GBM and its elevated expression correlates with more severe tumor types (14). 24 h post-CED of NPs, tumors were excised, disassociated and passed through a 70 μm cell strainer to acquire single cell suspensions, followed by staining with anti-CD44-PE. A representative scatter plot assessing PE and Cy5 fluorescence intensity is shown in Figure 5a. A significant increase in PE fluorescent signal for a large fraction of tumor cells stained with anti-CD44-PE confirmed the cells are of GBM origin (Figure 5b). The percent of cells stained positive for CD44 were 84.9 ± 6.5%, 74.7 ± 9.4%, and 81.9 ± 10.5% for untreated mice, mice treated with NPCP-Cy5 or NPCP-Cy5-CTX, respectively. A comparison of Cy5 mean fluorescence intensity for samples treated with NPCP-Cy5 to untreated samples indicate a small number of GBM cells positive for the non-targeted NPs (Figure 5c). Comparatively, tumors treated with NPCP-Cy5-CTX show a large population shift in Cy5 signal intensity indicating specific targeting of CTX labeled NP to GBM6 tumor cells.
Figure 5.
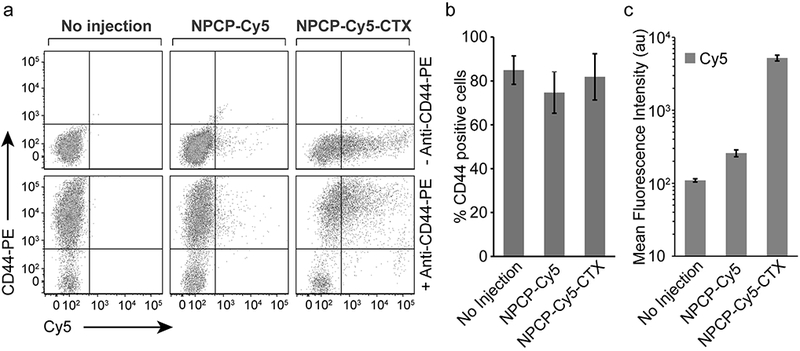
Flow cytometry analysis of NPCP-Cy5-CTX specificity to GBM. (a) Representative scatter plots of excised tumor tissue from untreated mice, and mice administered NPCP-Cy5 and NPCP-Cy5-CTX stained with anti-CD44-PE. (b) Percent of cells stained positive for CD44 indicating GBM origin. (c) Mean fluorescence intensity of Cy5 signal for samples collected from untreated mice, and mice administered NPCP-Cy5 and NPCP-Cy5-CTX indicating a significant increase in Cy5 signal for NPCP-Cy5-CTX. Error bars represent standard deviations with n = 3 mice per treatment.
NPCP and NPCP-CTX cellular localization was examined by histological evaluation of brain tissue sections including the tumor body, tumor margin and healthy brain (Figure 6a and b). 48 h after CED, brains were fixed (10% formalin), imbedded in paraffin and sectioned. Hematoxylin and eosin (H&E) staining revealed the margins between healthy brain and tumor tissue (black arrows), and indicated that NPCP and NPCP-CTX caused no acute toxicity to brain or tumor tissue. Prussian blue staining provided visualization of NP localization. NPCP (Figure 6a) which appears blue in the Prussian blue stained sections are observed in the primary tumor body, but not at the tumor margin. NPCP-CTX (Figure 6b), however, is observed in both the tumor body and tumor margin, but not in healthy tissue at 48 h. Tissue sections from mice administered with NPCP-CTX were analyzed by TEM to evaluate intracellular localization of NPs (Figure 6c and d). NPCP-CTX was present, appearing as black dots, in vasculature cross sections in both endothelial cells (ECs) and red blood cells (RBCs) (Figure 6c), and were found to be intimately associated with chromatin in GBM tumor cells (Figure 6d).
Figure 6.
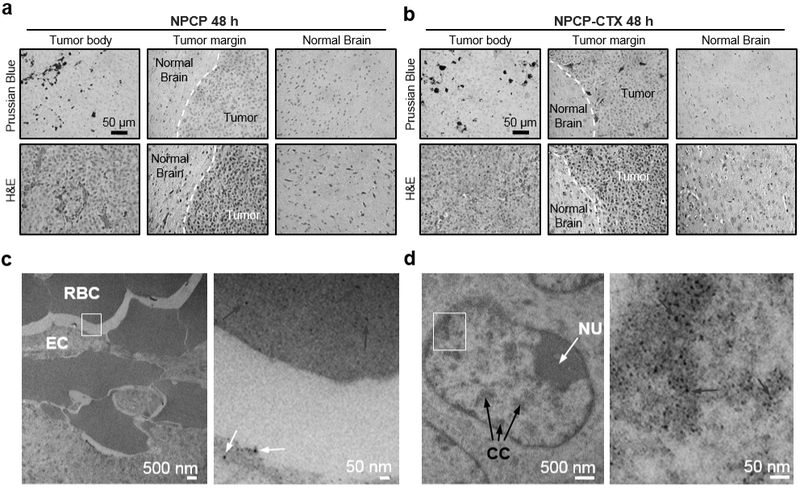
Histological evaluation of NP localization. (a and b) Prussian blue (top row) and H&E stained (bottom row) slices of mouse brain 48 h after CED of (a) NPCP and (b) NPCP-CTX. H&E staining provides clear delineation of the tumor margin (indicated by white dashed line). Prussian blue staining indicates the location of NPs (blue stain) (c) TEM image of intratumoral vessel cross-section denoting RBCs and ECs with an ROI (marked with a white frame, left image) showing NPCP-CTX in ECs (white arrows) and RBCs (red arrows) in the expanded view (right image). (d) TEM images of a GBM cell nucleus denoting nucleolus (NU, white arrow) and condensed chromatin (CC, black arrows) with an ROI (marked by a white frame, left image) showing NPCP-CTX localized to chromatin (blue arrows) in the expanded view (right image).
Discussion
Tissue heterogeneity influences bulk fluid flow in the extracellular space of the brain parenchyma and has a significant effect on distributions of infused agents (16). The presence of a GBM tumor can further exacerbate tissue heterogeneity and necessitates the direct visualization of infused agents for optimization of CED. A common approach in CED studies is the use of surrogate imaging tracers that are co-infused with therapeutic agents (17). However, distributions of tracers can be affected by the delivery system, target tissue and molecular properties of the infused agents, resulting in inaccurate and unreliable evaluation of distributions when monitoring CED (18). NPs with imaging contrast capability can be used to deliver therapeutics while being visualized by an associated imaging modality, eliminating the need for surrogate imaging tracers and improving evaluation of time dependent distribution of infusate. The base NP platform used in the present work served only as a contrast agent, but we have previously extended this platform to combine its MRI capabilities with therapeutic functionality (19,20).
In this study, we utilized iron oxide NPs that are superparamagnetic and serve as a contrast agent for MRI to facilitate real-time imaging of the CED process. Iron oxide NPs are biodegradable and biocompatible and have been used clinically to provide T2 contrast in MRI and many therapeutic formulations of iron oxide NPs are currently under pre-clinical evaluation (21,22). NP diffusion through brain parenchyma is effected by several physiochemical properties including hydrodynamic size, zeta potential, and viscosity (4). The hydrodynamic size (~55 nm) and zeta potential (near neutral) of the NPs utilized in this study were optimal for mitigating NP interactions with the extracellular matrix to minimize NP retention at the injection site and maximize VD (4). Several studies have shown that increased viscosity of infusate provides greater VD by minimizing infusate backflow and increasing pressure at slow infusion rates (23,24). Because of concerns that differences in viscosity would inhibit direct comparison between NP constructs, all NPs were supplemented with 2.5% 600 MW PEG (w/w) and 2.5% dextrose (w/w) to normalize viscosity of infused solutions. In addition to hydrodynamic size, zeta potential and viscosity, the MR relaxivity of NPCP and NPCP-CTX were nearly identical allowing NPCP to serve as an excellent control NP to evaluate the effects of CTX modification.
The MRI evaluation of VD demonstrated that NPCP-CTX produced a 3.4-fold increase in VD over NPCP and greater than a 10-fold increase in VD:IV over values typically reported for NPs or NP-sized infusates (25−110 nm) under similar conditions (1,7,8,25–28). Reported values of VD:IV of NP and NP-sized infusate such as viral vectors are generally 2 to 3-fold less than those reported for small molecules due to size limitations in the extracellular space of the brain. However, NPCP-CTX demonstrated a VD:IV more than 4-fold greater than previously reported values for small molecules (29–31). The combined results from MR evaluation show that NPCP behaved as a typical infusate administered by CED where infusates are dispersed during infusion as positive pressure gradients facilitate convection, followed by minimal diffusion and clearance. Conversely, NPCP-CTX displays behavior that cannot be driven by CED alone. The dramatic increase in VD and the complex time-dependent absorption/dispersion profile observed in Figure 4a post-CED when convective forces are absent suggest that CTX facilitates increased diffusion and/or active transport in addition to the convective forces of CED. The presence of NPCP-CTX in ECs and RBCs further support a mechanism other than simple bulk diffusion or convection in the parenchyma. It should be noted that the atypical behavior of NPCP-CTX would not have been observed if co-infused imaging tracers were employed because imaging tracers lacking CTX functionality behave as typical infusates and their distribution is driven solely by the convective forces of CED and diffusion. These findings highlight the primary advantage of using infusates with endogenous imaging capabilities.
Overexpressed matrix metalloproteinase-2 (MMP-2) and annexin A2 cell surface receptors have been implicated as CTX targets in a range of cancers (32,33). Annexin A2 is reported to play a role in the ability of CTX to bind and internalize in non-cancerous proliferating human vasculature ECs providing a potential mechanism for NPCP-CTX to move from the brain parenchyma into tumor vasculature, facilitating the dispersion of NPCP-CTX through the tumor mass. Recent evidence for the existence of a cerebral venous lymphatic system provides a potential alternate (or complementary) mechanism for the broad distributions observed in CED of NPCP-CTX (34,35). CTX is a peptide toxin found in the venom of the death stalker scorpion (Leiurus quinquestriatus). Studies have shown that toxins can be absorbed through the lymphatics (36). Toxins absorbed in the lymph pool act as a depository providing sustained release of toxin back into the blood stream yielding a complex absorption process (37).
The chitosan-PEG polymer shell likely contributes significantly to the localization of NPCP-CTX to the nuclei of GBM cells. Chitosan, a biocompatible natural polymer, and its derivatives have been used to condense and deliver DNA in gene therapy applications (38), and chitosan NPs have been reported to localize to nuclei of fibroblast cells (39). Nuclear localization of chitosan is likely due to the abundant amines along the chitosan backbone that facilitate electrostatic interaction with the negatively charged DNA phosphate backbone. These interactions have significant implications in GBM chemo-, radio- and gene-therapy. Nuclear localization of therapeutics administered via CED would facilitate increased efficacy of chemotherapeutics that damage DNA or inhibit DNA repair pathways as their main mechanism for cell death. The efficacy of iron oxide NPs as radiosensitizers may be improved by maximizing their effects on nuclei, and in gene therapy applications the extensive nuclear localization of NPCP-CTX could facilitate improved gene expression.
In summary, time-resolved MRI was utilized to investigate the kinetics of CED processes of both targeted (NPCP-CTX) and non-targeted (NPCP) iron oxide NPs with CTX as a targeting ligand. T2 contrast provided by the iron oxide core facilitated real-time MRI evaluation of infusate distribution. NPCP-CTX showed a 3.4-fold increase in VD 24 h post-CED over NPCP, a 10-fold increase over previously reported VD in similar systems, and exhibited sustained expansion within tumor volumes over the observed 48 h. The significant expansion in NPCP-CTX VD suggests the action of a possible active transport mechanism in addition to CED, which was further supported by localization of NP in ECs and RBCs. NPCP-CTX targeting was shown to be specific to GBM cells and the NPs preferentially localized in nuclei where they associated with chromatin. The ability of CTX functionalized NPs administered via CED to broadly cover GBM tumors, localize to nuclei, and provide means for real-time monitoring of infusate distribution has significant implications for GBM treatment. These results warrant continued investigation to fully realize the potential of CTX mediated CED applications in a range of nanomedicine based delivery platforms.
Supplementary Material
Significance: MRI is used to monitor convection-enhanced delivery in real time using a nanoparticle-based contrast agent and glioma specific targeting significantly improves the volume of distribution in tumors.
Acknowledgments.
This work is supported by NIH grant R01CA161953 and the Biomedical Research Support Shared Instrumentation Grant (S10RR029021 to 14T HRIM Facility). P.A.C., Z. S. and M. J. were supported by a training grant (T32CA138312) from the National Cancer Institute of the NIH. R.A.R. is supported the NIH under Award Number F31CA232546. We acknowledge lab assistance from D. Kahn and M. Halbert as well as the use of facility at Nanoengineering & Science Institute and Molecular Engineering & Science Institute supported by NSF (grant NNCI-1542101) and resources at UW Medicine Pathology laboratory and flow cytometry core facility.
Footnotes
The authors declare no potential conflicts of interest.
References
- 1.Lonser RR, Sarntinoranont M, Morrison PF, Oldfield EH. Convection-enhanced delivery to the central nervous system J Neurosurg. 2014/November/15 Department of Neurological Surgery, Ohio State University Wexner Medical Center, Columbus, Ohio; 2015;122:697–706. [DOI] [PubMed] [Google Scholar]
- 2.van Tellingen O, Yetkin-Arik B, de Gooijer MC, Wesseling P, Wurdinger T, de Vries HE. Overcoming the blood-brain tumor barrier for effective glioblastoma treatment Drug Resist Updat. 2015/March/21 Department of Clinical Chemistry/Preclinical Pharmacology, The Netherlands Cancer Institute, Antoni van Leeuwenhoek Hospital, Amsterdam, The Netherlands: Electronic address: o.v.tellingen@nki.nl. Department of Molecular Cell Biology and Immunology, VU Uni; 2015;19:1–12. [DOI] [PubMed] [Google Scholar]
- 3.Bobo RH, Laske DW, Akbasak A, Morrison PF, Dedrick RL, Oldfield EH. Convection-enhanced delivery of macromolecules in the brain Proc Natl Acad Sci U S A. 1994/March/15 Surgical Neurology Branch, National Institute of Neurological Disorders and Stroke, National Institutes of Health, Bethesda, MD 20892; 1994;91:2076–80. [DOI] [PMC free article] [PubMed] [Google Scholar]
- 4.Allard E, Passirani C, Benoit J-P. Convection-enhanced delivery of nanocarriers for the treatment of brain tumors Biomaterials [Internet]. 2009;30:2302–18. Available from: http://www.sciencedirect.com/science/article/pii/S014296120900009X [DOI] [PubMed] [Google Scholar]
- 5.Vogelbaum MA, Aghi MK. Convection-enhanced delivery for the treatment of glioblastoma Neuro Oncol. 2015/March/10 Brain Tumor & Neuro-Oncology Center and Department of Neurosurgery, Cleveland Clinic, Cleveland, Ohio (M.A.V.); Department of Neurological Surgery, University of California, San Francisco, California (M.K.A.); 2015;17 Suppl 2:ii3–ii8. [DOI] [PMC free article] [PubMed] [Google Scholar]
- 6.Chiarelli PA, Kievit FM, Zhang M, Ellenbogen RG. Bionanotechnology and the future of glioma Surg Neurol Int 2015/February/28 Department of Neurological Surgery, University of Washington, Seattle, Washington 98195, USA: Department of Neurological Surgery, University of Washington, Seattle, Washington 98195, USA: ; Department of Materials Science and Engineering, University of Was; 2015;6:S45–58. [DOI] [PMC free article] [PubMed] [Google Scholar]
- 7.Platt S, Nduom E, Kent M, Freeman C, Machaidze R, Kaluzova M, et al. Canine model of convection-enhanced delivery of cetuximab-conjugated iron-oxide nanoparticles monitored with magnetic resonance imaging. Clin Neurosurg. 2012/September/25 2012;59:107–13. [DOI] [PMC free article] [PubMed] [Google Scholar]
- 8.Hadjipanayis CG, Machaidze R, Kaluzova M, Wang L, Schuette AJ, Chen H, et al. EGFRvIII antibody-conjugated iron oxide nanoparticles for magnetic resonance imaging-guided convection-enhanced delivery and targeted therapy of glioblastoma Cancer Res. 2010/July/22 Brain Tumor Nanotechnology Laboratory, Department of Neurosurgery, Emory University School of Medicine, Atlanta, Georgia 30322, USA: chadjip@emory.edu; 2010;70:6303–12. [DOI] [PMC free article] [PubMed] [Google Scholar]
- 9.Schneider CS, Perez JG, Cheng E, Zhang C, Mastorakos P, Hanes J, et al. Minimizing the non-specific binding of nanoparticles to the brain enables active targeting of Fn14-positive glioblastoma cells Biomaterials. 2014/December/30 Department of Neurosurgery, University of Maryland School of Medicine, Baltimore, MD 21201, USA; Marlene and Stewart Greenebaum Cancer Center, University of Maryland School of Medicine, Baltimore, MD 21201, USA: Department of Surgery, University of Maryla; 2015;42:42–51. [DOI] [PMC free article] [PubMed] [Google Scholar]
- 10.Stephen ZR, Kievit FM, Veiseh O, Chiarelli PA, Fang C, Wang K, et al. Redox-Responsive Magnetic Nanoparticle for Targeted Convection-Enhanced Delivery of O-6-Benzylguanine to Brain Tumors. ACS Nano. 2014;8:10383–95. [DOI] [PMC free article] [PubMed] [Google Scholar]
- 11.Veiseh O, Sun C, Fang C, Bhattarai N, Gunn J, Kievit F, et al. Specific Targeting of Brain Tumors with an Optical/Magnetic Resonance Imaging Nanoprobe across the Blood-Brain Barrier Cancer Res [Internet]. 2009/July/30 [Veiseh Omid; Sun Conroy; Fang Chen; Bhattarai Narayan; Gunn Jonathan; Zhang Miqin] Univ Washington, Dept Mat Sci & Engn, Seattle, WA 99195 USA: [Lee Donghoon; Zhang Miqin] Univ Washington, Dept Radiol, Seattle, WA 99195 USA: [Kievit Forrest; Du,; 2009;69:6200–7. Available from: http://www.ncbi.nlm.nih.gov/pubmed/19638572 [DOI] [PMC free article] [PubMed] [Google Scholar]
- 12.Carlson BL, Pokorny JL, Schroeder MA, Sarkaria JN. Establishment, maintenance and in vitro and in vivo applications of primary human glioblastoma multiforme (GBM) xenograft models for translational biology studies and drug discovery Curr Protoc Pharmacol. 2011/July/12 Mayo Clinic, Department of Radiation Oncology, Rochester, Minnesota, USA; 2011;Chapter 14:Unit 14.16. [DOI] [PMC free article] [PubMed] [Google Scholar]
- 13.Jenkinson M, Beckmann CF, Behrens TEJ, Woolrich MW, Smith SM. FSL. Neuroimage [Internet]. 2012;62:782–90. Available from: http://www.sciencedirect.com/science/article/pii/S1053811911010603 [DOI] [PubMed] [Google Scholar]
- 14.Wei KC, Huang CY, Chen PY, Feng LY, Wu TW, Chen SM, et al. Evaluation of the prognostic value of CD44 in glioblastoma multiforme. Anticancer Res. 2010/February/13 Chang Gung Memorial Hospital, Chang Gung University College of Medicine, No. 5, Fu Shin Street, Kweishan, Taoyuan, Taiwan, R.O.C. kuochenwei@adm.cgmh.org.tw; 2010;30:253–9. [PubMed] [Google Scholar]
- 15.Costa PM, Cardoso AL, Mendonça LS, Serani A, Custódia C, Conceição M, et al. Tumor-targeted Chlorotoxin-coupled Nanoparticles for Nucleic Acid Delivery to Glioblastoma Cells: A Promising System for Glioblastoma Treatment Mol Ther Nucleic Acids [Internet]. Nature Publishing Group; 2013;2:e100–e100. Available from: https://www.ncbi.nlm.nih.gov/pubmed/23778499 [DOI] [PMC free article] [PubMed] [Google Scholar]
- 16.Oberoi RK, Parrish KE, Sio TT, Mittapalli RK, Elmquist WF, Sarkaria JN. Strategies to improve delivery of anticancer drugs across the blood–brain barrier to treat glioblastoma Neuro Oncol [Internet]. Oxford University Press; 2016;18:27–36. Available from: http://www.ncbi.nlm.nih.gov/pmc/articles/PMC4677418/ [DOI] [PMC free article] [PubMed] [Google Scholar]
- 17.Hardy PA, Keeley D, Schorn G, Forman E, Ai Y, Venugopalan R, et al. Convection enhanced delivery of different molecular weight tracers of gadolinium-tagged polylysine J Neurosci Methods. 2013/August/06 Department of Anatomy & Neurobiology, University of Kentucky College of Medicine, Lexington, KY, USA: Peter.Hardy@uky.edu; 2013;219:169–75. [DOI] [PubMed] [Google Scholar]
- 18.Jahangiri A, Chin AT, Flanigan PM, Chen R, Bankiewicz K, Aghi MK. Convection-enhanced delivery in glioblastoma: a review of preclinical and clinical studies J Neurosurg. 2016/April/02 Department of Neurological Surgery, University of California at San Francisco, San Francisco, California; 2017;126:191–200. [DOI] [PMC free article] [PubMed] [Google Scholar]
- 19.Stephen ZR, Gebhart RN, Jeon M, Blair AA, Ellenbogen RG, Silber JR, et al. pH-Sensitive O6-Benzylguanosine Polymer Modified Magnetic Nanoparticles for Treatment of Glioblastomas Bioconjug Chem [Internet]. American Chemical Society; 2017;28:194–202. Available from: 10.1021/acs.bioconjchem.6b00545 [DOI] [PMC free article] [PubMed] [Google Scholar]
- 20.Kievit FM, Veiseh O, Fang C, Bhattarai N, Lee D, Ellenbogen RG, et al. Chlorotoxin Labeled Magnetic Nanovectors for Targeted Gene Delivery to Glioma ACS Nano [Internet]. [Kievit Forrest M.; Veiseh Omid; Fang Chen; Bhattarai Narayan; Zhang Miqin] Univ Washington, Dept Mat Sci & Engn, Seattle, WA 98195 USA: [Lee Donghoon; Zhang Miqin] Univ Washington, Dept Radiol, Seattle, WA 98195 USA: [Ellenbogen Richard G.; Zhang; 2010;4:4587–94. Available from: 10.1021/nn1008512 [DOI] [PMC free article] [PubMed] [Google Scholar]
- 21.Anselmo AC, Mitragotri S. A Review of Clinical Translation of Inorganic Nanoparticles. AAPS J [Internet]. 2015;17:1041–54. Available from: 10.1208/s12248-015-9780-2 [DOI] [PMC free article] [PubMed] [Google Scholar]
- 22.Stephen ZR, Kievit FM, Zhang MQ. Magnetite nanoparticles for medical MR imaging Mater Today. [Stephen Zachary R.; Kievit Forrest M.; Zhang Miqin] Univ Washington, Dept Mat Sci & Engn, Seattle, WA 98195 USA: Zhang MQ (reprint author), Univ Washington, Dept Mat Sci & Engn, Seattle, WA 98195 USA: mzhang@u.washington.edu; 2011;14:330–8. [DOI] [PMC free article] [PubMed] [Google Scholar]
- 23.Perlstein B, Ram Z, Daniels D, Ocherashvilli A, Roth Y, Margel S, et al. Convection-enhanced delivery of maghemite nanoparticles: Increased efficacy and MRI monitoring Neuro Oncol 2008/March/05 Department of Chemistry, Bar-Ilan University, Ramat-Gan, Israel; 2008;10:153–61. [DOI] [PMC free article] [PubMed] [Google Scholar]
- 24.Mardor Y, Rahav O, Zauberman Y, Lidar Z, Ocherashvilli A, Daniels D, et al. Convection-enhanced drug delivery: increased efficacy and magnetic resonance image monitoring Cancer Res. 2005/August/03 Advanced Technology Center, Neurosurgery Department, Sheba Cancer Research Center, Sheba Medical Center, Tel Hashomer, Ramat Gan: yaer.mardor@sheba.health.gov.il; 2005;65:6858–63. [DOI] [PubMed] [Google Scholar]
- 25.Idema S, Caretti V, Lamfers MLM, van Beusechem VW, Noske DP, Vandertop WP, et al. Anatomical Differences Determine Distribution of Adenovirus after Convection-Enhanced Delivery to the Rat Brain PLoS One [Internet]. Public Library of Science; 2011;6:e24396 Available from: 10.1371/journal.pone.0024396 [DOI] [PMC free article] [PubMed] [Google Scholar]
- 26.Bernal GM, LaRiviere MJ, Mansour N, Pytel P, Cahill KE, Voce DJ, et al. Convection-enhanced delivery and in vivo imaging of polymeric nanoparticles for the treatment of malignant glioma. Nanomedicine Nanotechnology, Biol Med [Internet]. 2014;10:149–57. Available from: http://www.sciencedirect.com/science/article/pii/S1549963413003432 [DOI] [PMC free article] [PubMed] [Google Scholar]
- 27.Corem-Salkmon E, Ram Z, Daniels D, Perlstein B, Last D, Salomon S, et al. Convection-enhanced delivery of methotrexate-loaded maghemite nanoparticles Int J Nanomedicine [Internet]. Dove Medical Press; 2011;6:1595–602. Available from: http://www.ncbi.nlm.nih.gov/pmc/articles/PMC3160945/ [DOI] [PMC free article] [PubMed] [Google Scholar]
- 28.Szerlip NJ, Walbridge S, Yang L, Morrison PF, Degen JW, Jarrell ST, et al. Real-time imaging of convection-enhanced delivery of viruses and virus-sized particles. J Neurosurg [Internet]. 2007;107:560–7. Available from: 10.3171/JNS-07/09/0560 [DOI] [PubMed] [Google Scholar]
- 29.Lonser RR, Walbridge S, Garmestani K, Butman JA, Walters HA, Vortmeyer AO, et al. Successful and safe perfusion of the primate brainstem: in vivo magnetic resonance imaging of macromolecular distribution during infusion. J Neurosurg [Internet]. 2002;97:905–13. Available from: 10.3171/jns.2002.97.4.0905 [DOI] [PubMed] [Google Scholar]
- 30.Murad GJA, Walbridge S, Morrison PF, Szerlip N, Butman JA, Oldfield EH, et al. Image-guided convection-enhanced delivery of gemcitabine to the brainstem. J Neurosurg [Internet]. 2007;106:351–6. Available from: 10.3171/jns.2007.106.2.351 [DOI] [PubMed] [Google Scholar]
- 31.Sandberg DI, Edgar MA, Souweidane MM. Convection-enhanced delivery into the rat brainstem. J Neurosurg [Internet]. 2002;96:885–91. Available from: 10.3171/jns.2002.96.5.0885 [DOI] [PubMed] [Google Scholar]
- 32.Deshane J, Garner CC, Sontheimer H. Chlorotoxin inhibits glioma cell invasion via matrix metalloproteinase-2 J Biol Chem [Internet]. Department of Neurobiology and Civitan International Research Center, University of Alabama, Birmingham 35294, USA; 2003;278:4135–44. Available from: http://www.ncbi.nlm.nih.gov/entrez/query.fcgi?cmd=Retrieve&db=PubMed&dopt=Citation&list_uids=12454020 [DOI] [PubMed] [Google Scholar]
- 33.Kesavan K, Ratliff J, Johnson EW, Dahlberg W, Asara JM, Misra P, et al. Annexin A2 is a molecular target for TM601, a peptide with tumor-targeting and anti-angiogenic effects J Biol Chem. 2009/December/19 TransMolecular Inc., Cambridge, Massachusetts 02139, USA; 2010;285:4366–74. [DOI] [PMC free article] [PubMed] [Google Scholar]
- 34.Louveau A, Smirnov I, Keyes TJ, Eccles JD, Rouhani SJ, Peske JD, et al. Corrigendum: Structural and functional features of central nervous system lymphatic vessels. Nature. 2016/February/26 2016;533:278. [DOI] [PubMed] [Google Scholar]
- 35.Aspelund A, Antila S, Proulx ST, Karlsen T V, Karaman S, Detmar M, et al. A dural lymphatic vascular system that drains brain interstitial fluid and macromolecules J Exp Med. 2015/June/17 Wihuri Research Institute and Translational Cancer Biology Program, Biomedicum Helsinki, University of Helsinki, 00014 Helsinki, Finland Wihuri Research Institute and Translational Cancer Biology Program, Biomedicum Helsinki, University of Helsinki, 00014; 2015;212:991–9. [DOI] [PMC free article] [PubMed] [Google Scholar]
- 36.Paniagua D, Vergara I, Boyer L, Alagón A. Role of Lymphatic System on Snake Venom Absorption In: Gopalakrishnakone P, Inagaki H, Mukherjee AK, Rahmy TR, Vogel C-W, editors. Snake Venoms [Internet]. Dordrecht: Springer Netherlands; 2015. page 1–19. Available from: 10.1007/978-94-007-6648-8_10-1 [DOI] [Google Scholar]
- 37.Paniagua D, Jimenez L, Romero C, Vergara I, Calderon A, Benard M, et al. LYMPHATIC ROUTE OF TRANSPORT AND PHARMACOKINETICS OF MICRURUS FULVIUS (CORAL SNAKE) VENOM IN SHEEP. Lymphology. C/O C L WITTE MD 1501 N CAMPBELL AVE DEPT SURGERY, TUCSON, AZ 85724 USA: LYMPHOLOGY; 2012;45:144–53. [PubMed] [Google Scholar]
- 38.Mao S, Sun W, Kissel T. Chitosan-based formulations for delivery of DNA and siRNA Adv Drug Deliv Rev. 2009/October/03 School of Pharmacy, Shenyang Pharmaceutical University, 110016 Shenyang, China: shiruimao156@hotmail.com; 2010;62:12–27. [DOI] [PubMed] [Google Scholar]
- 39.Tammam SN, Azzazy HM, Breitinger HG, Lamprecht A. Chitosan Nanoparticles for Nuclear Targeting: The Effect of Nanoparticle Size and Nuclear Localization Sequence Density Mol Pharm. 2015/October/16 Laboratory of Pharmaceutical Technology and Biopharmaceutics, University of Bonn; , Bonn 53121, Germany: Department of Chemistry, The American University in Cairo; , Cairo 11835, Egypt: Department of Biochemistry, The German University in Cairo; , Cairo 1143; 2015;12:4277–89. [DOI] [PubMed] [Google Scholar]
Associated Data
This section collects any data citations, data availability statements, or supplementary materials included in this article.