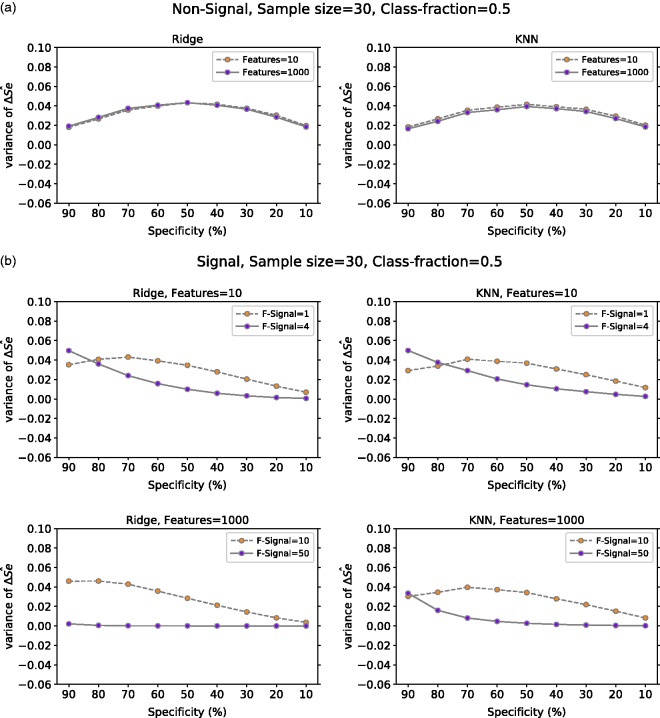
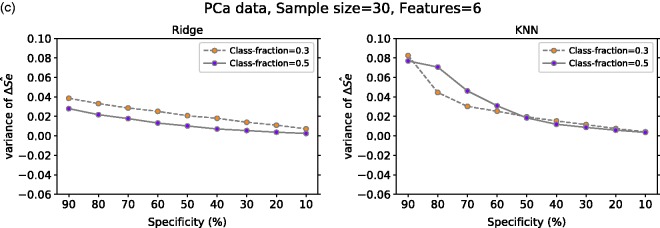
Figure 7.
ΔŜe variance at a given specificity for Ridge and KNN on (a) non-signal data with 10 or 1000 features, (b) signal data with 10 features (one or four have signal) and with 1000 features (10 or 50 have signal) and (c) PCa data with six features for positive class fraction equal to 30% and 50%. For (a) and (b), the classes are balanced and the mean value is computed over 10,000 repetitions. In (c), the number of repetitions is 617. ΔŜe: TLPO and true sensitivity difference; Ridge: ridge regression; KNN: k-nearest neighbors; Class-fraction: proportion of positive units; F-Signal: number of features with signal; PCa: prostate cancer.


