

Abstract
Objective
To determine the long-term association of hemoglobin levels and anemia with risk of dementia, and explore underlying substrates on brain MRI in the general population.
Methods
Serum hemoglobin was measured in 12,305 participants without dementia of the population-based Rotterdam Study (mean age 64.6 years, 57.7% women). We determined risk of dementia and Alzheimer disease (AD) (until 2016) in relation to hemoglobin and anemia. Among 5,267 participants without dementia with brain MRI, we assessed hemoglobin in relation to vascular brain disease, structural connectivity, and global cerebral perfusion.
Results
During a mean follow-up of 12.1 years, 1,520 individuals developed dementia, 1,194 of whom had AD. We observed a U-shaped association between hemoglobin levels and dementia (p = 0.005), such that both low and high hemoglobin levels were associated with increased dementia risk (hazard ratio [95% confidence interval (CI)], lowest vs middle quintile 1.29 [1.09–1.52]; highest vs middle quintile 1.20 [1.00–1.44]). Overall prevalence of anemia was 6.1%, and anemia was associated with a 34% increased risk of dementia (95% CI 11%–62%) and 41% (15%–74%) for AD. Among individuals without dementia with brain MRI, similar U-shaped associations were seen of hemoglobin with white matter hyperintensity volume (p = 0.03), and structural connectivity (for mean diffusivity, p < 0.0001), but not with presence of cortical and lacunar infarcts. Cerebral microbleeds were more common with anemia. Hemoglobin levels inversely correlated to cerebral perfusion (p < 0.0001).
Conclusion
Low and high levels of hemoglobin are associated with an increased risk of dementia, including AD, which may relate to differences in white matter integrity and cerebral perfusion.
Low levels of hemoglobin are a major global health problem, affecting 1.6 billion people worldwide,1 with prevalence of anemia ranging from around 10% after age 65 in Europe and the Americas2,3 to up to 45% in African and Southeast Asian countries.1 Low hemoglobin levels (or the equivalent measure of hematocrit) have been associated with various adverse health outcomes, including coronary heart disease,4,5 stroke,5,6 and mortality.7,8 Limited data, however, are available about the relation of hemoglobin with risk of dementia, and Alzheimer disease (AD) as its most common subtype. As the prevalence of dementia is expected to increase threefold over the next decades, with the largest increases predicted in the countries where the prevalence of anemia is highest,9 it is crucial to acquire more insight in potential long-term effects of abnormal hemoglobin levels on brain health.
Of particular interest to AD is the binding capacity of hemoglobin to β-amyloid 42, a pathologic hallmark of AD, via the iron-containing heme site.10,11 Hemoglobin colocalizes with the plaques and vascular amyloid deposits in the brains of patients with AD,11 and affinity of hemoglobin for binding amyloid might influence risk of developing AD.10 Three prospective cohort studies have thus far investigated hemoglobin levels in relation to incident dementia in the general population.12–14 Each found an increased risk of dementia with anemia, but with the average follow-up limited to 3 years in 2 out of 3 studies,12,13 reverse causality due to (dietary or metabolic) changes in the prediagnostic phase of dementia could account for part of this association. In addition, only one study assessed the risk of dementia across the full range of hemoglobin, reporting an increase in risk of AD also with high hemoglobin levels,13 in line with risks of cardiovascular disease.4–6 These findings merit study of hemoglobin levels, rather than anemia alone, and dementia risk during long-term follow-up in the population. To advance insight in the yet elusive underlying pathways, concurrent brain imaging could complement these studies towards better understanding of a physiologic contribution of hemoglobin to brain health.
We therefore determined the association between hemoglobin levels and risk of dementia in a population-based cohort, and explored potential substrates by studying imaging markers of vascular brain disease, structural connectivity, and cerebral perfusion.
Methods
This study yields data from the Rotterdam Study. Details of this ongoing population-based cohort study in the Netherlands have been described previously.15 In brief, the study was initiated in 1990 with a study population of 7,983 participants aged ≥55 years, who were living in the Ommoord suburb of Rotterdam. The cohort was subsequently expanded twice, first in 1999 including an additional 3,011 individuals who had reached the eligible age or had moved into the study area, and again in 2005 with 3,932 individuals from the same area aged 45 or over. Participants partake in extensive interviews and examinations at a dedicated research facility every 4 years. For the present study, the baseline examination was the first examination of the original cohort and expansion cohorts (1990–1993, 1999–2001, and 2005–2008, respectively). Of the total number of 14,926 participants, 13,498 (90.4%) visited the research center for physical examination. We excluded 396 participants because of prevalent dementia, 73 participants because of insufficient cognitive screening to assess dementia at baseline, and 98 participants who did not provide informed consent for follow-up data monitoring, leaving 13,029 (87.3%) participants eligible for this study. From August 2005 onwards, brain MRI was incorporated in the core study protocol, and until 2014, 5,319 of eligible participants underwent MRI.
Standard protocol approvals, registrations, and patient consents
The Rotterdam Study has been approved by the medical ethics committee according to the Population Study Act Rotterdam Study, executed by the Ministry of Health, Welfare and Sports of the Netherlands. Written informed consent was obtained from all participants.
Measurement of hemoglobin and definition of anemia
We collected nonfasting venous blood samples at baseline in EDTA tubes, and hemoglobin concentrations were measured using a colorimetric method at a wavelength of 525 nm (Counter T660, Beckman Coulter, Brea, CA). Fasting blood samples at time of brain MRI were analyzed with a novel Coulter AcT diff2 Hematology Analyzer from the same producer. In accordance with WHO criteria, anemia was defined as having hemoglobin levels <8.1 mmol/L (13 g/dL) for men and <7.5 mmol/L (12 g/dL) for women.16 We further differentiated microcytic (mean corpuscular volume <80 fL) from normocytic (80–95 fL) and macrocytic anemia (>95 fL in primary and >100 fL in sensitivity analysis, respectively).17
Dementia screening and surveillance
At each center visit, participants took the Mini-Mental State Examination (MMSE) and the Geriatric Mental Schedule (GMS) organic level for dementia screening,18 with further assessment and informant interview for those with MMSE <26 or GMS >0. In addition, computerized linkage of the study database with medical records from general practitioners and the regional institute for outpatient mental health care allowed continuous surveillance of the entire cohort for incident dementia. Clinical neuroimaging data were used to determine dementia subtype. All cases suspect for dementia were reviewed by a consensus panel, including a consultant neurologist, which applied standard criteria for dementia (DSM-III-R) and AD (National Institute of Neurological and Communicative Disorders and Stroke–Alzheimer’s Disease and Related Disorders Association) to come to a final diagnosis. Follow-up until January 1, 2016, was near complete (96.1% of potential person-years), and participants were censored within this follow-up period at date of dementia diagnosis, date of death, date of loss to follow-up, or January 1, 2016, whichever came first.
MRI protocol and image processing
MRI of the brain was performed on a 1.5T scanner (General Electric Healthcare, Milwaukee, WI) using an 8-channel head coil. Imaging acquisition included a high-resolution axial T1-weighted sequence, a fluid-attenuated inversion recovery sequence, a proton density–weighted sequence, and a T2*-weighted gradient echo sequence. Details about the sequences, preprocessing, and the classification algorithm have been described previously.19 Total intracranial and parenchymal volumes and volume of white matter hyperintensities (WMHs) were quantified via automated tissue segmentation.18 All segmentation results were visually inspected and manually corrected if needed. All scans were appraised by trained research physicians for the presence of cerebral microbleeds (i.e., small round to ovoid hypointense areas on T2*-weighted images), lacunar infarcts (i.e., focal lesions ≥3 and <15 mm), and cortical infarcts. These ratings were done blinded to clinical data.
From March 2006 onwards, a diffusion-weighted imaging sequence was incorporated in the scan protocol,20 with the maximum b value of 1,000 s/mm2 in 25 noncollinear directions and 3 volumes without diffusion weighting (b value = 0 s/mm2). A standardized pipeline for preprocessing of the diffusion data started with eddy current and head motion correction on the acquired data, followed by the fitting of diffusion tensors to compute mean fractional anisotropy (FA) and mean diffusivity (MD) in the normal-appearing white matter. Lower FA and higher MD values are generally considered indicative of worse structural connectivity.
For the measurement of cerebral blood flow, 2D phase-contrast imaging was performed as described previously.21 On a sagittal 2D phase-contrast angiographic scout image, we selected a transverse imaging plane perpendicular to the precavernous segment of the internal carotid arteries and the middle segment of the basilar artery. We then acquired a 2D gradient-echo phase-contrast sequence (repetition time = 20 ms, echo time = 4 ms, field of view = 19 cm2, matrix = 256 × 160, flip angle = 8°, number of excitations = 8, bandwidth = 22.73 kHz, velocity encoding = 120 cm/s, slice thickness = 5 mm), with an acquisition time of 51 seconds, without performing cardiac gating. We then used interactive data language-based custom software (Cinetool version 4; General Electric Healthcare) to calculate flow from the phase-contrast images. Two technicians manually drew the regions of interest for the flow measurements (interrater correlations >0.94).21 We calculated global brain perfusion (mL/min/100 mL) by dividing total cerebral blood flow by each individual's brain volume.
Other measurements
We assessed smoking status (i.e., current, former, never), educational attainment (i.e., primary, lower, further, and higher, corresponding to roughly 7, 10, 13, and 19 years of education, respectively), and medication use at baseline by interview. Dietary intake was assessed by a self-administered checklist, followed by a structured food frequency questionnaire interview with a dietician.22 Serum total cholesterol and high-density lipoprotein (HDL) cholesterol were measured by an automated enzymatic procedure in nonfasting blood samples. Blood pressure was measured with a random-zero sphygmomanometer. Body mass index was derived from measurements of weight and height (kg/m2). The definition of diabetes included a random serum glucose level ≥11.1 mmol/L or the use of blood glucose–lowering medication at baseline.23 Glomerular filtration rates were estimated from age- and sex-calibrated serum creatinine levels (CKD-Epi). Heart failure was determined using a validated score, similar to the European Society of Cardiology's definition.24 History of stroke, cancer, and chronic obstructive pulmonary disease were assessed by interview and inspection of medical records. APOE genotype was determined using PCR on coded DNA samples in the baseline cohort, and with a biallelic TaqMan assay (rs7412 and rs429358; Applied Biosystems, Foster City, CA) in the 2 expansion cohorts of the Rotterdam Study.
Analysis
Analyses included all participants without dementia attending the study center for baseline examination. Missing covariate data (percentages displayed in the footnote of table 1) were imputed using 5-fold multiple imputation using an iterative Markov chain Monte Carlo method, based on determinant, outcome, and included covariates. Distribution of covariates was similar in the imputed vs the nonimputed dataset.
Table 1.
Baseline characteristics

We assessed the overall prevalence of anemia and then determined the association between hemoglobin levels and incident dementia using Cox proportional hazard models. In anticipation of a nonlinear association, we formally assessed deviation from linearity using analysis of variance, and proceeded with analyses per quintile of hemoglobin. We performed time-stratified analysis to verify the proportional hazard assumption. All analyses were adjusted for age and sex (model I), and additionally for educational attainment, smoking habits, alcohol consumption, systolic and diastolic blood pressure, antihypertensive medication, body mass index, total cholesterol, HDL cholesterol, lipid-lowering medication, diabetes, renal function, dietary intake, iron intake, vitamin supplements, antianemic medication, hormone replacement therapy, and APOE genotype (model II). We repeated the analyses for AD only after censoring at time of stroke and after excluding individuals with potential secondary causes of erythrocytosis (hemoglobin >1.5 SDs above the mean, and any of the following: chronic obstructive pulmonary disease, heart failure, kidney dysfunction [eGFR < 60], carcinoma, or use of relevant medication including erythropoietin and diuretics; n = 340). To address potential reverse causality, we also repeated the analyses after stepwise exclusion of the first 5 years of follow-up. An estimation of the minimum strength of unmeasured confounding needed to explain away the observed risk estimate for anemia on dementia was expressed as the E-value (evalue.hmdc.harvard.edu/app/).25 This fairly straightforward computation using point estimate and confidence intervals (CIs) provides an indication of the magnitude of confounding required to change the conclusions on the basis of the presented results.
We then determined the association of hemoglobin levels with volume of WMHs, structural connectivity (MD and FA), cerebral microbleeds, presence of lacunar and cortical infarcts, and cerebral perfusion in the subset of participants without dementia who underwent brain MRI. Nonlinear associations were assessed with cubic splines. Linear and logistic regression models were adjusted for age, sex, total intracranial volume, educational attainment, smoking habits, alcohol consumption, systolic and diastolic blood pressure, antihypertensive medication, body mass index, total cholesterol, HDL cholesterol, lipid-lowering medication, diabetes mellitus, vitamin supplements, antianemic medication, and APOE genotype. Analyses of structural connectivity were additionally adjusted for total white matter and volume of WMHs. Finally, because of previously reported interactions with cerebral perfusion,25 we investigated interaction of hemoglobin levels with mean arterial blood pressure and volume of WMHs by testing for multiplicative interaction between continuous variables. Due to restrictions in resources, renal function, dietary intake, iron intake, and C-reactive protein were assessed in fewer than half of participants at time of MRI. As adjustment for these variables did not change the association between hemoglobin and dementia, we opted not to include these in the model for imaging markers, rather than imputing large data quantities.
All analyses were done using IBM SPSS Statistics version 21.0 (IBM, Armonk, NY), except for the restricted cubic splines models, which were run in R (version 3.3.3; packages “survival,” “visreg,” and “rms”). The α (type 1 error) was set at 0.05.
Data availability statement
Data can be obtained on request. Requests should be directed toward the management team of the Rotterdam Study (secretariat.epi@erasmusmc.nl), which has a protocol for approving data requests. Because of restrictions based on privacy regulations and informed consent of the participants, data cannot be made freely available in a public repository.
Results
Of 13,029 eligible participants, 12,308 (94.5%) provided blood samples for measurement of hemoglobin levels. Measurement failed in 3 (0.02%) participants, leaving 12,305 (94.4%) individuals for analysis. Baseline characteristics of participants are shown in table 1.
Overall, 745/12,305 (6.1%) participants had anemia. The prevalence of anemia steeply increased with age in men, from 1.4% below 50 years to 33.3% over age 90, whereas in women, prevalence was higher at premenopausal ages, yet somewhat lower than in men among the elderly (figure e-1, doi.org/10.5061/dryad.kp8c5j3). Of participants with anemia, 104 had microcytic and 68 had macrocytic anemia.
During a mean follow-up time of 12.1 years, 1,520 individuals developed dementia, of whom 1,194 (79%) had clinical AD. Of all incident dementia cases, 222 were preceded by a stroke, a median 4.3 years (interquartile range 1.4–8.0) before diagnosis of dementia.
Hemoglobin levels at baseline showed a quadratic association with risk of dementia (p value for nonlinearity = 0.005; figure e-2, doi.org/10.5061/dryad.kp8c5j3), such that risk was increased with both low and high hemoglobin, compared to mid-range levels (table 2). Compared to no anemia, the presence of anemia was associated with a 34% increase in the risk of all-cause dementia, and 41% increase for AD, with risk estimates highest for macrocytic anemia, followed by microcytic and normocytic anemia, respectively (table 2). The risk estimate for macrocytic anemia >100 fL exceeded that for >95 fL, with a hazard ratio (HR) of 3.1 (1.5–6.6). Effect estimates were similar upon exclusion of the first 5 years of follow-up (table e-1, doi.org/10.5061/dryad.kp8c5j3). Risk estimates were slightly higher for AD only (table 2), unaffected by censoring participants at time of stroke (table e-2, doi.org/10.5061/dryad.kp8c5j3), and similar with (a limited number of) new cases of pure vascular dementia, but no clear associations were seen with other clinical dementia types (table e-3, doi.org/10.5061/dryad.kp8c5j3). The increased risk of dementia with high hemoglobin persisted after excluding individuals with potential causes of secondary erythrocytosis (HR [95% CI] for highest vs middle quintile: 1.22 [1.02–1.47]).
Table 2.
Hemoglobin and anemia in relation to dementia risk

Quantifying the potential residual confounding required to explain away the observed association between anemia and dementia, an unmeasured confounder would need to be associated with both anemia and dementia by a risk ratio of 2.0 each, above and beyond the measured confounders. For the lower confidence limit to include the null (i.e., a HR of 1.0), this number is 1.5.
Of 5,319 participants of the original cohort who underwent brain MRI, 5,281 concurrently had hemoglobin levels measured. Fourteen participants who had dementia at time of MRI were excluded. Compared to the cohort at baseline, individuals who underwent imaging were on average more highly educated, and more often used lipid-lowering medication, but had similar hemoglobin levels (table 1). The association between hemoglobin levels concurrent with MRI and subsequent risk of dementia was similar to the presented results for the entire cohort (table e-4, doi.org/10.5061/dryad.kp8c5j3).
Similar to dementia risk, volume of WMHs and structural connectivity (in particular for MD) were worse in both the lower and upper ranges of hemoglobin levels (figure 1). MD was also higher, indicating worse structural connectivity, in individuals with anemia than in those without (difference [95% CI] 0.207 [0.114–0.301]). These patterns were similar for FA, although risk estimates were somewhat attenuated in the upper range of hemoglobin (figure 1). Significant associations of low hemoglobin with structural connectivity persisted, albeit attenuated, after additional adjustment for WMH volume (table e-5, doi.org/10.5061/dryad.kp8c5j3).
Figure 1. Hemoglobin in relation to structural connectivity and volume of white matter hyperintensities (WMH).
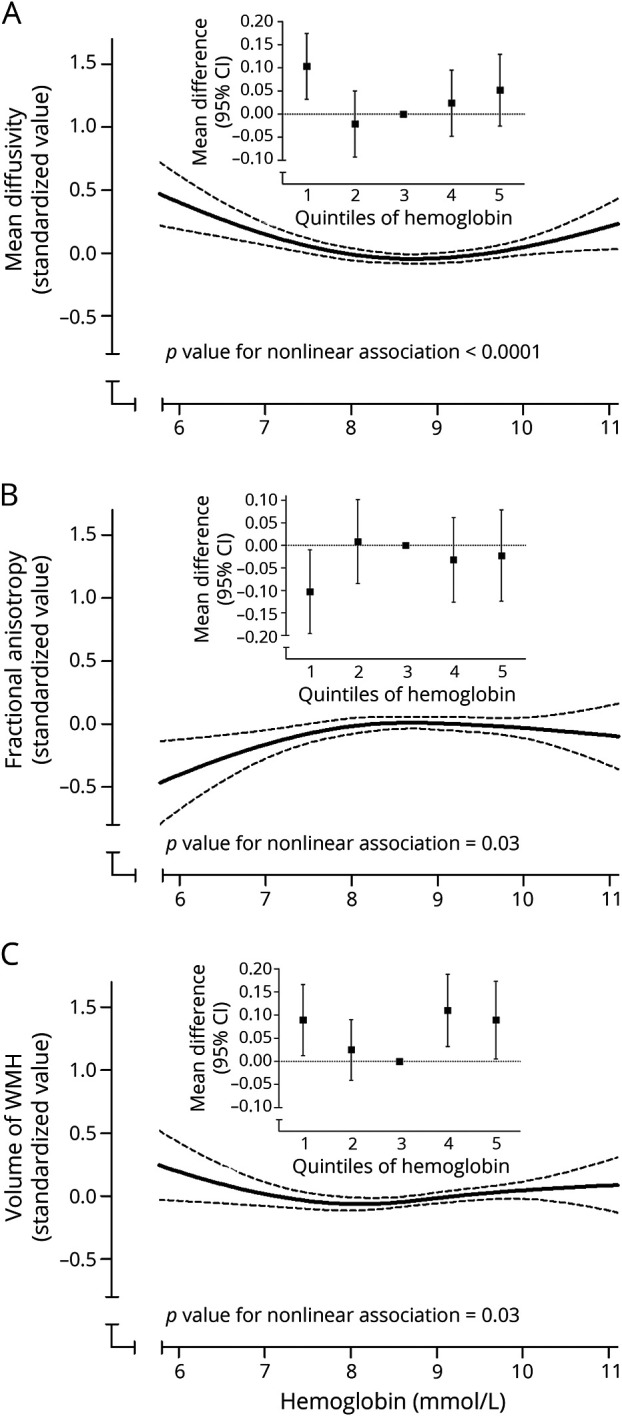
(A, B) Hemoglobin in relation to structural connectivity and (C) volume of WMHs. Solid black lines represent the association of hemoglobin levels with mean diffusivity (A), fractional anisotropy (B), and volume of WMH (C). Dotted lines reflect the 95% confidence interval (CI). The inline figures show the values per quintile of hemoglobin, as compared to the middle (reference) quintile. Higher mean diffusivity and lower fractional anisotropy indicate worse structural connectivity.
Cerebral microbleeds were present in 1,019 (19.3%) participants (≥2 in 419 [8.0%]), lacunar infarcts in 402 (7.6%), and cortical infarcts in 182 (3.5%). Low levels of hemoglobin, but not high levels, were associated with higher prevalence of microbleeds, such that individuals with anemia had a 45% higher likelihood of having at least one microbleed (table 3). The odds ratio (95% CI) increased from 1.29 (0.90–1.86) for harboring 1 microbleed to 1.59 (1.10–2.31) for ≥2 microbleeds. Neither hemoglobin levels nor anemia was related to the presence of lacunar or cortical infarcts (table 3).
Table 3.
Hemoglobin and anemia in relation to focal imaging markers of vascular brain disease

Finally, hemoglobin levels were linearly associated with cerebral perfusion (figure 2), such that 1 mmol/L increase in hemoglobin was associated with 3.2 mL/100 mL/min lower cerebral perfusion (95% CI 2.8–3.6, p < 0.0001). This association was most profound in individuals with larger volume of WMHs (figure 2; p value for interaction = 0.002), with effect estimates increasing from 2.5 (1.7–3.2) mL/100 mL/min in the lowest tertile to 4.0 (3.3–4.6) mL/100 mL/min in the highest tertile of WMHs. Blood pressure levels did not modify the association between hemoglobin and cerebral perfusion (for mean arterial pressure: p = 0.71).
Figure 2. Hemoglobin and cerebral perfusion.

Cerebral perfusion per quintile of hemoglobin (A), and continuously, stratified by severity of white matter hyperintensities (WMHs) on MRI (B; the dashed lines represent the 95% confidence limits). CI = confidence interval.
Discussion
In this large population-based study, we found that both low and high levels of hemoglobin are associated with an increase in the long-term risk of dementia, including AD. Anemia relates to a 34% increase in dementia risk, and 41% for AD. Brain imaging findings suggest that white matter structural connectivity, cerebral perfusion, and potentially microbleeds may act as pathophysiologic substrates in these associations, warranting longitudinal (interventional) imaging studies to investigate their role as potential mediators.
The prevalence of anemia in our study of 6%, and its steep increase with age to roughly 30% in the very elderly, is similar to what has been reported in other European and North American populations.3,7,8,12–14 The worldwide prevalence of anemia, however, is much higher, and the regions most affected mirror those with the steepest increases in the incidence of noncommunicable diseases including dementia.1,9 In line with 3 prior reports,12–14 we show that this—if causal—may have implications for the burden of dementia, as long-term associations with anemia extend to the low–normal range of hemoglobin. The central question that remains, of course, is to which extent hemoglobin levels are directly accountable for this increased risk (e.g., by reduced tissue oxygenation), or whether the associations can be explained by underlying or concomitant vascular or metabolic changes, notably involving iron, and vitamins B9 (folate) and B12.26–28 Anemia can coincide with a wide range of (chronic) conditions, some of which are very rare in the community (e.g., myelodysplastic syndrome, thalassemia), while others (e.g., iron deficiency and inflammation) are common, and could contribute to cognitive decline via pathways unrelated to hemoglobin. We controlled for various such (sub)clinical disease measures in our analyses, including C-reactive protein, and calculated that substantial confounding by other variables would be required to explain away the associations. Nevertheless, potential pathways, also including unmeasured factors like iron, warrant consideration.
As for direct effects, reduced oxygenation can lead to hypoxia and subsequent inflammation with deleterious effects on neurons. The tight correlation of hemoglobin to cerebral blood flow that we found supports the notion of a compensatory mechanism that maintains cerebral oxygen delivery,29 and may be crucial in case of impaired oxygen extraction and failing autoregulatory mechanisms with cerebral small vessel disease.30,31 Iron chelators are thought to maintain levels of hypoxia inducible factor 1-α in the nerve, potentially linking hemoglobin to poor oxygenation and AD.32 When oxygenation falls below the threshold for ischemia, anemia might even lead to ischemic stroke.5,33 Yet clinical stroke did not account for associations in our study, and the absence of an association between low hemoglobin and infarcts on brain MRI, in line with another imaging study,34 suggests that more subtle, chronic processes are involved in cognitive decline. This is illustrated by the increased burden of WMHs and reduced structural connectivity with low and high hemoglobin levels, mirroring the observed dementia risk increase. Although diffusion imaging is unable to differentiate between axonal loss and demyelination, these findings may point to lower or upper range disturbance of iron homeostasis. Iron is vital for various cellular processes in the brain, including neurotransmitter synthesis, mitochondrial function, and myelination of neurons.35 Further study assessing plasma and brain iron (e.g., on contemporary T2* echo gradient MRI), but also transferrin and folate,36 in relation to dementia and biomarkers of AD28,37 may therefore unravel these associations further.
In addition to the lower range, we found that high hemoglobin levels were also associated with an increased risk of dementia, extending short-term observations in a prior study to long-term risk in the community.13 Although studies often focus on anemia and the lower range of hemoglobin levels, high hemoglobin may be deleterious, or reflect deleterious circumstances, in several ways. First, lysis of erythrocytes could cause elevated measurements in the presence of functional anemia and excess of free iron. Second, erythrocytosis occurs secondary to systemic reductions in blood oxygenation, often due to smoking, heart failure, chronic obstructive pulmonary disease, or chronic kidney disease.38 These are all risk factors for dementia, yet excluding participants with common causes of erythrocytosis from our analysis did not attenuate the risk estimates for high hemoglobin. Third, higher blood viscosity could predispose to ischemia, as typically seen in patients with polycythemia vera.39 Elevated hematocrit values have been observed in patients with TIA and stroke40 and covert brain infarcts,41 and although we found no association of high hemoglobin with infarcts on MRI, the previously reported U-shaped associations of hematocrit with risk of dementia, as well as coronary heart disease and ischemic stroke during long-term follow-up, corroborate the potential relevance of deviations on both sides from the normal range.5 Further studies are needed to determine whether these findings are for instance attributable to high viscosity, reductions in tissue oxygenation with very high levels of haematocrit,42 or the higher hematocrit levels in individuals with microangiopathy.43,44
Several limitations to our study need to be taken into account. First, despite robustness of the reported associations to adjustment for a wide range of potential confounders, including (sub)clinical measures of chronic disease, residual confounding may hamper causal inference. In particular, we did not measure (transport of) iron and B vitamins, and variations in their levels and metabolism may contribute to neurodegeneration. However, as demonstrated by the E-value of 2.0, such confounding would need to have strong associations with both determinant and outcome. Second, the subset of our population undergoing MRI was more highly educated and more often used lipid-lowering medication than the cohort at baseline, although with similar hemoglobin levels in both groups this most likely will not have led to bias in the relative risks. Third, our Dutch population is predominantly of European descent, and further study is needed to confirm that these findings indeed apply to other ethnicities and geographic regions. For example, mutations at the α-thalassemia gene, which are common in African descent, and varying prevalence of malaria and sickle cells might contribute to (complications of) anemia differently from what we observe in our population.45
Both low and high levels of hemoglobin are associated with an increased long-term risk of dementia among the general population. Given the potential implications for the burden of dementia globally, studies are needed to identify biological substrates, potentially focusing around disturbances in structural brain connectivity and cerebral blood flow regulation.
Acknowledgment
Supported by the Netherlands CardioVascular Research Initiative: the Dutch Heart Foundation, Dutch Federation of University Medical Centres, the Netherlands Organisation for Health Research and Development, and the Royal Netherlands Academy of Sciences. The Heart–Brain Connection Collaborative research group includes Mark A. van Buchem, Geert Jan Biessels, Hans-Peter Brunner la Rocca, Anton J. de Craen (deceased), Wiesje M. van der Flier, M. Arfan Ikram, L. Jaap Kappelle, Peter J. Koudstaal, Simon P. Mooijaart, Wiro Niessen, Robert van Oostenbrugge, Albert de Roos, Albert C. van Rossum, and Mat J. Daemen. The authors thank the staff at the Rotterdam Study research center for facilitating assessment of participants, Frank J.A. van Rooij for serving as data manager, and Jessica C. Kiefte-De Jong for assistance with the data on dietary intake.
Glossary
- AD
Alzheimer disease
- CI
confidence interval
- DSM-III-R
Diagnostic and Statistical Manual of Mental Disorders, 3rd edition, revised
- FA
fractional anisotropy
- GMS
Geriatric Mental Schedule
- HDL
high-density lipoprotein
- HR
hazard ratio
- MD
mean diffusivity
- MMSE
Mini-Mental State Examination
- WMH
white matter hyperintensity
Appendix. Coinvestigators
Author contributions
All authors made a substantial intellectual contribution to design of the study (M.W.V., M.A.I.), acquisition of data (P.J.K., M.K.I., H.I.Z., L.G.M.C., S.L., F.J.W.), analysis and interpretation of data (F.J.W., M.A.I.), drafting the manuscript (F.J.W.), or revising it critically for important intellectual content (H.I.Z., S.L., L.G.M.C., P.J.K., M.K.I., M.W.V., M.A.I.). All authors approved the final version of the manuscript for publication. M.A.I. had full access to the data in the study and takes responsibility for data integrity and accuracy of data analysis.
Study funding
The Heart–Brain Connection Consortium is supported by the Netherlands Cardiovascular Research Initiative (CVON2012-06). The Rotterdam Study is sponsored by the Erasmus Medical Centre and Erasmus University Rotterdam, The Netherlands Organization for Scientific Research (NWO), The Netherlands Organization for Health Research and Development (ZonMW), the Research Institute for Diseases in the Elderly (RIDE), The Netherlands Genomics Initiative, the Ministry of Education, Culture and Science, the Ministry of Health, Welfare and Sports, the European Commission (DG XII), and the Municipality of Rotterdam. Further support was obtained from the Netherlands Consortium for Healthy Ageing and the Dutch Heart Foundation (2012T008). None of the funding organizations or sponsors was involved in study design, in collection, analysis, or interpretation of data, in writing of the report, or in the decision to submit the article for publication.
Disclosure
The authors report no disclosures relevant to the manuscript. Go to Neurology.org/N for full disclosures.
References
- 1.De Benoist B, McLean E, Egli I, Cogswell M, eds. Worldwide Prevalence of Anaemia 1993-2005 [Internet]. World Health Organization; Centers for Disease Control and Prevention Atlanta. 2008. Available at: apps.who.int/iris/bitstream/10665/43894/1/9789241596657_eng.pdf. Accessed November 25, 2017. [Google Scholar]
- 2.Patel KV. Epidemiology of anemia in older adults. Semin Hematol 2008;45:210–217. [DOI] [PMC free article] [PubMed] [Google Scholar]
- 3.Guralnik JM, Eisenstaedt RS, Ferrucci L, Klein HG, Woodman RC. Prevalence of anemia in persons 65 years and older in the United States: evidence for a high rate of unexplained anemia. Blood 2004;104:2263–2268. [DOI] [PubMed] [Google Scholar]
- 4.Gagnon DR, Zhang TJ, Brand FN, Kannel WB. Hematocrit and the risk of cardiovascular disease: the Framingham Study: a 34-year follow-up. Am Heart J 1994;127:674–682. [DOI] [PubMed] [Google Scholar]
- 5.Gotoh S, Hata J, Ninomiya T, et al. Hematocrit and the risk of cardiovascular disease in a Japanese community: the Hisayama Study. Atherosclerosis 2015;242:199–204. [DOI] [PubMed] [Google Scholar]
- 6.Panwar B, Judd SE, Warnock DG, et al. Hemoglobin concentration and risk of incident stroke in community-living adults. Stroke 2016;47:2017–2024. [DOI] [PMC free article] [PubMed] [Google Scholar]
- 7.Izaks GJ, Westendorp RG, Knook DL. The definition of anemia in older persons. JAMA 1999;281:1714–1717. [DOI] [PubMed] [Google Scholar]
- 8.Mindell J, Moody A, Ali A, Hirani V. Using longitudinal data from the Health Survey for England to resolve discrepancies in thresholds for haemoglobin in older adults. Br J Haematol 2013;160:368–376. [DOI] [PubMed] [Google Scholar]
- 9.International AD. World Alzheimer report 2016 [Internet]. Available at: alz.co.uk/research/WorldAlzheimerReport2016.pdf. Accessed October 26, 2016.
- 10.Perry RT, Gearhart DA, Wiener HW, et al. Hemoglobin binding to A beta and HBG2 SNP association suggest a role in Alzheimer's disease. Neurobiol Aging 2008;29:185–193. [DOI] [PMC free article] [PubMed] [Google Scholar]
- 11.Chuang JY, Lee CW, Shih YH, Yang T, Yu L, Kuo YM. Interactions between amyloid-β and hemoglobin: implications for amyloid plaque formation in Alzheimer's disease. PLoS One 2012;7:e33120. [DOI] [PMC free article] [PubMed] [Google Scholar]
- 12.Atti AR, Palmer K, Volpato S, Zuliani G, Winblad B, Fratiglioni L. Anaemia increases the risk of dementia in cognitively intact elderly. NBA 2006;27:278–284. [DOI] [PubMed] [Google Scholar]
- 13.Shah RC, Buchman AS, Wilson RS, Leurgans SE, Bennett DA. Hemoglobin level in older persons and incident Alzheimer disease: prospective cohort analysis. Neurology 2011;77:219–226. [DOI] [PMC free article] [PubMed] [Google Scholar]
- 14.Hong CH, Falvey C, Harris TB, et al. Anemia and risk of dementia in older adults: findings from the Health ABC study. Neurology 2013;81:528–533. [DOI] [PMC free article] [PubMed] [Google Scholar]
- 15.Ikram MA, Brusselle GGO, Murad SD, et al. The Rotterdam Study: 2018 update on objectives, design and main results. Eur J Epidemiol 2017;32:807–850. [DOI] [PMC free article] [PubMed] [Google Scholar]
- 16.World Health Organization. Haemoglobin Concentrations for the Diagnosis of Anaemia and Assessment of Severity [Internet]. 2011. Available at: who.int/vmnis/indicators/haemoglobin/en/. Accessed August 15, 2017. [Google Scholar]
- 17.Hoffbrand V, Provan D. ABC of clinical haematology: macrocytic anaemias. BMJ 1997;314:430–433. [DOI] [PMC free article] [PubMed] [Google Scholar]
- 18.de Bruijn RFAG, Bos MJ, Portegies MLP, et al. The potential for prevention of dementia across two decades: the prospective, population-based Rotterdam Study. BMC Med 2015;13:132. [DOI] [PMC free article] [PubMed] [Google Scholar]
- 19.Vrooman HA, Cocosco CA, van der Lijn F, et al. Multi-spectral brain tissue segmentation using automatically trained k-Nearest-Neighbor classification. Neuroimage 2007;37:71–81. [DOI] [PubMed] [Google Scholar]
- 20.de Groot M, Ikram MA, Akoudad S, et al. Tract-specific white matter degeneration in aging: the Rotterdam Study. Alzheimers Dement 2015;11:321–330. [DOI] [PubMed] [Google Scholar]
- 21.Vernooij MW, van der Lugt A, Ikram MA, et al. Total cerebral blood flow and total brain perfusion in the general population: the Rotterdam Scan Study. J Cereb Blood Flow Metab 2008;28:412–419. [DOI] [PubMed] [Google Scholar]
- 22.Voortman T, Kiefte-de Jong JC, Ikram MA, et al. Adherence to the 2015 Dutch dietary guidelines and risk of non-communicable diseases and mortality in the Rotterdam Study. Eur J Epidemiol 2017;32:993–1005. [DOI] [PMC free article] [PubMed] [Google Scholar]
- 23.World Health Organization, International Diabetes Federation. Definition and Diagnosis of Diabetes Mellitus and Intermediate Hyperglycemia: Report of a WHO/IDF Consultation. Geneva: WHO; 2006. [Google Scholar]
- 24.Mosterd A, Hoes AW, de Bruyne MC, et al. Prevalence of heart failure and left ventricular dysfunction in the general population; the Rotterdam Study. Eur Heart J 1999;20:447–455. [PubMed] [Google Scholar]
- 25.VanderWeele TJ, Ding P. Sensitivity analysis in observational research: Introducing the E-value. Ann Intern Med 2017;167:268–274. [DOI] [PubMed] [Google Scholar]
- 26.Lopes da Silva S, Vellas B, Elemans S, et al. Plasma nutrient status of patients with Alzheimer's disease: systematic review and meta-analysis. Alzheimers Dement 2014;10:485–502. [DOI] [PubMed] [Google Scholar]
- 27.Li DD, Zhang W, Wang ZY, Zhao P. Serum copper, zinc, and iron levels in patients with Alzheimer's disease: a meta-analysis of case-control studies. Front Aging Neurosci 2017;9:300. [DOI] [PMC free article] [PubMed] [Google Scholar]
- 28.Ayton S, Diouf I, Bush AI, Alzheimer's Disease Neuroimaging Initiative. Evidence that iron accelerates Alzheimer's pathology: a CSF biomarker study. J Neurol Neurosurg Psychiatry 2018;89:456–460. [DOI] [PubMed] [Google Scholar]
- 29.van der Veen PH, Muller M, Vincken KL, et al. Hemoglobin, hematocrit, and changes in cerebral blood flow: the second manifestations of ARTerial disease-Magnetic Resonance study. Neurobiol Aging 2015;36:1417–1423. [DOI] [PubMed] [Google Scholar]
- 30.Wolters FJ, Zonneveld HI, Hofman A, et al. Cerebral perfusion and the risk of dementia: a population-based study. Circulation 2017;136:719–728. [DOI] [PubMed] [Google Scholar]
- 31.Hare GM. Anaemia and the brain. Curr Opin Anaesthesiol 2004;17:363–369. [DOI] [PubMed] [Google Scholar]
- 32.Ashok BS, Ajith TA, Sivanesan S. Hypoxia-inducible factors as neuroprotective agent in Alzheimer's disease. Clin Exp Pharmacol Physiol 2017;44:327–334. [DOI] [PubMed] [Google Scholar]
- 33.Shah RC, Schneider JA, Leurgans S, Bennett DA. Association of lower hemoglobin level and neuropathology in community-dwelling older persons. J Alzheimers Dis 2012;32:579–586. [DOI] [PMC free article] [PubMed] [Google Scholar]
- 34.Park SE, Kim H, Lee J, et al. Decreased hemoglobin levels, cerebral small-vessel disease, and cortical atrophy: among cognitively normal elderly women and men. Int Psychogeriatr 2016;28:147–156. [DOI] [PubMed] [Google Scholar]
- 35.Hare D, Ayton S, Bush A, Lei P. A delicate balance: iron metabolism and diseases of the brain. Front Aging Neurosci 2013;5:34. [DOI] [PMC free article] [PubMed] [Google Scholar]
- 36.Faux NG, Rembach A, Wiley J, et al. An anemia of Alzheimer's disease. Mol Psychiatry 2014;19:1227–1234. [DOI] [PubMed] [Google Scholar]
- 37.Ayton S, Fazlollahi A, Bourgeat P, et al. Cerebral quantitative susceptibility mapping predicts amyloid-β-related cognitive decline. Brain 2017;140:2112–2119. [DOI] [PubMed] [Google Scholar]
- 38.Keohane C, McMullin MF, Harrison C. The diagnosis and management of erythrocytosis. BMJ 2013;347:f6667. [DOI] [PubMed] [Google Scholar]
- 39.Landolfi R, Marchioli R, Kutti J, et al. Efficacy and safety of low-dose aspirin in polycythemia vera. N Engl J Med 2004;350:114–124. [DOI] [PubMed] [Google Scholar]
- 40.Coull BM, Beamer N, de Garmo P, et al. Chronic blood hyperviscosity in subjects with acute stroke, transient ischemic attack, and risk factors for stroke. Stroke 1991;22:162–168. [DOI] [PubMed] [Google Scholar]
- 41.Li RY, Cao ZG, Li Y, Wang RT. Increased whole blood viscosity is associated with silent cerebral infarction. Clin Hemorheol Microcirc 2015;59:301–307. [DOI] [PubMed] [Google Scholar]
- 42.Kusunoki M, Kimura K, Nakamura M, Isaka Y, Yoneda S, Abe H. Effects of hematocrit variations on cerebral blood flow and oxygen transport in ischemic cerebrovascular disease. J Cereb Blood Flow Metab 1981;1:413–417. [DOI] [PubMed] [Google Scholar]
- 43.Barnes AJ, Locke P, Scudder PR, Dormandy TL, Dormandy JA, Slack J. Is hyperviscosity a treatable component of diabetic microcirculatory disease? Lancet 1977;2:789–791. [DOI] [PubMed] [Google Scholar]
- 44.Grotemeyer KC, Kaiser R, Grotemeyer KH, Husstedt IW. Association of elevated plasma viscosity with small vessel occlusion in ischemic cerebral disease. Thromb Res 2014;133:96–100. [DOI] [PubMed] [Google Scholar]
- 45.Patel KV, Harris TB, Faulhaber M, et al. Racial variation in the relationship of anemia with mortality and mobility disability among older adults. Blood 2007;109:4663–4670. [DOI] [PMC free article] [PubMed] [Google Scholar]
Associated Data
This section collects any data citations, data availability statements, or supplementary materials included in this article.
Data Availability Statement
Data can be obtained on request. Requests should be directed toward the management team of the Rotterdam Study (secretariat.epi@erasmusmc.nl), which has a protocol for approving data requests. Because of restrictions based on privacy regulations and informed consent of the participants, data cannot be made freely available in a public repository.