Abstract
Objective
The huntingtin gene is critical for the formation and differentiation of the CNS, which raises questions about the neurodevelopmental effect of CAG expansion mutations within this gene (mHTT) that cause Huntington disease (HD). We sought to test the hypothesis that child and adolescent carriers of mHTT exhibit different brain growth compared to peers without the mutation by conducting structural MRI in youth who are at risk for HD. We also explored whether the length of CAG expansion affects brain development.
Methods
Children and adolescents (age 6–18) with a parent or grandparent diagnosed with HD underwent MRI and blinded genetic testing to confirm the presence or absence of mHTT. Seventy-five individuals were gene-expanded (GE) and 97 individuals were gene-nonexpanded (GNE). The GE group was estimated to be on average 35 years from clinical onset. Following an accelerated longitudinal design, age-related changes in brain regions were estimated.
Results
Age-related striatal volume changes differed significantly between the GE and GNE groups, with initial hypertrophy and more rapid volume decline in GE. This pattern was exaggerated with CAG expansion length for CAG > 50. A similar age-dependent group difference was observed for the globus pallidus, but not in other major regions.
Conclusion
Our results suggest that pathogenesis of HD begins with abnormal brain development. An understanding of potential neurodevelopmental features associated with mHTT may be needed for optimized implementation of preventative gene silencing therapies, such that normal aspects of neurodevelopment are preserved as neurodegeneration is forestalled.
Huntington disease (HD) is a lethal neurodegenerative disorder characterized by motor abnormalities, cognitive impairments, and psychiatric problems. These symptoms are accompanied by widespread neurodegeneration that likely starts in the striatum.1,2 HD is caused by a CAG trinucleotide repeat expansion in the huntingtin gene (HTT), which encodes an expanded polyglutamine stretch in the huntingtin protein (OMIM 143100). Animal model and molecular research studies have demonstrated that the huntingtin protein mediates a variety of CNS developmental processes.3–8 The presence of HTT CAG expansion (mHTT) may compromise neuronal homeostasis throughout development, ultimately leading to premature cell death from otherwise nonlethal stressors such as aging.1,9 Prior to neuronal death, mHTT may cause subclinical neurodevelopmental abnormalities.1,9 The effect of mHTT on neurodevelopment has yet to be studied in humans.
With disease-modifying therapies underway,10 the HD community will have to determine optimum timing for the introduction of gene-silencing therapies, requiring knowledge of the neurodevelopmental features associated with mHTT. The Kids-HD study includes a unique cohort of children and adolescents who are at risk for adult-onset HD.11 Our main goal was to determine if child and adolescent mHTT carriers exhibited different brain growth as measured with MRI compared to peers without mHTT. In addition, we wanted to establish if CAG repeat expansion length modulated children's brain morphology, as CAG expansion length is related to onset and severity of HD.12,13 We hypothesized that the presence of mHTT would result in differential developmental trajectories in areas of primary pathologic importance, that is, the striatum in HD. We also hypothesized that the extent of developmental abnormalities was dependent on CAG repeat length.
Methods
Participants
Children and adolescents who participated in the Kids-HD study had a parent or grandparent with HD and were recruited from across the United States. Adults with HD were approached at the University of Iowa Huntington's Disease Center of Excellence and at annual conferences of the Huntington's Disease Society of America to gauge their interest in having their offspring participate in the Kids-HD study. Research staff also attended community events for Help4HD and WeHaveAFace to provide study information, and brochures were distributed at HD Centers of Excellence within the United States. Participants were brought to the University of Iowa Hospitals & Clinics to undergo testing. Recruitment and assessments took place between May 2009 and January 2018.
Standard protocol approvals, registrations, and patient consent
Given the ethical concerns surrounding predictive genetic testing for HD in individuals <18 years,14 the Kids-HD study included a pipeline to conduct genetic testing while maintaining participant, family, clinical, and researcher blindness to individuals' genetic status. Parents/caregivers consented that (1) the child's blood sample would be analyzed for the HD mutation; and (2) that results would not be disclosed to anyone, including the child, themselves (parents/caregivers), or clinical and research staff of the study. De-identified genetic results were maintained by a team member who had no contact with participants. Staff who had direct contact with participants did not have access to the de-identified genetic results. To limit risk of identification within this report, study results will only be shown as aggregated statistics and statistical model fits. All procedures and study-related communications with participant families were conducted in accordance with a written protocol approved by the University of Iowa Hospitals & Clinics Institutional Review Board (ClinicalTrials.gov identifier NCT01860339). Informed consent or assent was obtained from all participants, and informed consent was obtained from participants' parents/guardians.
Prior to participation, parents/caregivers answered screening questions to determine the child's eligibility. First, parents/caregivers were asked about their child's knowledge of HD. Children were ineligible if they did not have an age-appropriate awareness that HD runs in families and that they were at risk. Second, since we were interested in modeling pre-disease developmental trajectories, participants were screened for Juvenile Onset HD by asking parents/caregivers if their child manifested any symptoms that could be considered consistent with HD. If any concerns were noted, children were not eligible for the present study and were referred a pediatric neurologist for clinical assessment. Third, children with a history of brain tumors, epilepsy, or heart surgery were excluded. Fourth, participants were screened for any MRI contraindications, including hearing aids and metal in their body that could not be removed.
Post-participation exclusion criteria included (1) being within 10 years of estimated disease onset; and (2) exhibiting clinical motor symptoms. We excluded data from 2 individuals who were estimated to be within 10 years from disease onset, using the age-of-onset estimation of Langbehn and colleagues.12 The motor assessments of the Unified Huntington's Rating Scale (UHDRS) was used to determine if motor abnormalities were already evident. The UHDRS motor assessments includes 15 measurements relevant to HD,15 which are summed to create a total motor score. A few children in both the GE and GNE groups received modestly elevated motor scores with no other clinical sign of HD, likely related to their age (data available from Dryad, figure e-1A and B, doi.org/10.5061/dryad.2bj22pd). The GE and GNE groups did not differ in total motor scores (age- and sex-adjusted mean difference = 0.11, t(112) = 0.39, p = 0.697. Nor did any of the participant exhibit motor abnormalities that are considered unequivocal signs of the HD, as indicated by the Diagnosis Confidence Level question on the UHDRS.
We used an accelerated longitudinal design (ALD), a commonly used method for studying brain development in children and adolescents.16 ALD includes a cross-sectional and longitudinal component, enabling coverage of a wide age-range within a short study duration. Moreover, ALD is less vulnerable than single cohort designs to unforeseen changes in study procedures such as scanner changes.16 Participants began at different ages and contributed data for a portion of the age-range of interest. Consistent with ALD, some participants were examined once, while others were assessed on multiple occasions with variable length of follow-up. Figure 1 illustrates how the age trajectory of cerebral volume is estimated in an ALD design.
Figure 1. Illustration of accelerated longitudinal design.
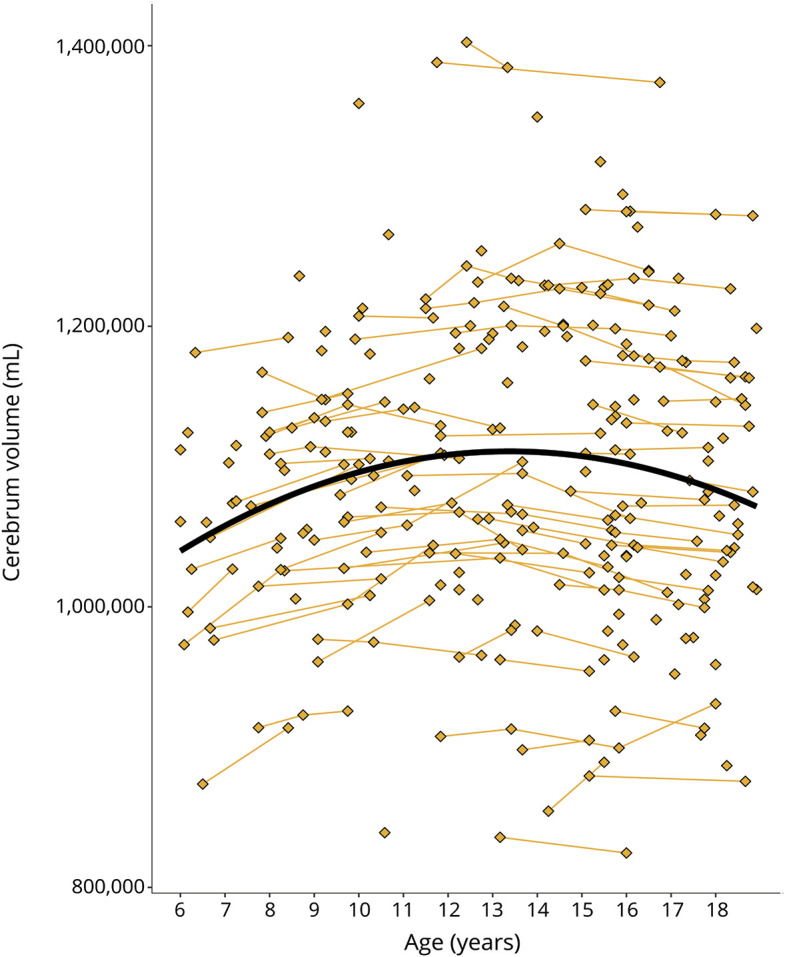
Age is shown on the x-axis and cerebrum volume (gray and white matter combined) is shown on the y-axis. Single diamonds represent a single observation in an individual, while connected diamonds show repeated observations within the same individual. The thick, black line illustrates the growth curve across age based on a combination of cross-sectional and longitudinal components. To preserve gene status confidentiality, the figure illustrates the combined gene-expanded and gene-nonexpanded groups.
Genetic analyses
Presence or absence of CAG expansion was established using DNA from blood or saliva. PCR analyses were conducted by the University of Iowa Molecular Diagnostic Laboratory to determine the size of the expansion in exon 1 of the HTT gene on chromosome 4p16.3.11 Blinding and confidentiality protocols were explained above.
Image acquisition
Individuals who participated before June 2016 (n = 219) were scanned with a 3T Siemens Trio TIM (Siemens AG, Munich, Germany). Those enrolled after June 2016 (n = 62) were scanned on a 3T General Electric Discovery MR750w (GE Medical Systems, Chicago, IL). Anatomical T1-weighted images were acquired with 1.1 mm isotropic resolution, with the following scanning parameters for Siemens (GE parameters in parentheses): coronal MPRAGET1 (MPRAGEPROMO), TR = 2,300 (8.392) ms, TE = 2.87 (3.1) ms, TI = 900 (900) ms, flip angle = 10 (12)°, FOV = 282 × 282 × 264 mm (282 × 282 × 260), matrix = 256 × 256 × 240 (256 × 256 × 236). Real-time prospective motion correction (PROMO) was employed to reduce movement related artifacts.17
Image processing
We used Advanced Normalization Tools (ANTs)18 to correct for intensity inhomogeneity within images using the N4 algorithm.19 Images were then processed using BrainsTools software,20 which optimizes tissue classification through an iterative framework, producing robust results in a multi-site setting. Brain regions were labeled using a joint label fusion (JLF) approach21 as implemented in ANTs and incorporated into BrainsTools; labels were based on the Desikan-Killiany atlas22 which contain gray and white cortical regions and subcortical structures. Eight scans could not be processed due to poor image quality related to motion (n = 6; mean age = 8.4 [SD = 2.7]; 4 females) or artifacts of dental braces (n = 2; mean age = 17 [SD = 0.06]; 1 female). Anatomical ROIs included intracranial volume (ICV) (total gray, white and CSF volume combined), cerebellum, cerebrum (i.e., frontal, parietal, temporal and occipital volumes combined), striatum, globus pallidus (including external and internal segments), amygdala and hippocampus. Estimated volumes from the 2 hemispheres were combined. For the cerebrum and the cerebellum, gray and white matter were combined. Inter-scanner variation in volume measurements were harmonized using an empirical Bayesian approach,23 as implemented by the ez.combat toolbox in R.24 After harmonization, ROI distributions were compared with Kolmogorov-Smirnov tests across scanner and group. The distributions were quite similar except for minimal differences in the cerebellum and globus pallidus (figure e-2, doi.org/10.5061/dryad.2bj22pd). We corrected for residual scanner differences in those regions within the statistical analyses below.
Statistical analyses
It is common to correct regional volume for ICV. However, we observed that control group ratios of subcortical volumes to ICV varied by age and sex. Thus, these ratios lead to no standardization across age and sex. For clarity, we chose to analyze absolute brain volumes rather than anatomical ratios.
We estimated non-linear regression models for the relationship of brain volumes to age. To account for non-independence of longitudinal measures and similarity among siblings, we fitted mixed-effect regression models, which included random effects per subject and per family. Within-subject and residual variances were estimated separately for the GE and GNE groups via iteratively re-weighted least squares, because there was notably greater variation within the GE group in some cases. We fitted the models by maximum likelihood, thus retaining validity of nested likelihood ratio tests (LRT). F test degrees of freedom were estimated by the Kenward-Rogers method. We estimated non-linearity with respect to age using restricted cubic splines,25 which provide great flexibility for describing nonlinear patterns while still retaining legitimacy for LRT inference. The degree of age nonlinearity was chosen using a limited forward selection procedure, beginning with a linear relationship, and successively adding up to 5 spline knots if each added knot was nominally statistically significant (p ≤ 0.05). All models were controlled for potential baseline effects of gene-group by sex interactions. The models for cerebellum and globus pallidus volume were adjusted to account for residual scanner effects (figure e-2, doi.org/10.5061/dryad.2bj22pd). Age by sex, age by group, and sex by group interactions were tested in 2 steps: First we tested for linear interactions with aging. Second, we tested collectively for interactions with the non-linear spline components of aging. Only significant interactions were retained in the models.
The potential effect of CAG repeat expansion length in the GE group was tested in 2 ways. First, we tested for a main effect and linear age interaction of CAG across the entire expanded repeat range (36–59), by nesting these terms within the GE group. Second, we tested if a detectable CAG effect was apparent in CAG repeats >50. This cutoff was chosen because CAG > 50 have been associated with noticeable faster disease progression in adults,12 as well a risk of Juvenile Onset HD.26 By adding a piecewise continuous linear term, we tested for detectable linear effects beginning at CAG length 51. Finally, when there was evidence of a CAG effect using either of these methods, we further explored whether the CAG effect was better fit via restricted cubic splines. There were no instances in which such splines provided a better model fit. We fit all models using Base SAS 9.4 and Proc Mixed from the concomitant SAS/STAT 14.1.
Data availability
The de-identified data supporting the findings reported here can be made available upon reasonable request.
Results
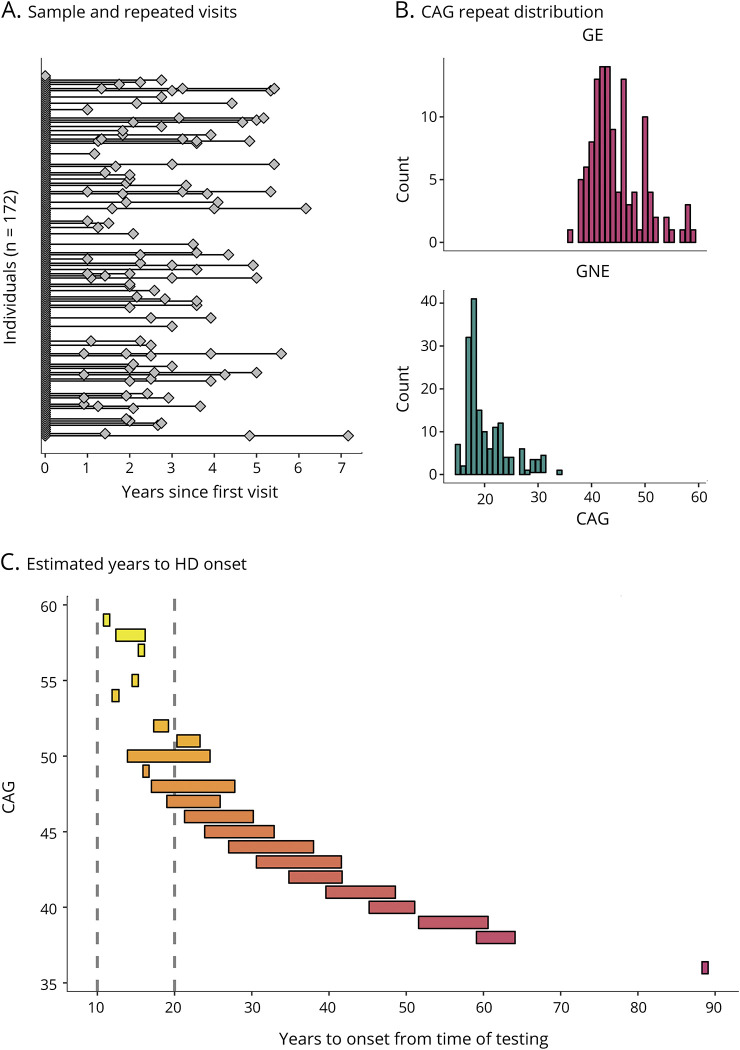
Table summarizes key features of the sample. In total, 172 individuals were included in the study, with 75 individuals in the GE group (46 females; 29 males), and 97 individuals in the GNE group (50 females; 47 males). These proportions were not significantly different, χ2 (1, N = 172) = 1.27, p = 0.25. Eighty-seven individuals (51%) were assessed once, and 85 individuals (49%) were assessed more than once (figure 2A), providing 281 observations total (119 GE; 162 GNE; table). The sample included significantly more observations from females (observations = 164) than males (observations = 117), χ2 (1, N = 281) = 7.86, p = 0.005. Note that all imaging models were adjusted for sex. Individuals in the GE group were on average 13.0 years old at first evaluation (SD = 3.8), and individuals in the GNE were 12.7 years old (SD = 3.6). The difference was not significant, t (160) = −0.5, p = 0.643.
Table.
Demographics across age, group, and sex (number of observations)
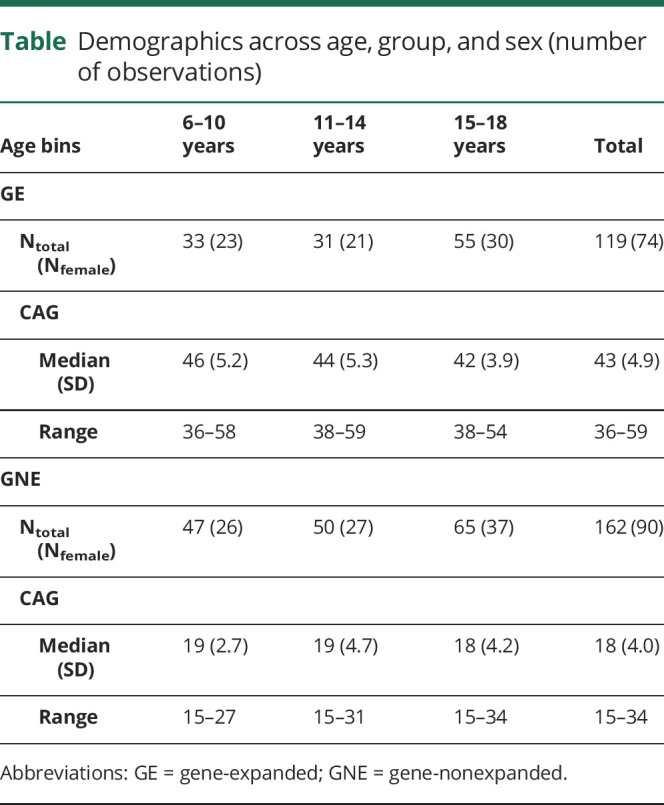
Figure 2. Sample characteristics.
(A) Individuals (diamonds) and repeated observations within the same individual (connected diamonds). The sample included 172 unique individuals (stacked at x = 0), a subset of whom were assessed more than once (connected diamonds). (B) Distribution of CAG repeats among individuals in the gene-expanded (GE) range (top panel) and in the gene-nonexpanded (GNE) range (bottom panel). (C) The range of estimated years to Huntington disease (HD) onset from time of testing (x-axis) for each CAG repeat observed in the sample (y-axis). For instance, for CAG = 50, the range was 14–30 years to estimated disease onset from the time of testing. Hotter colors represent higher CAG repeats and the vertical, dashed lines mark 10 and 20 years from disease onset, respectively.
CAG repeat length ranged from 36 to 59 in the GE group and from 15 to 34 in the GNE group (table and figure 2B). Applying the age-of-onset estimation of Langbehn and colleagues,12 84% of individuals in the GE range were estimated to be at least 2 decades from disease onset, and 16% were estimated to be within 10–20 years from onset (figure 2C).
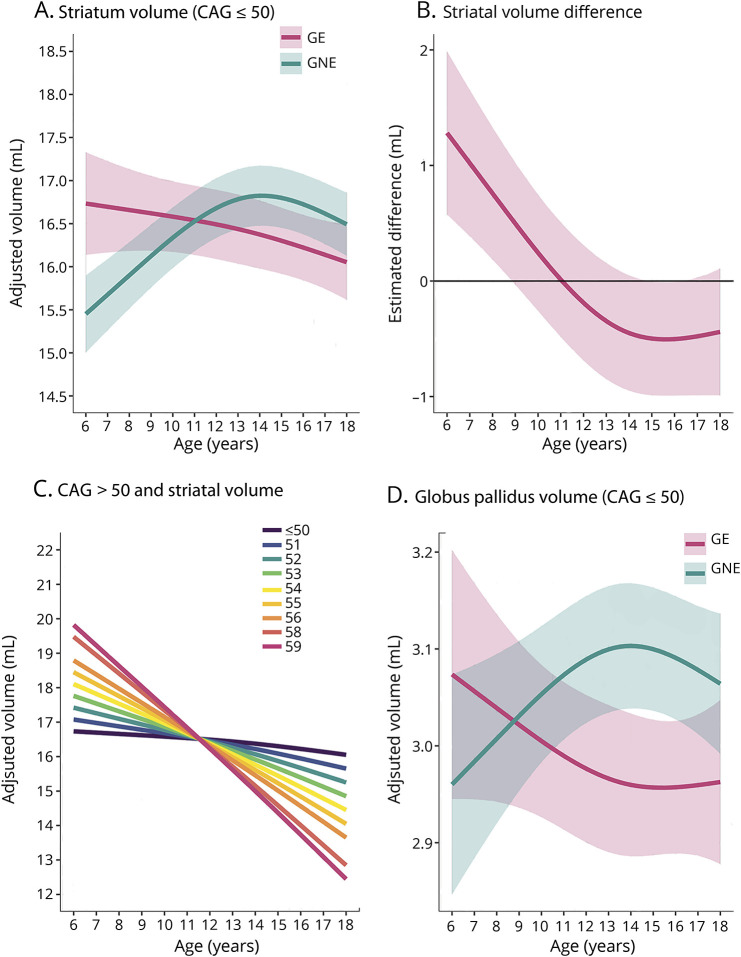
There was a significant, non-linear difference between the GE and GNE group in age trajectories of the striatum (figure 3A). This difference was independent of sex. Overall age-dependent difference F (2, 114) = 12.62, p = 3.8 × 10⁻⁷; nonlinear component of the difference F (1, 93.2) = 9.20, p = 0.0031. Detailed statistical models can be found in data available from Dryad (table e-1, doi.org/10.5061/dryad.2bj22pd). The GNE group exhibited initial striatal growth until approximately 14 years of age, followed by decline in striatal volume; this pattern of normal development has been reported previously.27,28 In contrast, the developmental trajectory for the GE group was strikingly different. The GE group exhibited significant striatal hypertrophy prior to the age of 10, compared to individuals in the GNE group (figure 3B). Then, between age 10 and 14, the striatum steadily decreased in volume in the GE group, but continued to increase in the GNE group. From age 14 to 18, the rate of volume loss was similar in both groups. The upper boundary of the 95% confidence interval for volume differences between groups fluctuated just above or below zero throughout this age range (figure 3B).
Figure 3. Developmental trajectories of the striatum, striatal volume difference between gene-expanded (GE) and gene-nonexpanded (GNE), impact of CAG repeat expansion, and developmental trajectories of the globus pallidus.
(A) Mean estimated age-dependent change of striatal volume in the GE (red) and GNE (green) groups. Note that the GE curve is based on individuals with CAG ≤50, and that results were averaged across sex. (B) Striatal volume difference (y-axis) between GE group (red) and GNE group (horizontal, black line) across age (x-axis), along with 95% confidence limits of the difference scores. (C) The impact of CAG repeat length on striatal volume (y-axis) across age (x-axis). CAG repeats ≤50 did not affect striatal growth curves (horizontal line labeled ≤50). For repeats >50, additional repeats were associated with accelerated striatal decline in adolescence, and possibly with greater hypertrophy before age 10. (D) Mean estimated age-dependent change of the globus pallidus.
The magnitude of striatal volume difference between GE and GNE did not detectably vary as a function of CAG repeat length for CAG repeats ≤50. However, the age by CAG interaction was significant for CAG > 50 (figure 3C). For the later-age (12–18) epoch, greater repeats were associated with faster rates of volume decline (figure 3C). The estimated difference in rate of striatal volume decline was 0.062 mL per incremental CAG repeat per year, t (63.9) = −3.50, p = 0.001 (figure 3C). The model also predicts that early-age (6–11 years) striatal hypertrophy varies as a function of CAG repeat length, with each incremental repeat >50 being associated with greater hypertrophy. However, there were few observations among young children with such high CAG repeat expansions, and that prediction should be interpreted with caution. There was no detectable effect of CAG repeat length on other brain regions considered in the analyses.
Like the striatum, a significant age-dependent difference between groups was observed for the globus pallidus (figure 3D). Overall age-dependent group difference F = 6 × 65 [2, 181] p = 0·0016; nonlinear difference F = 6 × 76 [1, 147] p = 0.010). Sex effects did not differ significantly between groups. Model details are available in table e-2 (doi.org/10.5061/dryad.2bj22pd).
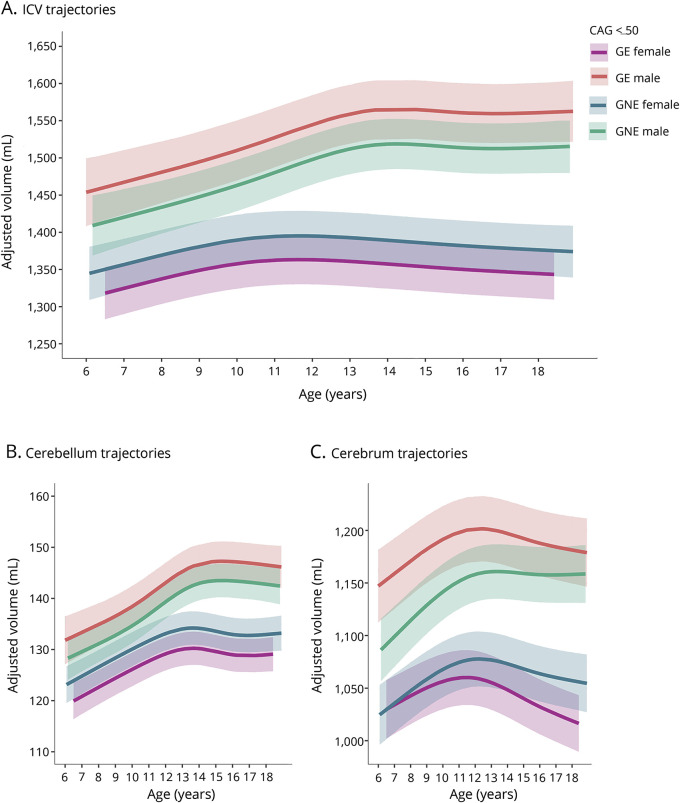
A significant genetic group by sex interaction was observed for ICV, cerebellum, and cerebrum volume (figure 4, A–C; model details available in tables e-3–e-5, doi.org/10.5061/dryad.2bj22pd). Across these regions, males exhibited larger volumes than did females, and this sex-related volumetric difference was significantly larger in the GE group than the GNE group, that is, the primary sex effect was exaggerated. Additionally, a significant age by group interaction effect was detected for cerebral volume (figure 2C), where we observed age-dependent decline in the GE group but not the GNE group, independent of sex.
Figure 4. Age-dependent changes of intracranial volume (ICV), cerebellum, and cerebrum for CAG ≤50.
(A) Age-dependent change of ICV was comparable between groups but differed between male and female participants, F4,113 = 11.06, p = 1.82 × 10⁻⁷. The volume difference between male and female participants was significantly larger in the gene-expanded (GE) group than the gene-nonexpanded (GNE) group (GE vs GNE sex difference = 78.9 mL, SE = 31.5 mL, t [121] = 2.51, p = 0.0135). (B) The groups did not differ significantly in age-related change of the cerebellum. The difference in cerebellum volume between male and female participants was significantly larger in the GE group than the GNE group (GE vs GNE sex difference = 7.72 mL, SE = 3.08 mL, t [137] = 2.51, p = 0.0134). (C) The sex-dependent volume difference was also significantly greater in GE than in GNE for the cerebrum (difference = 61.37 mL, SE = 24.90, t [127] = 2.46, p = 0.0115. In addition, age-dependent decline of the cerebrum was significantly faster in the GE group than the GNE group (−3.33 mL/y, SE = 0.94, t [119] = −3.54, p = 0.0006).
Thalamic volume difference between females and males increased with age, and this age-dependent increase was significantly greater in the GE group than in the GNE group (overall age by sex dependent group difference F3,117 = 3.16, p = 0.0273; nonlinear difference F2,113 = 3.11, p = 0.0489; model details in data available from Dryad (table e-6, doi.org/10.5061/dryad.2bj22pd). Finally, although age and sex were predictive of amygdala and hippocampus volume, these volumes did not differ significantly between the GE and GNE group (Model details available from data available from Dryad, table e-7 and e-8, doi.org/10.5061/dryad.2bj22pd).
Discussion
The present work represents the first neuroimaging study in pre-HD child and adolescent carriers of mutant huntingtin (mHTT). We showed that developmental trajectories in the striatum and globus pallidus were markedly different between the GE and GNE group. The GNE group exhibited the expected, non-linear pattern of early growth (ages 6–12 years old), followed by volume loss likely driven by synaptic pruning.27,29 In contrast, volume change in the GE group was characterized by a nearly linear decline starting from the earliest age assessed (6 years old). The striking difference in developmental patterns suggests that pathogenesis of HD begins with abnormal brain development, where children who carry the gene expansion exhibit different trajectories of brain growth than those who did not inherit the expansion. All participants came from families that are struggling with emotional, financial, and practical impact of HD. The chief difference between the groups was the presence or absence of mHTT, underscoring the notion that the developmental aberrations observed in the striatum are primarily driven by the gene mutation, not by environmental factors. Results will be discussed in the context of abnormal brain development in HD, the impact of CAG repeat length, the impact of sex, and potential implications for gene therapy.
Abnormal brain development in HD
The principal pathophysiology in HD is classically conceptualized as degeneration of striatal medium spiny neurons (MSNs).2,3,30 One of the primary projection targets of the striatum is the globus pallidus,31,32 where changes to these efferent nerve fibers due to mHTT may underly the observed similarities between striatal and globus pallidus trajectories in mHTT carriers. Our results support the hypothesis initially expressed by Mehler and Gokhan,9 postulating that neurodegenerative diseases begin with aberrant brain development in regional neuronal subpopulations. Both molecular studies7,8 and work in mice33 have demonstrated that degeneration of MSNs is preceded by abnormal development of these cells.34 Our observed differences in the development trajectory of striatal and globus pallidus volume in child and adolescent carriers of mHTT complement the notion of abnormal neural development in HD. Notably, both loss of wild-type HTT and the presence of mHTT are thought to compromise neurodevelopment.34 Dysregulated huntingtin may disrupt cellular homeostastasis, which makes affected neuronal subpopulations vulnerable to succumb to normally non-lethal stressors and premature death.9
Despite abnormalities in cellular homeostasis, transgenic mice harboring the mHTT mutation do not exhibit obvious developmental defects observed in corresponding knock-out mice.9,33 Compensatory mechanisms within the affected neural circuits involving their non-striatal components (such as the cerebellum) may reduce initial functional problems. Our prior work demonstrated that wild-type HTT is important in shaping striato-cerebellar circuitry.11 In Juvenile Onset HD, the cerebellum was proportionally enlarged and appeared uniquely resistant to degeneration that was apparent throughout the brain; this pattern was also consistent across 4 mouse models of HD.35 Several functional neuroimaging studies showed evidence of hypermetabolism in the cerebellum among individuals with HD, which is presumed to reflect compensatory processes.36,37 It is yet to be determined if structural and metabolic features of the cerebellum in HD enable functional compensation for a developmentally abnormal striatum.
Young mHTT carriers exhibited striatal hypertrophy compared with unaffected peers. It should be noted that regional brain hypertrophy has also been documented in neurodevelopmental syndromes such as autism,38 and is typically considered a sign of atypical brain maturation. One pre-clinical study specific to mHTT demonstrated evidence of increased glucose intake in the striatum among young transgenic HD rats, compared to wildtype rats.39 It is possible that increased striatal glucose intake was the result of striatal enlargement. Research studies into mechanisms driving mHTT-related striatal hypertrophy during development are necessary to interpret this finding.
The rate of striatal volume loss is clearly accelerated in adults with the gene expansion40,41; however, we did not observe statistically significant differences in the rate of adolescent striatal volume loss between the GNE and GE group—at least when considering CAG ≤ 50 only. The confidence limits in our models preclude certainty, but the trends suggest that accelerated volume loss associated with mHTT may not occur until after age 18 among individuals with moderate CAG repeat expansion lengths of less than 50 or so.
Effect of CAG repeat expansion
CAG repeat length is a key factor in determining the onset and severity of the HD phenotype.13 In line with prior work in pre-HD adults,42 the striatal developmental pattern in GE was exaggerated in individuals with CAG repeats >50. The model suggested that incremental repeat lengthening was associated with greater initial striatal hypertrophy among young mHTT carriers, as well as faster age-related striatal volume loss. The rapid rate of striatal volume decrease when CAG repeats are longer suggest that critical volume loss resulting in manifest HD symptoms might occur at an earlier age. The effect of CAG repeat length on age-related striatal hypertrophy should be interpreted with caution, however, as the sample included few observations among individuals with >50 repeats in the youngest age range.
Effect of sex
Our group previously reported sex-specific effects of HTT on brain development for CAG repeat ranges below disease threshold.11 Normal variation in CAG repeat length (15–34) was associated with differential cortical volume in female participants, and with different putamen and cerebellum volume in male participants.11 A study using a rat model of HD reported sex-specific differences in glucose uptake across various brain regions.39 Given the additional evidence from this study, both wild-type HTT and mHTT appear to be associated with sex-specific effects on the developing brain. We observed an exaggerated primary sex effect for ICV, cerebellum, cerebrum, and thalamus, where individuals in the GE range exhibited greater sex-related volumetric differences than did unaffected peers. In contrast, in areas of primary pathologic importance—the striatum and the globus pallidus—there were no detectable sex-specific effects. Sex-specific variation in brain phenotypes is not commonly discussed in the context of HD, making it difficult to interpret the clinical significance of sex differences.
Potential implications for gene therapy
Antisense oligonucleotides are currently being tested to delay decline in adult patients in the early phases of clinically manifest HD. These therapies hold the promise of preventative treatments that might forestall or eliminate symptoms before they emerge. However, there are 2 crucial considerations: first, as shown in the present study, mHTT affects brain development in childhood, and perhaps even prenatally. Second, brain development in humans is a prolonged process with maturation occurring through the early 30s.43 Existing studies on neurocognitive changes and biomarkers of mHTT mostly cover individuals in middle adulthood (40s and 50s).41,44,45 Our results highlight a critical need for research in understudied, at-risk populations, including children, teenagers, and young adults. Understanding the brain effects of mHTT knockdown in children and young adults will be essential for the development and optimization of disease modulation and prevention. Strategies to prevent disease onset may have to consider treatment of individuals at a young age, and modulation of a gene involved in brain development may present a conundrum in which alteration of the developmental trajectory may have an unpredictable effect on disease onset and progression. In addition, it is unclear whether the developmental effects of mHTT on the brain are due to gain or loss of function. Some recent evidence suggests that loss-of-huntingtin function contributes to abnormal development of selective neuronal subtypes.34 The potential effect of gene knockdown therapies on neurodevelopment is a crucial consideration for therapeutic intervention.
Acknowledgment
The authors thank the families who participated in this research study.
Glossary
- ALD
accelerated longitudinal design
- HD
Huntington disease
Appendix. Authors


Footnotes
Editorial, page 421
Study funding
Study funded by the National Institute of Neurological Disorders and Stroke and CHDI. The funders did not have any role in the study design, data collection, analysis, or preparation this report.
Disclosure
E. van der Plas reports no disclosures relevant to the manuscript. D.R. Langbehn received funding from the CHDI Foundation during the time of the study and serves or has served as a paid statistical consultant for the design of HD trials for Roche, Voyager, Teva, and Wave Life Sciences pharmaceutical companies. A.L. Conrad, T.R. Koscik, A. Tereshchenko, E.A. Epping, V.A. Magnotta, and P.C. Nopoulos report no disclosures relevant to the manuscript. Go to Neurology.org/N for full disclosures.
References
- 1.Nopoulos PC. Huntington disease: a single-gene degenerative disorder of the striatum. Dialogues Clin Neurosci 2016;18:91–98. [DOI] [PMC free article] [PubMed] [Google Scholar]
- 2.Ross CA, Tabrizi SJ. Huntington's disease: from molecular pathogenesis to clinical treatment. Lancet Neurol 2011;10:83–98. [DOI] [PubMed] [Google Scholar]
- 3.Cattaneo E, Zuccato C, Tartari M. Normal huntingtin function: an alternative approach to Huntington's disease. Nat Rev Neurosci 2005;6:919–930. [DOI] [PubMed] [Google Scholar]
- 4.Godin JD, Colombo K, Molina-Calavita M, et al. Huntingtin is required for mitotic spindle orientation and mammalian neurogenesis. Neuron 2010;67:392–406. [DOI] [PubMed] [Google Scholar]
- 5.Molina-Calavita M, Barnat M, Elias S, Aparicio E, Piel M, Humbert S. Mutant huntingtin affects cortical progenitor cell division and development of the mouse neocortex. J Neurosci 2014;34:10034–10040. [DOI] [PMC free article] [PubMed] [Google Scholar]
- 6.Reiner A, Dragatsis I, Zeitlin S, Goldowitz D. Wild-type huntingtin plays a role in brain development and neuronal survival. Mol Neurobiol 2003;28:259–275. [DOI] [PubMed] [Google Scholar]
- 7.Conforti P, Besusso D, Bocchi VD, et al. Faulty neuronal determination and cell polarization are reverted by modulating HD early phenotypes. Proc Natl Acad Sci USA 2018;115:E762–E771. [DOI] [PMC free article] [PubMed] [Google Scholar]
- 8.Wiatr K, Szlachcic WJ, Trzeciak M, Figlerowicz M, Figiel M. Huntington disease as a neurodevelopmental disorder and early signs of the disease in stem cells. Mol Neurobiol 2018;55:3351–3371. [DOI] [PMC free article] [PubMed] [Google Scholar]
- 9.Mehler MF, Gokhan S. Mechanisms underlying neural cell death in neurodegenerative diseases: alterations of a developmentally-mediated cellular rheostat. Trends Neurosci 2000;23:599–605. [DOI] [PubMed] [Google Scholar]
- 10.Tabrizi SJ, Scahill RI, Durr A, et al. Biological and clinical changes in premanifest and early stage Huntington's disease in the TRACK-HD study: the 12-month longitudinal analysis. Lancet Neurol 2011;10:31–42. [DOI] [PubMed] [Google Scholar]
- 11.Lee JK, Ding Y, Conrad AL, et al. Sex-specific effects of the Huntington gene on normal neurodevelopment. J Neurosci Res 2017;95:398–408. [DOI] [PMC free article] [PubMed] [Google Scholar]
- 12.Langbehn DR, Brinkman RR, Falush D, Paulsen JS, Hayden MR. A new model for prediction of the age of onset and penetrance for Huntington's disease based on CAG length. Clin Genet 2004;65:267–277. [DOI] [PubMed] [Google Scholar]
- 13.Hannan AJ. Tandem repeats mediating genetic plasticity in health and disease. Nat Rev Genet 2018;19:286–298. [DOI] [PubMed] [Google Scholar]
- 14.International Huntington Association (IHA) and the World Federation of Neurology (WFN) Research Group on Huntington's Chorea. Guidelines for the molecular genetics predictive test in Huntington's disease. Neurology 1994;44:1533–1536. [PubMed] [Google Scholar]
- 15.Unified HSG. Huntington's Disease Rating Scale: reliability and consistency: Huntington Study Group. Mov Disord 1996;11:136–142. [DOI] [PubMed] [Google Scholar]
- 16.Vijayakumar N, Mills KL, Alexander-Bloch A, Tamnes CK, Whittle S. Structural brain development: a review of methodological approaches and best practices. Dev Cogn Neurosci 2018;33:129–148. [DOI] [PMC free article] [PubMed] [Google Scholar]
- 17.White N, Roddey C, Shankaranarayanan A, et al. PROMO: real-time prospective motion correction in MRI using image-based tracking. Magn Reson Med 2010;63:91–105. [DOI] [PMC free article] [PubMed] [Google Scholar]
- 18.Tustison NJ, Cook PA, Klein A, et al. Large-scale evaluation of ANTs and FreeSurfer cortical thickness measurements. Neuroimage 2014;99:166–179. [DOI] [PubMed] [Google Scholar]
- 19.Tustison NJ, Avants BB, Cook PA, Zheng A, Yushkevich PA, Gee JC. N4ITK: improved N3 bias correction. IEEE Trans Med Imaging 2010;29:1310–1320. [DOI] [PMC free article] [PubMed] [Google Scholar]
- 20.Kim EY, Johnson HJ. Robust multi-site MR data processing: iterative optimization of bias correction, tissue classification, and registration. Front Neuroinform 2013:1–11. [DOI] [PMC free article] [PubMed] [Google Scholar]
- 21.Wang H, Suh JW, Das SR, Pluta JB, Craige C, Yushkevich PA. Multi-atlas segmentation with joint label fusion. IEEE Trans Pattern Anal Mach Intell 2013;35:611–623. [DOI] [PMC free article] [PubMed] [Google Scholar]
- 22.Desikan RS, Se F, Fischl B, et al. An automated labeling system for subdividing the human cerebral cortex on MRI scans into gyral based regions of interest. Neuroimage 2006;31:968–980. [DOI] [PubMed] [Google Scholar]
- 23.Fortin JP, Cullen N, Sheline YI, et al. Harmonization of cortical thickness measurements across scanners and sites. Neuroimage 2018;167:104–120. [DOI] [PMC free article] [PubMed] [Google Scholar]
- 24.Koscik TR. ez.combat [online]. 2018. Accessed at: github.com/TKoscik/ez.combat.
- 25.Harrell FE. Multivariable Modeling Strategies: Regres Model Strateg. New York: Springer; 2015:63–102. [Google Scholar]
- 26.Fusilli C, Migliore S, Mazza T, et al. Biological and clinical manifestations of juvenile Huntington's disease: a retrospective analysis. Lancet Neurol 2018;4422:1–8. [DOI] [PubMed] [Google Scholar]
- 27.Herting MM, Johnson C, Mills KL, et al. Development of subcortical volumes across adolescence in males and females: a multisample study of longitudinal changes. Neuroimage 2018;172:194–205. [DOI] [PMC free article] [PubMed] [Google Scholar]
- 28.Giedd JN, Rapoport JL. Structural MRI of pediatric brain development: what have we learned and where are we going? Neuron 2010;67:728–734. [DOI] [PMC free article] [PubMed] [Google Scholar]
- 29.Raznahan A, Shaw PW, Lerch JP, et al. Longitudinal four-dimensional mapping of subcortical anatomy in human development. Proc Natl Acad Sci USA 2014;111:1592–1597. [DOI] [PMC free article] [PubMed] [Google Scholar]
- 30.McColgan P, Tabrizi SJ. Huntington's disease: a clinical review. Eur J Neurol 2018;25:24–34. [DOI] [PubMed] [Google Scholar]
- 31.Kemp JM, Powell TPS. The connexions of the striatum and globus pallidus: synthesis and speculation. Philos Trans R Soc B Biol Sci 1971;262:441–457. [DOI] [PubMed] [Google Scholar]
- 32.Mitchell IJ, Cooper AJ, Griffiths MR. The selective vulnerability of striatopallidal neurons. Prog Neurobiol 1999;59:691–719. [DOI] [PubMed] [Google Scholar]
- 33.Molero AE, Arteaga-Bracho EE, Chen CH, et al. Selective expression of mutant huntingtin during development recapitulates characteristic features of Huntington's disease. Proc Natl Acad Sci USA 2016;113:5736–5741. [DOI] [PMC free article] [PubMed] [Google Scholar]
- 34.Mehler MF, Petronglo XJR, Arteaga-bracho EE, et al. Loss-of-Huntingtin in medial and lateral Ganglionic lineages differentially disrupts regional Interneuron and projection neuron subtypes and promotes Huntington's disease-associated behavioral, cellular, and pathological hallmarks. J Neurosci 2019;39:1892–1909. [DOI] [PMC free article] [PubMed] [Google Scholar]
- 35.Tereshchenko A, Magnotta VA, Epping EA, et al. Brain structure in juvenile onset Huntington's disease. Neurology 2019;92:e1939–e1947. [DOI] [PMC free article] [PubMed] [Google Scholar]
- 36.Feigin A, Leenders KL, Moeller JR, et al. Metabolic network abnormalities in early Huntington's disease: an [(18)F]FDG PET study. J Nucl Med 2001;42:1591–1595. [PubMed] [Google Scholar]
- 37.Sarappa C, Salvatore E, Filla A, et al. Functional MRI signal fluctuations highlight altered resting brain activity in Huntington's disease. Brain Imaging Behav 2017;11:1459–1469. [DOI] [PubMed] [Google Scholar]
- 38.Amaral DG, Li D, Libero L, et al. In pursuit of neurophenotypes: the consequences of having autism and a big brain. Autism Res 2017;10:711–722. [DOI] [PMC free article] [PubMed] [Google Scholar]
- 39.Reilmann R, Lippross V, Hölzner E, et al. FDG μPET Fails to detect a disease-specific phenotype in rats transgenic for huntington's disease: a 15 months follow-up study. J Huntingtons Dis 2015;4:37–47. [PubMed] [Google Scholar]
- 40.Aylward EH, Nopoulos PC, Ross CA, et al. . Longitudinal change in regional brain volumes in prodromal Huntington disease. J Neurol Neurosurg Psychiatry 2011;82:405–410. [DOI] [PMC free article] [PubMed] [Google Scholar]
- 41.Paulsen JS, Long JD, Ross CA, et al. Prediction of manifest Huntington’s disease with clinical and imaging measures: a prospective observational study. Lancet Neurol 2014;13:1193–1201. [DOI] [PMC free article] [PubMed] [Google Scholar]
- 42.Henley SM, Wild EJ, Hobbs NZ, et al. Relationship between CAG repeat length and brain volume in premanifest and early Huntington's disease. J Neurol 2009;256:203–212. [DOI] [PubMed] [Google Scholar]
- 43.Lebel C, Beaulieu C. Longitudinal development of human brain wiring continues from childhood into adulthood. J Neurosci 2011;31:10937–10947. [DOI] [PMC free article] [PubMed] [Google Scholar]
- 44.Tabrizi SJ, Langbehn DR, Leavitt BR, et al. Biological and clinical manifestations of Huntington's disease in the longitudinal TRACK-HD study: cross-sectional analysis of baseline data. Lancet Neurol 2009;8:791–801. [DOI] [PMC free article] [PubMed] [Google Scholar]
- 45.Landwehrmeyer GB, Fitzer-Attas CJ, Giuliano JD, et al. Data analytics from enroll-HD, a global clinical research platform for Huntington's disease. Mov Disord Clin Pract 2017;4:212–224. [DOI] [PMC free article] [PubMed] [Google Scholar]
Associated Data
This section collects any data citations, data availability statements, or supplementary materials included in this article.
Data Availability Statement
The de-identified data supporting the findings reported here can be made available upon reasonable request.


