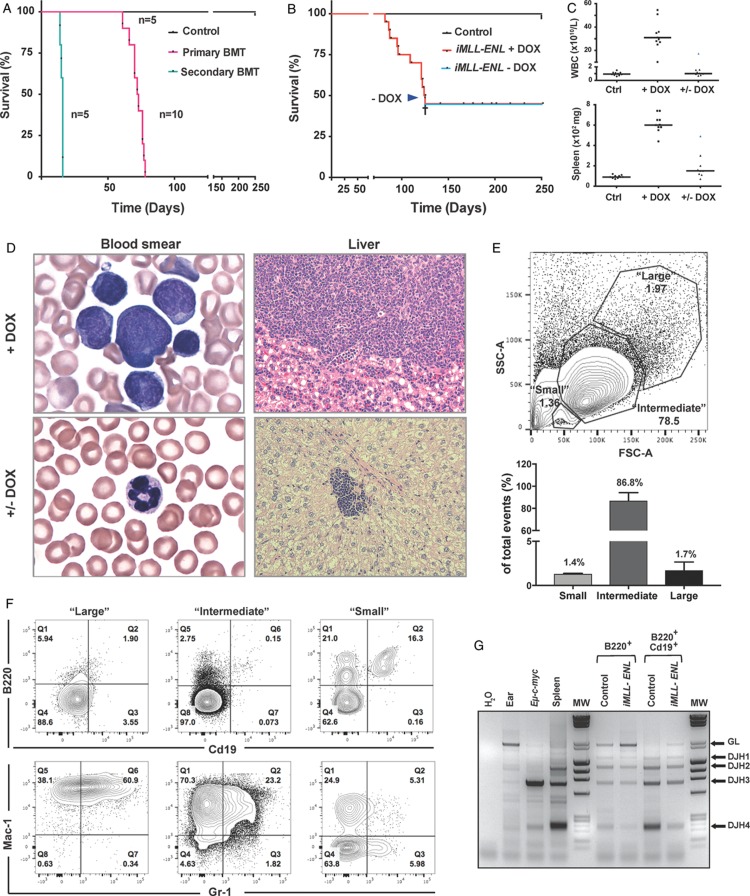
Figure 2.
In vivo induction of iMLL-ENL results in a reversible acute leukemia expressing myeloid and lymphoid markers. (A) Kaplan-Meier survival plot of animals reconstituted with 106 naive BM from iMLL-ENL mice (median latency 72.0 ± 5.3 days, n = 10) or transplanted with 105 blasts from leukemic mice (median latency 15.4 ± 0.9 days, n = 5). Wild type recipients of naive BM cells were lethally irradiated (137Cs, 9Gy) and DOX-induced 2 weeks after reconstitution. Recipients of leukemic BM were sublethally irradiated (4.5Gy) and received DOX 2 days prior to bone marrow transplantation and onward. (B) DOX administration in the drinking water induced acute leukemia in iMLL-ENL (median latency of 104.3 ± 16.9 days, n = 10). Upon DOX removal (arrow) the remaining animals (n = 10) survived up to 300 days without developing the disease, except of 1 mouse with extensive multiorgan leukemic infiltration (cross). (C) White blood cell counts and spleen weight of diseased mice on DOX (+DOX) and after DOX removal (+/− DOX) measured at different time points. (D) Wright-Giemsa-stained blood smears and histopathology of the liver showing infiltration of leukemic blasts of different sizes. Upon DOX removal the blood smears were normal and only small residual infiltrations were found occasionally in the livers. (E) Top panel: representative flow cytometric analysis of leukemic blasts isolated from highly infiltrated BM grouped according to different size (“large,” “intermediate,” and “small”). Bottom panel: quantification of the representative FACS plot showing the percentage of “large,” “intermediate,” and “small” cells. The bars represent the percentage of mean of size measured from BM cells of 3 independently analyzed diseased iMLL-ENL mice. (F) Detailed flow cytometric analysis of BM cells from a representative diseased iMLL-ENL mouse (E), showing the percentage of cell populations expressing lymphoid (B220 and Cd19) versus myeloid markers (Mac-1 and Gr-1), grouped according to size. Cells were costained with antibodies for all the markers. Different populations were gated according to size (SSC-A vs FSC-A), singlet (FSC-A vs FSC-H), live (DAPI−), and expression of the respective markers. (G) Polymerase chain reaction analysis of the IgH D-J gene rearrangements using DNA isolated from the BM cells of a leukemic mouse (input) of single B220+ and double B220+/Cd19+ flow-sorted cells versus control DNA samples isolated from the ear, the spleen of a wild type (B6) mouse, and from a lymphoma of Eμ-c-myc transgenic mice (GL: 2.1 kb, DJH1: 1.4 kb, DJH2: 1.1 kb, DJH3: 0.7 kb, and DJH4: 0.2 kb). BM = bone marrow, DOX = doxycycline, FACS = fluorescence activated cell sorting, GL = germline.

