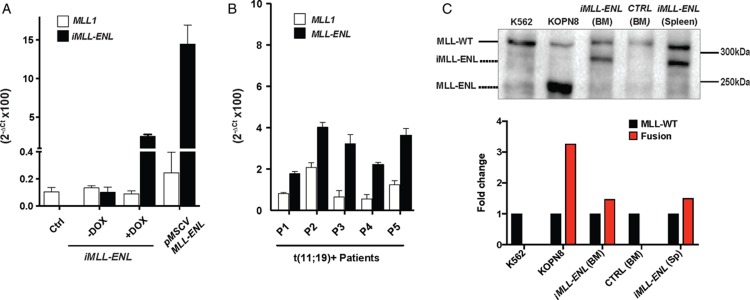
Figure 6.
Expression of iMLL-ENL levels determine cellular transformation in vitro and in vivo. (A) The expression of Mll1 and MLL-ENL mRNA was measured in naive and leukemic BM cells from transgenic mice and BM cells from symptomatic mice transplanted with retrovirally (pMSCV-MLL-ENL) transduced cells. Relative mRNA expression levels were normalized to Gapdh expression and are expressed as 2−ΔCt. Results are shown as mean values ± standard deviation of duplicates. (B) Expression of MLL1 and MLL-ENL mRNA in leukemic cells of human patients diagnosed with ALL and >80% infiltration. Relative mRNA expression levels were normalized to Gapdh expression and are expressed as 2−ΔCt. Results are shown as mean values ± standard deviation of duplicates. (C) Western blot analysis of total cell lysates of K562 (CML, wild type MLL), KOPN8 (ALL, t(11;19)+), BM of healthy mice, and BM and spleen cells of diseased iMLL-ENL mice. The blot was probed with an antibody recognizing the MLL-N-terminus. KOPN8 cells express an MLL-ENL fusion of calculated size of about 170 kDa,29 while the iMLL-ENL fusion results in a protein of 220 kDa.16 Bands were quantified according to intensity, and calculated as fold change normalized to wild type MLL. ALL = acute lymphoblastic leukemia, BM = bone marrow, CML = chronic myelogenous leukemia.

