Abstract
Objective
To investigate whether cardiometabolic factors were associated with age-related differences in cortical thickness in relation to sex.
Methods
In this cross-sectional study, we enrolled 1,322 cognitively normal elderly (≥65 years old) individuals (774 [58.5%] men, 548 [41.5%] women). We measured cortical thickness using a surface-based analysis. We analyzed the associations of cardiometabolic risk factors with cortical thickness using multivariate linear regression models after adjusting for possible confounders and interactions with age.
Result
Among women, hypertension (β = −1.119 to −0.024, p < 0.05) and diabetes mellitus (β = −0.920, p = 0.03) were independently associated with lower mean cortical thickness. In addition, there was an interaction effect between obesity (body mass index [BMI] ≥27.5 kg/m2) and age on cortical thickness in women (β = −0.324 to −0.010, p < 0.05), suggesting that age-related differences in cortical thickness were more prominent in obese women compared to women with normal weight. Moreover, low education level (<6 years) was correlated with lower mean cortical thickness (β = −0.053 to −0.046, p < 0.05). Conversely, among men, only being underweight (BMI ≤18.5 kg/m2, β = −2.656 to −0.073, p < 0.05) was associated with lower cortical thickness.
Conclusions
Our findings suggest that cortical thickness is more vulnerable to cardiometabolic risk factors in women than in men. Therefore, sex-specific prevention strategies may be needed to protect against accelerated brain aging.
Cardiometabolic risk factors such as hypertension (HTN), diabetes mellitus (DM), and obesity are among the most important environmental risk factors for dementia.1,2 There is increasing evidence that cardiometabolic risk factors are related to cortical atrophy, a potential predictor of cognitive impairment,3 even in individuals without dementia.4,5 HTN has been shown to be associated with cortical thinning, in particular in the frontal and temporal cortices.6 A recent study has linked DM and obesity to cortical thinning in several areas important in Alzheimer disease (AD), including temporal and parietal regions.7,8
Neuroimaging studies have suggested that aging prominently affects cortical thickness in cognitively normal individuals.9–11 We recently published a study demonstrating the trajectories of age-related cortical atrophy, which are referred to as brain aging.12 We also found that there were distinct trajectories of brain aging by sex differences.12 Furthermore, previous studies have shown that HTN and DM divergently affect development of dementia by sex.13,14 Specifically, it has been suggested that the effects of HTN or DM on the development of dementia are stronger in women than in men.13,14 In addition, the effects of low education, one of the risk factors for dementia, on cortical thickness might be modified by sex because women tend to have limited access to education compared with men, especially in Asia.15,16
Thus, the objective of our study was to determine the influence of cardiometabolic risk factors on lower cortical thickness in relation to sex-specific differences in the cognitively normal elderly. We hypothesized that cortical thickness in women would be more vulnerable to cardiometabolic risk factors than that in men in terms of brain aging.
Methods
Study participants
In this cross-sectional study, we recruited men and women ≥65 years of age from the Health Promotion Center of the Samsung Medical Center (Seoul, Korea) who were offered a medical health screening from September 1, 2008, to December 31, 2014. We performed this screening on a total of 1,568 participants, which included an assessment of their cognitive function. As part of the evaluation, high-resolution 3.0T MRI was used to capture 3D volumetric images of all participants. The procedures used for our participants have been detailed in a previous study.17 We excluded the following conditions in our study: incomplete or irretrievable information on education level, cardiometabolic risk factors, or Mini-Mental State Examination score (84 participants); significant cognitive dysfunction defined as Mini-Mental State Examination score below the 16th percentile using age-, sex-, and education-matched norms (63 participants); and inconclusive neuroimaging analyses of cortical thickness due to movement of the head, obscure MRI images, cerebral abnormalities other than stroke, and placement not conforming to a standardized stereotaxic space (99 participants). Finally, 1,322 people ≥65 years of age (774 men and 548 women) were included in this study.
Standard protocol approvals, registrations, and patient consents
The Institutional Review Board of the Samsung Medical Center approved this study. All methods conformed to the approved guidelines. Participants' consent was waived by the board because only retrospective data were collected during each visit.
Measurement variables
Medical assessments were conducted by medically trained health professionals using standard protocols. Baseline investigations were obtained, which included the following; blood test (complete blood cell count, basic chemistry, coagulation test, thyroid function test, tumor markers), urine analysis, chest x-ray, ECG, esophagogastroduodenoscopy, abdominal ultrasound, and pulmonary function test.
We identified the cardiometabolic risk factors as follows: HTN (defined as medical history of HTN or currently taking any antihypertensive drugs) and DM (defined as a history of DM or currently taking insulin or oral antidiabetic medications). Body mass index (BMI) was calculated as weight (in kilograms) divided by height (in meters) squared at the first visit. According to the previous study,18 participants with low BMI (BMI ≤18.5 kg/m2) were labeled as underweight, those with severe obesity (BMI ≥ 27.5 kg/m2) were labeled as obese, and all others (normal weight, overweight, and mild obesity) were considered the reference group. To evaluate the level of education, we inquired about participants’ formal education in detail, including whether they had completed each education level and the total duration of education. We defined low education level as having <6 years of elementary schooling. We further evaluated whether stroke (defined as a history of stroke) and ischemic heart disease (IHD, defined as a history of coronary heart disease) modified cortical thickness.
Measurement of cortical thickness in brain MRI
We have described the process of cortical thickness measurement in a previous study.12 An Achieva 3.0T MRI scanner (Philips, Best, the Netherlands) was applied to obtain 3D T1 turbo field echo MRI data. Details of the parameters are as follows: sagittal slice thickness 1.0 mm with 50% overlap; no gap; repetition time 9.9 milliseconds; echo time 4.6 milliseconds; flip angle 8°; and matrix size 240 × 240 pixels reconstructed to 480 × 480 over a field of view of 240 mm.12 To measure cortical thickness, T1-weighted MRIs were automatically analyzed with the standard Montreal Neurologic Institute image processing software (CIVET). Raw data of the MRI images were first registered into a standardized stereotaxic space with the aid of an affine transformation.19 We rectified nonuniformity artifacts using the N3 algorithm. Gray matter, white matter, CSF, and background were identified in the registered and corrected volumes with an artificial neural net classifier.20 The inner and outer surfaces of each cortex were outlined by deforming a spherical network of the gray/white boundary of each hemisphere with the Constrained Laplacian-Based Automated Segmentation With Proximities algorithm.21
Cortical thickness was measured as the euclidean distance drawn between the linked vertices of both the inner and outer surfaces. This was done by using an inverse transformation matrix to cortical surfaces and rebuilding them in the native space.21,22 An unbiased iterative group template was used to analyze the cortical thickness by matching the folding patterns of the sulci. Surface-based registration was later applied, which required sphere-to-sphere warping for comparison of the thickness of each corresponding area.23 Global and regional analyses involving the frontal, temporal, parietal, and occipital lobes were performed with the SUMA program.22,24
Statistical analysis
We performed statistical analyses in men and women separately. Data analysis was conducted in the following stages. First, the relationships between each independent variable and thickness of the cortices were analyzed with univariate linear regression models. The dependent variable was cortical thickness, and the independent variables were age, education (≥6 years, <6 years as the reference group), HTN, DM, IHD, stroke, and BMI category (underweight, reference group and severe obesity). Second, to investigate the interaction effect between each independent variable and age, a 2-way interaction model with main effect of an independent variable, age, and their interaction effect was analyzed. Third, multivariate linear regression analyses were performed to test the association between predictor variables and cortical thickness with adjustment for confounding effects on each other. For this analysis, we selected the main effect with a value of p < 0.05 from the first stage. Then, we put the main effect and interaction effect of the variable in the multivariate linear regression model together if the interaction effect of an independent variable with age was significant from the 2-way model. Finally, we estimated lower global cortical thickness (percent) related to each risk factor at a specific age. We did this by estimating the change in global cortical thickness per year of age using a multiple linear regression model.
For cortical thickness analyses of MRI data, we applied the SurfStat toolbox for Matlab (MathWorks, Inc, Natick, MA).25 SAS version 9.4 (SAS Institute Inc, Cary, NC) was used, and 2-sided values of p < 0.05 were regarded as significant in our study.
Data availability
Anonymized and statistical information of all the participants was made available to and shared only among qualified investigators.
Results
Demographic and clinical characteristics of patients
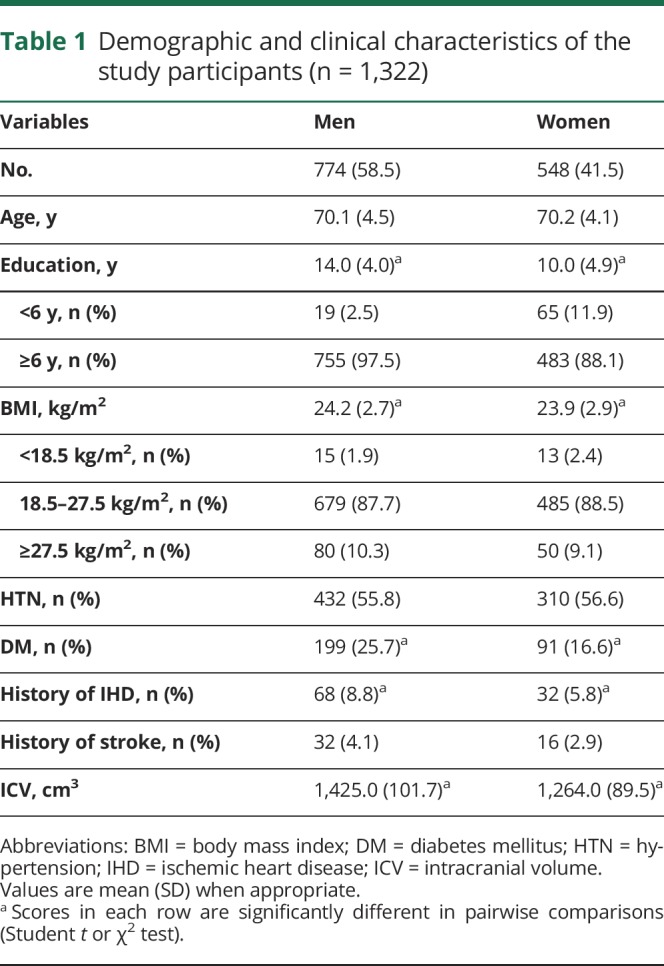
The demographics of the participants are summarized in table 1. Among 1,322 participants, 774 (58.5%) were men with a mean age of 70.1 ± 4.5 years (range 65–91 years), and 548 were women with a mean age of 70.2 ± 4.1 years (range 65–87 years). Men were found to more frequently have >6 years of education (97.5% of men, 88.1% of women), DM (25.7% of men, 16.6% of women), and history of IHD (8.8% of men, 5.8% of women) than women. The proportions of those in the underweight and reference groups (BMI <18.5 and 18.5–27.5 kg/m2, respectively) were higher in women than in men (2.4% of women, 1.9% of men in the underweight group; 88.5% of women, 87.7% of men in reference group); the proportion of those in the severe obesity group (BMI >27.5 kg/m2) was higher in men (10.3% of men, 9.1% of women) (table 1).
Table 1.
Demographic and clinical characteristics of the study participants (n = 1,322)
Effects of cardiometabolic risk factors and low education on cortical thickness
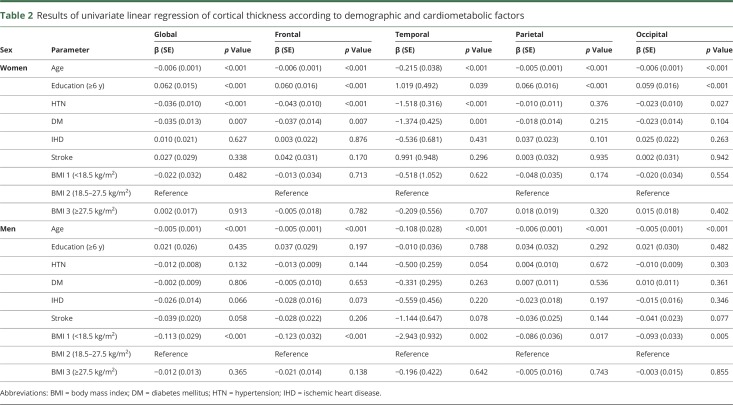
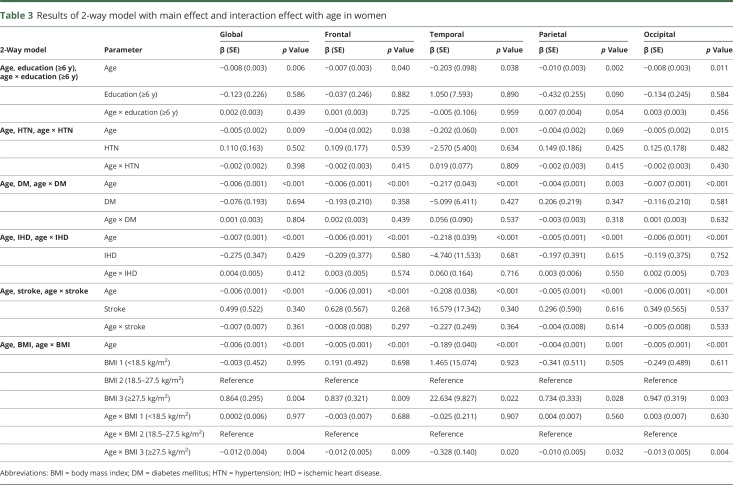
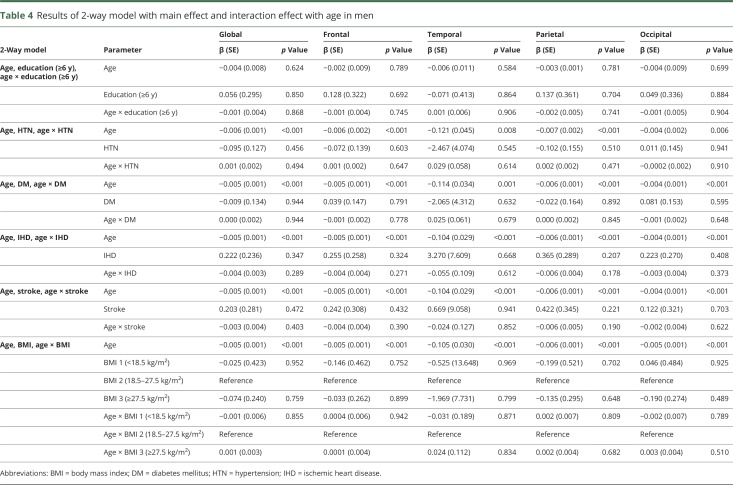
Univariate analyses showed that in women and men, age was associated with lower cortical thickness throughout the entire cortex (β = −0.215 to −0.005, p < 0.001) (table 2). Among women, HTN was associated with lower cortical thickness, globally and regionally (frontal, temporal, and occipital regions) (β = −1.518 to −0.023, p < 0.05); DM was also related to lower cortical thickness, globally and regionally (frontal and temporal regions) (β = −1.374 to −0.035, p < 0.05). In addition, low education level (<6 years) was found to be associated with lower cortical thickness throughout the entire cortex (β = −1.019 to −0.059, p < 0.05). In a 2-way interaction model among women, there was an interaction between age and obesity throughout the entire cortex (β = −0.328 to −0.010, p < 0.05) (table 3). Among men, being underweight was associated with lower cortical thickness throughout the entire cortex (β = −2.943 to −0.086, p < 0.05). However, HTN, DM, and low education were not related to lower cortical thickness (table 2). No variables interacted with age (table 4).
Table 2.
Results of univariate linear regression of cortical thickness according to demographic and cardiometabolic factors
Table 3.
Results of 2-way model with main effect and interaction effect with age in women
Table 4.
Results of 2-way model with main effect and interaction effect with age in men
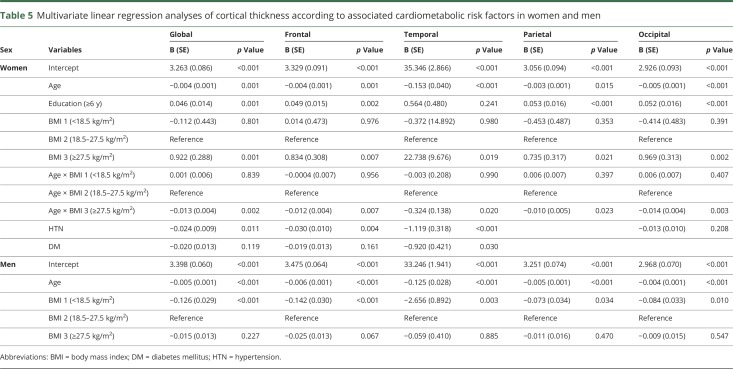
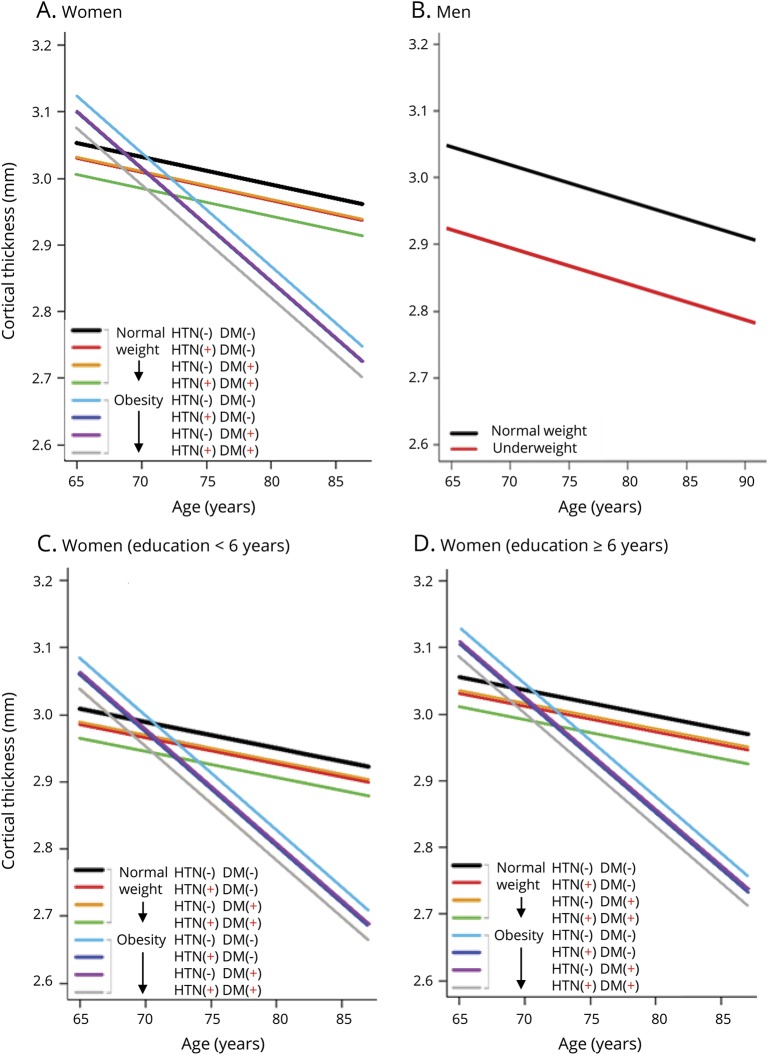
In multivariate analysis among women, HTN was associated with lower cortical thickness, globally (β = −0.024, p = 0.011) and regionally (frontal β = −0.030, p = 0.004; temporal β = −1.119, p < 0.001) (table 5). DM was also related to lower cortical thickness in the temporal region (β = −0.920, p = 0.030). In addition, there was an interaction effect between obesity and age on cortical thickness throughout the entire cortex in women (β = −0.324 to −0.010, p < 0.05) suggesting that age-related differences in cortical thickness were more prominent by aging in obese women compared to women with normal weight. The slope of the cortical thickness vs age plot was steeper in women with obesity than in women with normal weight (figure). Low education was related to lower cortical thickness, globally and regionally (frontal, parietal, and occipital regions) (β = −0.053 to −0.046, p < 0.05) (table 5 and figure). Conversely, among men, being underweight was associated with lower cortical thickness throughout the entire cortex (β = −2.656 to −0.073, p < 0.05) (table 5 and figure). The final estimated global cortical thickness models are shown in the figure and were fitted as in table e-1 (available from Dryad, doi.org/10.5061/dryad.s7v164j).
Table 5.
Multivariate linear regression analyses of cortical thickness according to associated cardiometabolic risk factors in women and men
Figure. Estimated global cortical thickness models.
Estimated global cortical thickness models according to associated cardiometabolic factors in cognitively normal (A) women and (B) men. (C and D) Cortical thickness in women according to years of education. DM = diabetes mellitus; HTN = hypertension.
To evaluate the effect modification of sex and cardiometabolic risk factors on cortical thickness, multiple linear regressions were performed in all participants (n = 1,322) after adding the interaction terms between sex and other significant variables from multivariate analyses (sex × age, sex × underweight, sex × obesity, and sex × age × obesity for the whole cortex; sex × HTN for global, frontal, temporal cortex; sex × low education for global, frontal, parietal, occipital cortex; sex × DM for temporal cortex). There were interactions as follows; sex × age (global p = 0.001, frontal p = 0.001, temporal p < 0.001, parietal p = 0.021, occipital p < 0.001), sex × obesity (global p = 0.002, frontal p = 0.009, temporal p = 0.02, parietal p = 0.032, occipital p = 0.003), sex × HTN (global p = 0.006, frontal p = 0.002, temporal p < 0.001), sex × low education (global p = 0.001, frontal p = 0.001, parietal p = 0.001, occipital p = 0.002), sex × DM (temporal p = 0.024), and sex × age × obesity (global p = 0.002, frontal p = 0.009, temporal p = 0.021, parietal p = 0.034, occipital p = 0.004).
Estimated lower global cortical thickness by each risk factor
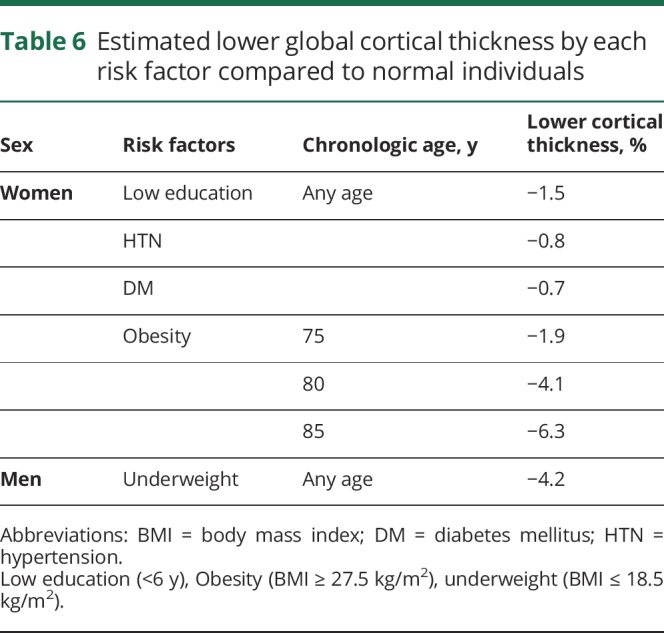
Table 6 shows the estimated lower global cortical thickness related to each risk factor. In women, compared to participants without any risk factors, lower cortical thickness related to low education, HTN, and DM was estimated as −1.5%, −0.8%, and −0.7%, respectively, at any age. In obese women, estimated lower cortical thickness was more prominent with greater age compared to those with normal weight as follows: −1.9%, −4.1%, and −6.3% in 75-, 80-, and 85-year-olds, respectively. In men, lower cortical thickness for being underweight were estimated as −4.2% at any age.
Table 6.
Estimated lower global cortical thickness by each risk factor compared to normal individuals
Discussion
In this large cohort study, we investigated the different effects of cardiometabolic syndrome on lower cortical thickness between men and women who had undergone high-resolution MRI with the same type of scanner and parameters. Our major findings were as follows. First, among women, HTN and DM were associated with lower cortical thickness independently at any age. There were also interaction effects of age and obesity on cortical thickness throughout the entire cortex, suggesting that the slope of the cortical thickness vs age plot was steeper in obese women than in those of normal weight. Second, in men, being underweight was associated with a lower cortical thickness at any age. Taken together, our findings suggest that women with cardiometabolic risk factors are more vulnerable to cortical atrophy than men.
In our study, HTN and DM were independently associated with lower cortical thickness at any age in women but not in men. These major findings were consistent with another study that showed relatively more reduced brain perfusion and cortical thickness in participants diagnosed with HTN.26 Numerous mechanisms were proposed to explain this phenomenon such as disorders of the microvascular network, atherosclerosis, and endothelial dysfunction.26 This was further supported by another study finding an 65% increased risk of dementia in women with midadulthood HTN compared with men.13 Apart from HTN, DM is undeniably an independent risk factor for developing dementia.27 DM is a uniquely complex disease because a number of processes occur in DM such as insulin metabolism, hyperglycemic state resulting in prolonged inflammation, and microvascular and macrovascular changes.28,29 A recently published meta-analysis confirmed the specific relationship between sex differences and dementia.14 From a multiple-adjusted analytical report, DM accounted for a 60% increased risk of developing any form of dementia in both sexes; however, diabetic female patients had up to a 19% higher chance of having vascular dementia compared to male patients.14 Our findings also suggest that women have more detrimental effects from HTN or DM on brain aging than men.
It is worth noting that there were interaction effects between age and severe obesity on cortical thickness throughout the entire cortex, suggesting that the slope of the cortical thickness vs age plot was steeper in obese women than in women with normal weight. Severe obesity is generally well known to put an individual at risk of developing dementia.30–32 For instance, an elevated BMI score increased the risk of AD in women, which was a major finding reported by the Cache County Study.33 Similarly, in the H70 study, women with a high baseline BMI score were likely to develop AD.34 This phenomenon was not observed in men.34 This could possibly be explained by elevated levels of inflammatory proteins in women such as C-reactive protein and interleukin-6.35 In addition to the previous studies, our findings further suggest that in obese women, cortical thinning was accelerated more rapidly by aging than in those without obesity.
It is crucial to investigate the mechanism underlying why women were more susceptible to cardiometabolic risk factors. However, no conclusive studies have elucidated this yet. It has been thought that hormonal effects and social and behavioral differences might play a role.36 This is especially true for estrogen, which possesses potent anti-inflammatory properties.37 Estrogen deficiency during menopause causes activation of proinflammatory cytokines, which could put the brain at risk for inflammatory processes, subsequently leading to the development of cardiometabolic syndrome.38,39 Estrogen also plays a pivotal role in reducing vasoconstriction via the renin-angiotensin system pathway to maintain a normal blood pressure.40,41 A physiologic reduction in the estrogen level may place perimenopausal women at risk of HTN and renin-angiotensin system–regulated cerebrovascular alterations or AD pathology.41,42
Our current study also demonstrated an association between low education and lower cortical thickness in women but not in men. In general, women in Asia have limited access to education compared with men.15 Education may be the single most important prophylactic measure for dementia in that it increases the brain reserve by establishing neuronal and synaptic networks.43,44 Our aforementioned findings stress the importance of standard education to prevent brain aging, especially in women.
We also found that underweight men tend to have lower mean cortical thickness throughout the whole cortex. According to a previous study, the underweight elderly population is at increased risk of dementia.45 A similar report strongly suggested that underweight male participants have greater thinning in the frontal and temporal cortices compared with the normal group.18 Several possible mechanisms explain this phenomenon. First, a temporal inversion of vascular risk factors for dementia might play a role. It is known that obesity in midlife carries a high risk for developing dementia, while at older age the greatest dementia risk is observed in underweight individuals.46 Second, underweight could be reflective of early AD changes in the medial temporal region, which is an important center responsible for memory, as well as regulating appetite and eating behavior.47 In addition, deficiency of essential nutrients could result in oxidative stress, a process that could lead to AD changes.48 Furthermore, physiologic reserve dysfunction may increase susceptibility to any forms of stressors.49 At present, while there has been no convincing study to establish the mechanism of the sex effect on the relationship between being underweight and having lower cortical thickness, this has been proposed to be related to hormonal differences, diet, smoking, alcohol intake, exercise, and genetic predisposition.18,45
Finally, we found specific effects of each cardiometabolic risk factor by estimating lower cortical thickness. In obese women, estimated lower cortical thickness was more prominent by aging compared to women with normal weight.
The strengths of our current study included a large sample size, a standardized MRI protocol using the same type of scanner with the same set of parameters, sophisticated measurements of cortical thickness, and availability of a broad array of demographic and laboratory data on study participants obtained from the medical health screening. However, the present study has some limitations. First, this was designed as a cross-sectional study, and we were not able to investigate whether sex differences were dynamic from midlife to late life. In addition, we did not have information on exposure duration of the participants’ cardiometabolic risk factors. Further longitudinal study is required to investigate whether there might be dynamic differences from midlife to late life influenced by sex in the effects of vascular risk factors on development of cognitive impairment in the elderly. Second, pathologies such as AD, microcortical infarcts, and changes in the white matter responsible for lower cortical thickness were not measured in our present study. As a result, we propose future investigations to study other pathophysiologic processes. Third, we defined vascular risk factors as a medical history of diagnosis or on medication for vascular risk factors rather than suspected diagnosis from medical health screening. Considering that vascular risk factors could gradually and insidiously contribute to the development of degenerative dementia, we chose to adopt vascular risk factors obtained from the medical history as independent variables. Moreover, participants with suspected HTN or DM might be included in the group without HTN or DM. However, women have more frequency of suspected HTN than men (p < 0.001), biasing the results toward the null hypothesis. Another limitation is that the age range of our sample was restricted to >65 years because we aimed to determine the influence of cardiometabolic risk factors on brain aging in the cognitively normal elderly. The results of extending the sample to a younger age could lead to a different impact on brain cortical thickness at different ages. In addition, the frequency of low education was less in men (2.5%) than in women (11.9%), which might affect our finding of sex-specific low educational effects on lower cortical thickness. Finally, information possibly related to cognition such as estrogen exposure, menarche onset, child-bearing duration, and age at primigravida was not obtained.50 This opens the possibility for future study to assess whether the estrogen levels mediate the effects of cardiometabolic risk factors on cortical atrophy. However, the results of our present study highlight the importance of sex-specific relationship of cardiometabolic risk factors with brain aging. These results further suggest that a different approach is needed to prevent and manage dementia in terms of sex differences, taking into consideration the insufficiency of our currently known prevention or treatment methods for brain aging.
Acknowledgment
Dr. Ching Soong Khoo (Neurology Unit, Department of Medicine, Universiti Kebangsaan Malaysia Medical Center, Malaysia.) for manuscript correction.
Glossary
- BMI
body mass index
- DM
diabetes mellitus
- HTN
hypertension
- IHD
ischemic heart disease
Appendix. Authors
Study funding
This work was supported by the Brain Research Program through the National Research Foundation of Korea funded by Ministry of Science, ICT and Future Planning in Korea (Nos. 2016M3C7A1913844 and 2017R1A2B2005081), Research of Korea Centers for Disease Control and Prevention (No. 2018-ER6203-01), a grant from the Korean Health Technology R&D Project, Ministry of Health & Welfare, Republic of Korea (grant HI18C1629), and an NIH grant (P30AG049638).
Disclosure
The authors report no disclosures relevant to the manuscript. Go to Neurology.org/N for full disclosures.
References
- 1.Akinyemi RO, Mukaetova-Ladinska EB, Attems J, Ihara M, Kalaria RN. Vascular risk factors and neurodegeneration in ageing related dementias: Alzheimer's disease and vascular dementia. Curr Alzheimer Res 2013;10:642–653. [DOI] [PubMed] [Google Scholar]
- 2.Norton S, Matthews FE, Barnes DE, Yaffe K, Brayne C. Potential for primary prevention of Alzheimer's disease: an analysis of population-based data. Lancet Neurol 2014;13:788–794. [DOI] [PubMed] [Google Scholar]
- 3.Söderlund H, Nyberg L, Nilsson LG. Cerebral atrophy as predictor of cognitive function in old, community-dwelling individuals. Acta Neurol Scand 2004;109:398–406. [DOI] [PubMed] [Google Scholar]
- 4.Leritz EC, Salat DH, Williams VJ, et al. Thickness of the human cerebral cortex is associated with metrics of cerebrovascular health in a normative sample of community dwelling older adults. Neuroimage 2011;54:2659–2671. [DOI] [PMC free article] [PubMed] [Google Scholar]
- 5.Leritz EC, McGlinchey RE, Kellison I, Rudolph JL, Milberg WP. Cardiovascular disease risk factors and cognition in the elderly. Curr Cardiovasc Risk Rep 2011;5:407–412. [DOI] [PMC free article] [PubMed] [Google Scholar]
- 6.Gonzalez CE, Pacheco J, Beason-Held LL, Resnick SM. Longitudinal changes in cortical thinning associated with hypertension. J Hypertens 2015;33:1242–1248. [DOI] [PMC free article] [PubMed] [Google Scholar]
- 7.Wennberg AM, Spira AP, Pettigrew C, et al. Blood glucose levels and cortical thinning in cognitively normal, middle-aged adults. J Neurol Sci 2016;365:89–95. [DOI] [PMC free article] [PubMed] [Google Scholar]
- 8.Shaw ME, Sachdev PS, Abhayaratna W, Anstey KJ, Cherbuin N. Body mass index is associated with cortical thinning with different patterns in mid- and late-life. Int J Obes (Lond) 2018;42:455–461. [DOI] [PubMed] [Google Scholar]
- 9.Hurtz S, Woo E, Kebets V, et al. Age effects on cortical thickness in cognitively normal elderly individuals. Dement Geriatr Cogn Dis Extra 2014;4:221–227. [DOI] [PMC free article] [PubMed] [Google Scholar]
- 10.Fjell AM, Walhovd KB. Structural brain changes in aging: courses, causes and cognitive consequences. Rev Neurosci 2010;21:187–221. [DOI] [PubMed] [Google Scholar]
- 11.Salat DH, Buckner RL, Snyder AZ, et al. Thinning of the cerebral cortex in aging. Cereb Cortex 2004;14:721–730. [DOI] [PubMed] [Google Scholar]
- 12.Lee JS, Kim S, Yoo H, et al. Trajectories of physiological brain aging and related factors in people aged from 20 to over-80. J Alzheimers Dis 2018;65:1237–1246. [DOI] [PubMed] [Google Scholar]
- 13.Gilsanz P, Mayeda ER, Glymour MM, et al. Female sex, early-onset hypertension, and risk of dementia. Neurology 2017;89:1886–1893. [DOI] [PMC free article] [PubMed] [Google Scholar]
- 14.Chatterjee S, Peters SA, Woodward M, et al. Type 2 diabetes as a risk factor for dementia in women compared with men: a pooled analysis of 2.3 million people comprising more than 100,000 cases of dementia. Diabetes Care 2016;39:300–307. [DOI] [PMC free article] [PubMed] [Google Scholar]
- 15.Herz B. Educating girls in South Asia: promising approaches. UNICEF. 2006.. Available at: www.ungei.org/resources/files/unicefrosa_educatinggirlsinSouthAsia.pdf. Accessed November 9, 2018.
- 16.Sharp ES, Gatz M. Relationship between education and dementia: an updated systematic review. Alzheimer Dis Assoc Disord 2011;25:289–304. [DOI] [PMC free article] [PubMed] [Google Scholar]
- 17.Lee JS, Shin HY, Kim HJ, et al. Combined effects of physical exercise and education on age-related cortical thinning in cognitively normal individuals. Sci Rep 2016;6:24284. [DOI] [PMC free article] [PubMed] [Google Scholar]
- 18.Kim H, Kim C, Seo SW, et al. Association between body mass index and cortical thickness: among elderly cognitively normal men and women. Int Psychogeriatr 2015;27:121–130. [DOI] [PubMed] [Google Scholar]
- 19.Collins DL, Neelin P, Peters TM, Evans AC. Automatic 3D intersubject registration of MR volumetric data in standardized Talairach space. J Comput Assist Tomogr 1994;18:192–205. [PubMed] [Google Scholar]
- 20.Sled JG, Zijdenbos AP, Evans AC. A nonparametric method for automatic correction of intensity nonuniformity in MRI data. IEEE Trans Med Imaging 1998;17:87–97. [DOI] [PubMed] [Google Scholar]
- 21.Kim JS, Singh V, Lee JK, et al. Automated 3-D extraction and evaluation of the inner and outer cortical surfaces using a laplacian map and partial volume effect classification. Neuroimage 2005;27:210–221. [DOI] [PubMed] [Google Scholar]
- 22.Im K, Lee JM, Lee J, et al. Gender difference analysis of cortical thickness in healthy young adults with surface-based methods. Neuroimage 2006;31:31–38. [DOI] [PubMed] [Google Scholar]
- 23.Lyttelton O, Boucher M, Robbins S, Evans A. An unbiased iterative group registration template for cortical surface analysis. Neuroimage 2007;34:1535–1544. [DOI] [PubMed] [Google Scholar]
- 24.SUMA program [online]. Available at: afni.nimh.nih.gov. Accessed March 4, 2016.
- 25.SurfStat toolbox for Matlab [online]. Available at: galton.uchicago.edu/faculty/InMemoriam/worsley/research/surfstat. Accessed March 20, 2016.
- 26.Alosco ML, Gunstad J, Xu X, et al. The impact of hypertension on cerebral perfusion and cortical thickness in older adults. J Am Soc Hypertens 2014;8:561–570. [DOI] [PMC free article] [PubMed] [Google Scholar]
- 27.Whitmer RA. Type 2 diabetes and risk of cognitive impairment and dementia. Curr Neurol Neurosci Rep 2007;7:373–380. [DOI] [PubMed] [Google Scholar]
- 28.Ninomiya T. Diabetes mellitus and dementia. Curr Diab Rep 2014;14:487. [DOI] [PubMed] [Google Scholar]
- 29.Ahtiluoto S, Polvikoski T, Peltonen M, et al. Diabetes, Alzheimer disease, and vascular dementia: a population-based neuropathologic study. Neurology 2010;75:1195–1202. [DOI] [PubMed] [Google Scholar]
- 30.Loef M, Walach H. Midlife obesity and dementia: meta-analysis and adjusted forecast of dementia prevalence in the United States and China. Obesity 2013;21:E51–E55. [DOI] [PubMed] [Google Scholar]
- 31.Dahl AK, Hassing LB, Fransson EI, Gatz M, Reynolds CA, Pedersen NL. Body mass index across midlife and cognitive change in late life. Int J Obes (Lond) 2013;37:296–302. [DOI] [PMC free article] [PubMed] [Google Scholar]
- 32.Dahl AK, Hassing LB. Obesity and cognitive aging. Epidemiol Rev 2013;35:22–32. [DOI] [PubMed] [Google Scholar]
- 33.Hayden KM, Zandi PP, Lyketsos CG, et al. Vascular risk factors for incident Alzheimer disease and vascular dementia: the Cache County Study. Alzheimer Dis Assoc Disord 2006;20:93–100. [DOI] [PubMed] [Google Scholar]
- 34.Gustafson D, Rothenberg E, Blennow K, Steen B, Skoog I. An 18-year follow-up of overweight and risk of Alzheimer disease. Arch Intern Med 2003;163:1524–1528. [DOI] [PubMed] [Google Scholar]
- 35.Dao E, Davis JC, Sharma D, Chan A, Nagamatsu LS, Liu-Ambrose T. Change in body fat mass is independently associated with executive functions in older women: a secondary analysis of a 12-month randomized controlled trial. PLoS One 2013;8:e52831. [DOI] [PMC free article] [PubMed] [Google Scholar]
- 36.Rocca WA, Mielke MM, Vemuri P, Miller VM. Sex and gender differences in the causes of dementia: a narrative review. Maturitas 2014;79:196–201. [DOI] [PMC free article] [PubMed] [Google Scholar]
- 37.Christensen A, Pike CJ. Menopause, obesity and inflammation: interactive risk factors for Alzheimer's disease. Front Aging Neurosci 2015;7:130. [DOI] [PMC free article] [PubMed] [Google Scholar]
- 38.Chedraui P, Jaramillo W, Pérez-López FR, Escobar GS, Morocho N, Hidalgo L. Pro-inflammatory cytokine levels in postmenopausal women with the metabolic syndrome. Gynecol Endocrinol 2011;27:685–691. [DOI] [PubMed] [Google Scholar]
- 39.Pfeilschifter J, Köditz R, Pfohl M, Schatz H. Changes in proinflammatory cytokine activity after menopause. Endocr Rev 2002;23:90–119. [DOI] [PubMed] [Google Scholar]
- 40.Macova M, Armando I, Zhou J, et al. Estrogen reduces aldosterone, upregulates adrenal angiotensin II AT2 receptors and normalizes adrenomedullary Fra-2 in ovariectomized rats. Neuroendocrinology 2008;88:276–286. [DOI] [PMC free article] [PubMed] [Google Scholar]
- 41.O'Hagan TS, Wharton W, Kehoe PG. Interactions between oestrogen and the renin angiotensin system: potential mechanisms for gender differences in Alzheimer's disease. Am J Neurodegener Dis 2012;1:266–279. [PMC free article] [PubMed] [Google Scholar]
- 42.Buleishvili M, Lobjanidze N, Ormotsadze G, Enukidze M, Machavariani M, Sanikidze T. Estrogen related mechanisms of hypertension in menopausal women. Georgian Med News 2016:45–51. [PubMed] [Google Scholar]
- 43.Kim JP, Seo SW, Shin HY, et al. Effects of education on aging-related cortical thinning among cognitively normal individuals. Neurology 2015;85:806–812. [DOI] [PubMed] [Google Scholar]
- 44.Schmand B, Smit JH, Geerlings MI, Lindeboom J. The effects of intelligence and education on the development of dementia: a test of the brain reserve hypothesis. Psychol Med 1997;27:1337–1344. [DOI] [PubMed] [Google Scholar]
- 45.Qizilbash N, Gregson J, Johnson ME, et al. BMI and risk of dementia in two million people over two decades: a retrospective cohort study. Lancet Diabetes Endocrinol 2015;3:431–436. [DOI] [PubMed] [Google Scholar]
- 46.Fitzpatrick AL, Kuller LH, Lopez OL, et al. Midlife and late-life obesity and the risk of dementia: cardiovascular health study. Arch Neurol 2009;66:336–342. [DOI] [PMC free article] [PubMed] [Google Scholar]
- 47.Grundman M, Corey-Bloom J, Jernigan T, Archibald S, Thal LJ. Low body weight in Alzheimer's disease is associated with mesial temporal cortex atrophy. Neurology 1996;46:1585–1591. [DOI] [PubMed] [Google Scholar]
- 48.Santos JR, Gois AM, Mendonça DM, Freire MA. Nutritional status, oxidative stress and dementia: the role of selenium in Alzheimer's disease. Front Aging Neurosci 2014;6:206. [DOI] [PMC free article] [PubMed] [Google Scholar]
- 49.Gray SL, Anderson ML, Hubbard RA, et al. Frailty and incident dementia. J Gerontol A Biol Sci Med Sci 2013;68:1083–1090. [DOI] [PMC free article] [PubMed] [Google Scholar]
- 50.Luine VN. Estradiol and cognitive function: past, present and future. Horm Behav 2014;66:602–618. [DOI] [PMC free article] [PubMed] [Google Scholar]
Associated Data
This section collects any data citations, data availability statements, or supplementary materials included in this article.
Data Availability Statement
Anonymized and statistical information of all the participants was made available to and shared only among qualified investigators.


