Abstract
Objective
To study the intrinsic organization of the thalamocortical circuitry in patients with generalized epilepsy with tonic-clonic seizures (GTCS) via resting-state fMRI (rs-fMRI) connectome analysis and to evaluate its relation to drug response.
Methods
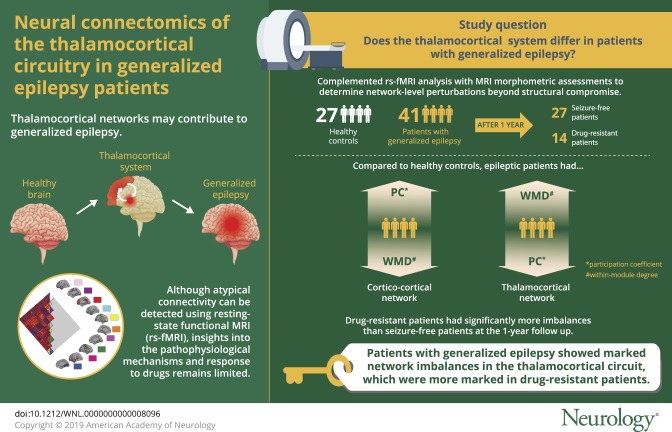
In a prospectively followed-up sample of 41 patients and 27 healthy controls, we obtained rs-fMRI and structural MRI. After 1 year of follow-up, 27 patients were classified as seizure-free and 14 as drug-resistant. We examined connectivity within and between resting-state communities in cortical and thalamic subregions. In addition to comparing patients to controls, we examined associations with seizure control. We assessed reproducibility in an independent cohort of 21 patients.
Results
Compared to controls, patients showed a more constrained network embedding of the thalamus, while frontocentral neocortical regions expressed increased functional diversity. Findings remained significant after regressing out thalamic volume and cortical thickness, suggesting independence from structural alterations. We observed more marked network imbalances in drug-resistant compared to seizure-free patients. Findings were similar in the reproducibility dataset.
Conclusions
Our findings suggest a pathoconnectomic mechanism of generalized epilepsy centered on diverging changes in cortical and thalamic connectivity. More restricted thalamic connectivity could reflect the tendency to engage in recursive thalamocortical loops, which may contribute to hyperexcitability. Conversely, increased connectional diversity of frontocentral networks may relay abnormal activity to an extended bilateral territory. Network imbalances were observed shortly after diagnosis and related to future drug response, suggesting clinical utility.
Converging evidence indicates a key role of thalamocortical networks in generalized epilepsy with tonic-clonic seizures (GTCS), one of the main idiopathic/genetic generalized epilepsy syndromes. Indeed, electrophysiologic work has shown contributions of both the thalamus and neocortex to the generation and propagation of generalized seizures.1,2 Structural MRI studies complemented these findings, indicating morphologic anomalies in both the thalamus and neocortex.3 More recently, resting-state fMRI (rs-fMRI) approaches have supported atypical functional network organization, showing aberrant connectivity when seeding from either cortical or thalamic regions.4,5 Despite their contribution to localizing thalamocortical anomalies, mapping of atypical connectivity alone offers rather limited insights into how anomalies may translate into pathophysiologic mechanisms at macroscale, particularly with respect to drug-response patterns.
Emerging connectomic approaches lend quantitative markers of whole-brain network organization.6–9 A core feature is modularity, i.e., the decomposability of the brain into modules/communities of closely-interacting regions.10,11 Community organization plays a key role in system-level dynamics. Notably, it also helps to typify network-level properties of individual regions, e.g., their connectivity to their overarching community or to other modules.12,13 Network neuroscience measures of within-module degree (WMD) and participation coefficient (PC) precisely quantify this and help to characterize the role of individual regions in the communication within and between communities. In healthy individuals, a recent study showed an increase in PC of the thalamus compared to cortical networks, supporting its role as a hub for diverse and integrative cross-community interactions.14
The current work studied the thalamocortical system in generalized epilepsy using community-informed rs-fMRI connectomics. We complemented the functional analysis with MRI morphometric assessments to determine network-level perturbations beyond structural compromise. Our cohort included patients with recent onset of seizures and those with a more chronic disorder, allowing us to study the effects of epilepsy duration on imaging markers. Furthermore, patients were prospectively followed up for 1 year after our imaging study, and we examined associations between network anomalies and drug-response patterns.
Methods
Participants
We studied 62 consecutive patients admitted to the Nanjing Drum Tower Hospital between 2013 and 2017 who fulfilled the following inclusion criteria: (1) diagnosis of idiopathic/genetic generalized epilepsy with only GTCS according to the current International League Against Epilepsy (ILAE) seizure type classification15 based on electroclinical semiology (i.e., limb movements, loss of consciousness, absence of focal seizures, generalized spike-and-wave or poly-spike-waves discharges on scalp EEG, no focal abnormality on routine structural MRI, no obvious etiology; we excluded patients with myoclonic jerks or absence seizures to rule out patients with juvenile myoclonic epilepsy or juvenile absence epilepsy); (2) participation in a 3T research MRI on the same scanner (see below), which included structural and rs-fMRI, in addition to clinical imaging; (3) rs-fMRI data of sufficient quality (average cortical signal-to-noise ratio >50 and average head motion <2 mm/2°); and (4) prospective clinical follow-up after the imaging investigation of at least 1 year.
In 41 of 62 patients, we could establish the drug response using the ILAE criteria at a follow-up time point of ≥1 year after our imaging study16 and classify patients into seizure-free (n = 27) and not seizure-free (n = 14). Patients who were not seizure-free indeed had a higher seizure frequency compared to seizure-free patients (t = 3.3, p < 0.002). Our main analysis focused on these 41 patients (henceforth GE1; 19 women, mean ± SD age 25.41 ± 10.47 years). Among them, 17 were drug-naive at the time of imaging (mean ± SD duration 1.81 ± 2.12 years), and 28 had been treated with antiepileptic drugs (mean ± SD duration 10.4 ± 7.78 years) before the study.
Although the remaining 21 of 62 patients (henceforth GE2; 11 women, mean ± SD age 24.76 ± 8.14 years) underwent the same imaging, quality control, and follow-up as the others, we could not fully determine prospectively their drug response; most were seizure-free but for a shorter time than required by ILAE criteria.16 We analyzed this GE2 cohort separately to assess the replicability of our main findings in this independent cohort. Of note, GE2 had a shorter duration of epilepsy and was made up of more new-onset patients than GE1.
During the same recruitment interval, we also studied 27 healthy controls (HCs) who underwent the same imaging and whose imaging passed the same quality criteria as the patients’ imaging (9 women, mean ± SD age 25.67 ± 3.74 years).
Standard protocol approvals, registrations, and patient consents
The Research Ethics Board of Nanjing Drum Tower Hospital, The Affiliated Hospital of Nanjing University Medical School approved the study. All participants gave written informed consent.
MRI acquisition
Every participant underwent MRI on a Philips (Best, the Netherlands) 3T scanner with an 8-channel head coil. Acquisition included a 2D resting-state echo-planar imaging blood oxygenation level–dependent fMRI sequence (repetition time 2,000 milliseconds, echo time 30 milliseconds, flip angle 90°, voxel size 3.0 × 3.0 × 4.0 mm3, 35 slices, 230 volumes) and high-resolution 3D T1-weighted MRI using a 3D turbo field echo sequence (repetition time 9.8 milliseconds, echo time 4.6 milliseconds, inversion time 900 milliseconds, flip angle 8°, voxel size 1.0 × 1.0 × 1.0 mm3, 192 slices). During the rs-fMRI acquisition, participants were instructed to keep their eyes closed and to remain motionless.
Data preprocessing
fMRI preprocessing was carried out with DPABI for Matlab (MathWorks, Natick, MA).17 We excluded the first 10 images to ensure steady-state longitudinal magnetization and performed slice-time and motion correction. Functional images were then linearly coregistered to the corresponding T1-weighted image, followed by Dartel-based normalization and resampling to Montreal Neurological Institute 152 space. We statistically corrected for effects of head motion (using the Friston 24-parameter model) and mean white matter and CSF signal. We filtered the data using a 0.01- to 0.1-Hz pass band. We omitted spatial smoothing to avoid signal blurring in the thalamus and between cortical parcels. Among included participants, none had a maximal head motion >2 mm/2°, and none had an average temporal signal-to-noise ratio in the gray matter mask <50. With regard to head motion, there was no difference between patients with idiopathic generalized epilepsy and controls (p > 0.4), and the signal-to-noise ratios were also comparable (p > 0.4).
Cortico-cortical and thalamocortical connectome analysis
We followed a recently published community-informed analysis of cortico-cortical and thalamocortical networks.14 We carried out the analyses in each participant independently.
Cortico-cortical
We grouped cortical parcels into several large-scale communities according to a previously published decomposition.13,14 For each parcel, we calculated the WMD, a measure of connectivity to other parcels within the same community, and the PC, a measure of the diversity of connectivity across different communities.14 Similar to a previous study,14 we assessed findings at a density of 0.15. To ensure that results were not biased by the choice of a specific threshold, we repeated analyses across different densities (0.1–0.2).
Thalamocortical
Using the automated anatomic labeling, we outlined the spatial extent of the thalamus in Montreal Neurological Institute 152 space and correlated the time series of each thalamic voxel with the mean time series of each cortical parcel, resulting in a 620 × 333 matrix.14 We generated thalamocortical connectomes using a combined partial correlation and principal component approach, which controlled for 95% of time series variance across all other cortical parcels. Using a winner-takes-all strategy, we also assigned each thalamic voxel to the cortical community with the strongest partial correlation. As done previously,14 we z-scored cortical and thalamic PC/WMD measures with respect to parcels in the same community for a given individual.
Statistical analysis
We carried out our analyses using SurfStat (https://mica-mni.github.io/surfstat/)18 for Matlab. Using Student t tests, we compared thalamic and cortical WMD/PC values between patients with generalized epilepsy and HCs, controlling for age and sex. We corrected findings for multiple comparisons at a false discovery rate (FDR) of p < 0.05.19 To assess functional network anomalies beyond the effects of atrophy, we repeated the above WMD/PC comparisons controlling for thalamic volume estimated with FSL-FIRST (version 5.0, fsl.fmrib.ox.ac.uk/fsl/fslwiki/FIRST) and mean cortical thickness estimated with FreeSurfer (version 5.3, https://surfer.nmr.mgh.harvard.edu/).
A first post hoc analysis split the patient dataset based on medical history into drug-naive patients with a recent diagnosis of epilepsy (n = 17; mean ± SD duration 1.81 ± 2.12 years) and patients with chronic disease who were already treated by antiepileptic drugs before our study (n = 24; mean ± SD duration 10.4 ± 7.78 years). Controlling for age and sex, we compared each patient subgroup to HCs and patient subgroups to each other.
A second post hoc analysis assessed the association to prospective clinical follow-up. To this end, we compared functional network markers between those patients with generalized epilepsy who were seizure-free at follow-up (n = 27) to those who were not seizure-free (n = 14), controlling for age, sex, and duration of epilepsy at baseline.
Reproducibility analysis
We assessed the replicability of the overall group-level findings when comparing the independent GE2 group (n = 21; 11 women, mean ± SD age 24.76 ± 8.14 years) to HCs.
Data availability
Cortico-cortical and thalamocortical network feature data and details on both patient cohorts are available from Dryad (tables 1 and 2, doi.org/10.5061/dryad.bj486f4).
Results
Community-informed connectomics of cortico-cortical and thalamocortical networks
Cortico-cortical
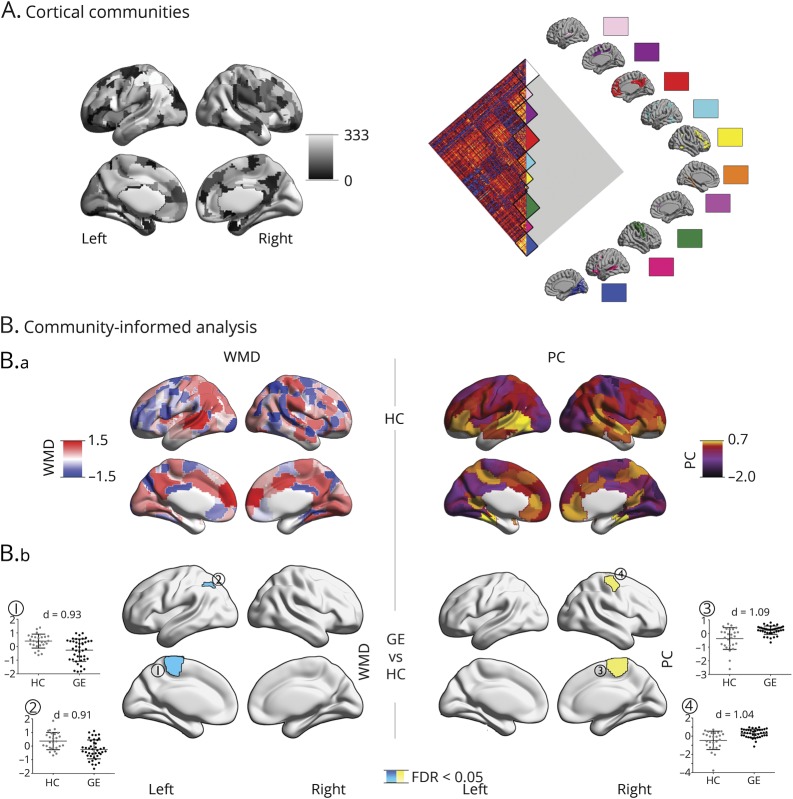
In the cortico-cortical connectome, HCs showed high WMD and PC in bilateral medial prefrontal, medial parietal, and insular regions, together with left temporoparietal regions (figure 1). WMD was furthermore elevated in bilateral medial occipital regions, while PC was high in lateral prefrontal cortices.
Figure 1. Community-based analysis of cortico-cortical networks.
(A) Gordon's 333 cortical parcels and 10 predefined communities. (B.a) Distribution of cortical within-module degree (WMD) and participation coefficient (PC) z scores, averaged across a sample of 27 healthy controls (HCs). (B.b) Differences between HCs (gray) and 41 patients with generalized epilepsy (GE) (black). Cyan/yellow clusters were corrected for multiple comparisons (p < 0.05; false discovery rate (FDR) corrected). Scatterplots represent WMD/PC values in significant clusters. Findings were corrected for age and sex.
Comparing GE1 patients to HCs at the level of cortico-cortical connectivity revealed reductions in WMD in patients, while PC increased. Specifically, patients showed lower WMD in the left paracentral lobule and angular gyrus (p < 0.05, FDR corrected; Cohen d = 0.91–0.93). In contrast, they showed increased PC in the right frontocentral region (p < 0.05, FDR corrected; d = 1.04–1.06).
Thalamocortical
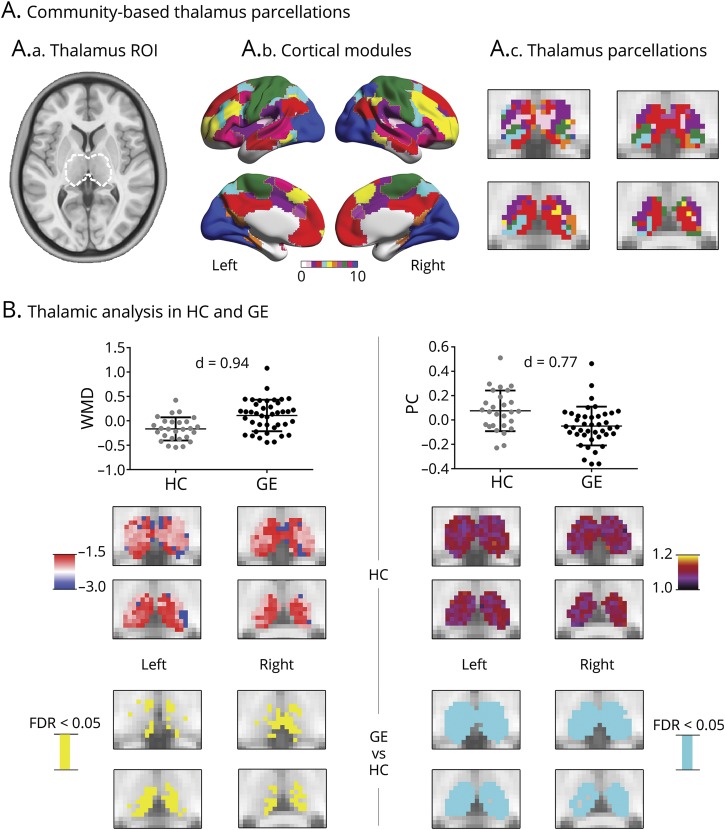
Assessing thalamocortical WMD and PC, we observed high WMD and PC in anterior, medial, posterior, and dorsal thalamic divisions in HCs (figure 2). When we compared thalamocortical WMD and PC between GE1 patients and HCs, patients demonstrated marked increases of WMD (p < 0.05, FDR-corrected; d = 0.94) and a widespread reduction in PC (p < 0.05, FDR corrected; d = 0.77). Although we presented main results at a density of 0.15, WMD/PC alterations were consistent across 0.1 to 0.2 density thresholds.
Figure 2. Thalamocortical analysis.
(A.a) The thalamus region of interest (ROI) outlined by a dashed white line, (A.b) cortical modules, and (A.c) thalamus parcellation. (B) Thalamic analysis in healthy controls (HCs) and patients with generalized epilepsy (GE). Scatterplots show average within-module degree (WMD) and participation coefficient (PC) across the entire ROI and slices the WMD/PC distribution across thalamic voxels, averaged across 27 HCs, as well as significant between-group differences (cyan/yellow: p < 0.05; false discovery rate [FDR] corrected). Findings were corrected for age and sex.
As in previous studies,20,21 our main analyses used models correcting for age and sex. However, we obtained similar findings when using models that omitted correction for both variables.
Functional network analysis after controlling for structural changes
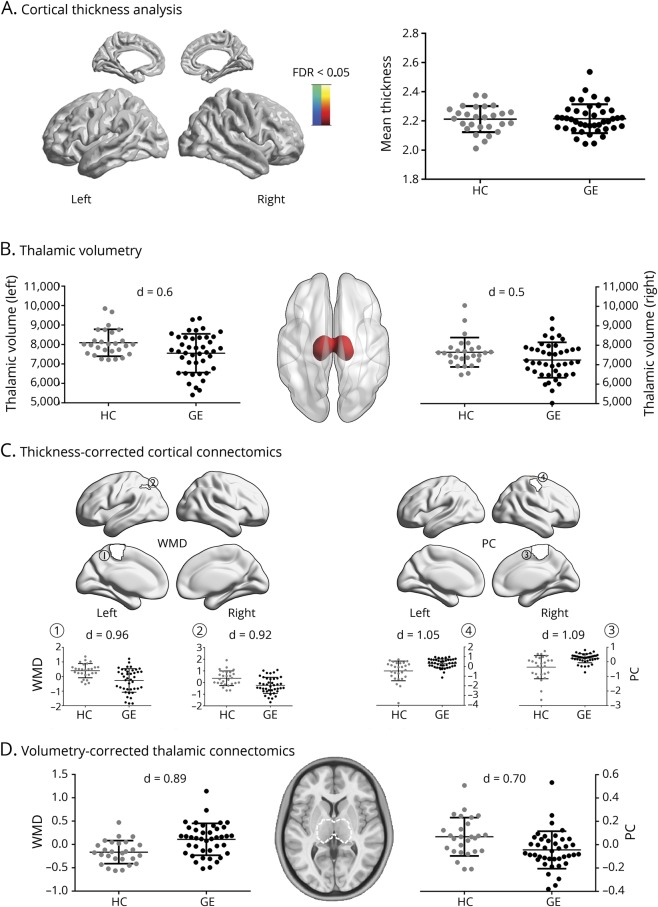
Comparing mean cortical thickness between GE1 patients and HCs, we did not find significant differences between groups (figure 3). Similarly, vertex-wise cortical thickness comparisons did not result in any findings that survived correction for multiple comparisons. On the other hand, patients showed bilateral thalamic atrophy (p < 0.025; d = 0.47–0.6). Functional network alterations in patients compared to HCs were robust when additionally controlled for mean cortical thickness in the statistical models, including WMD decreases and PC increases in cortical regions in patients. Similarly, thalamic WMD increases and PC decreases in patients compared to HCs were robust when we controlled for thalamic volume in the statistical models.
Figure 3. Robustness of functional findings against structural changes.
(A) Spatial distribution of MRI-based cortical thickness differences between healthy controls (HCs) (gray) and patients with generalized epilepsy (GE) (black). No vertex-wise findings survived correction for multiple comparisons. Mean cortical thickness is shown in the scatterplots. Thickness measures were corrected for age and sex. (B) Left/right thalamic volumes in HCs and patients with GE, with volumes corrected for age and sex. (C) Post hoc analysis in cortical parcels with significant within-module degree (WMD)/participation coefficient (PC) group differences (figure 1). WMD/PC values of HC and patients with GE were additionally corrected for mean cortical thickness. (D) Scatterplots show average thalamic WMD (left) and PC (right), additionally corrected for thalamus volume. FDR = false discovery rate; ROI = region of interest.
Relation to disease duration and treatment status
We subdivided the GE1 patient cohort on the basis of duration of epilepsy into drug-naive patients at the time of imaging (n = 17) and those with a chronic disorder (n = 24). Compared to HCs, we observed lower WMD and higher PC in the cortex and the inverse pattern in the thalamus in both subgroups, suggesting that imbalances were already present at onset. Indeed, while effects appeared slightly higher in patients with chronic disease, directly comparing patient subgroups did not yield a significant difference. The corresponding figures are available from Dryad (figures 1 and 2, doi.org/10.5061/dryad.bj486f4).
Relation to prospective drug-response patterns
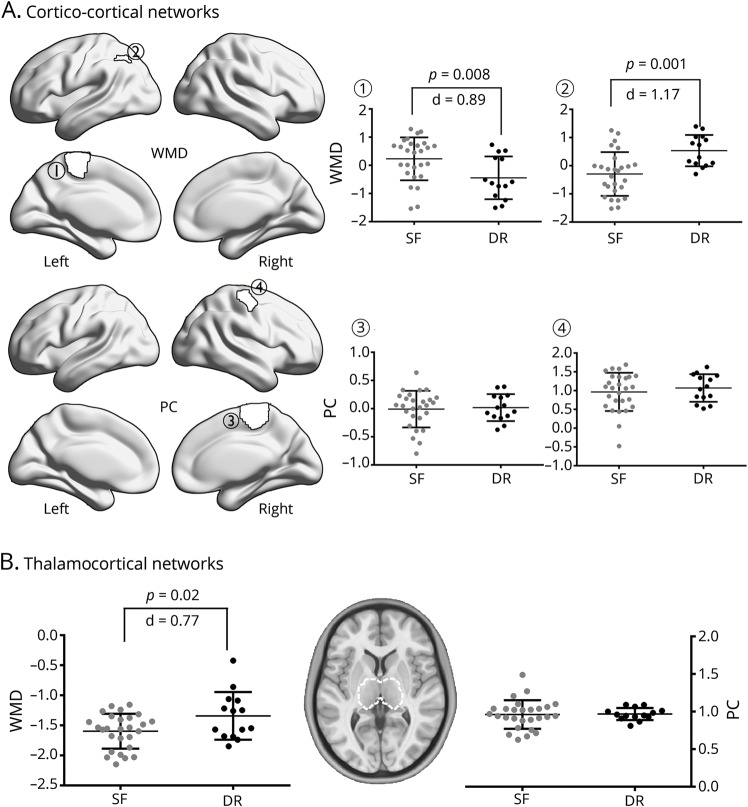
We stratified GE1 patients on the basis of their drug-response patterns after 1 year of follow-up into seizure-free and drug-resistant, controlling for age, sex, and duration of epilepsy at baseline (figure 4). Comparing both patient subgroups, we observed more marked thalamocortical imbalances in those who were diagnosed as drug-resistant compared to seizure-free patients. Specifically, we observed lower WMD in the left paracentral lobule and higher WMD in the left angular gyrus (p < 0.05; d = 0.85–0.96).
Figure 4. Analysis of seizure-free vs drug-resistant patients.
(A) Cortico-cortical network analysis in parcels with significant within-module degree (WMD)/participation coefficient (PC) differences from the overall group comparison (figure 1). Comparison of patients classified as drug-resistant (DR) (black) and seizure-free (SF) (gray) at follow-up, controlling for age, sex, and disease duration. (B) Analysis of WMD and PC of left and right thalamus.
Verification analysis
We obtained virtually identical results when we excluded a patient who had the youngest age at seizure onset (0.6 months). The corresponding figure summarizing these findings is available from Dryad (figure 3, doi.org/10.5061/dryad.bj486f4).
Reproducibility analysis
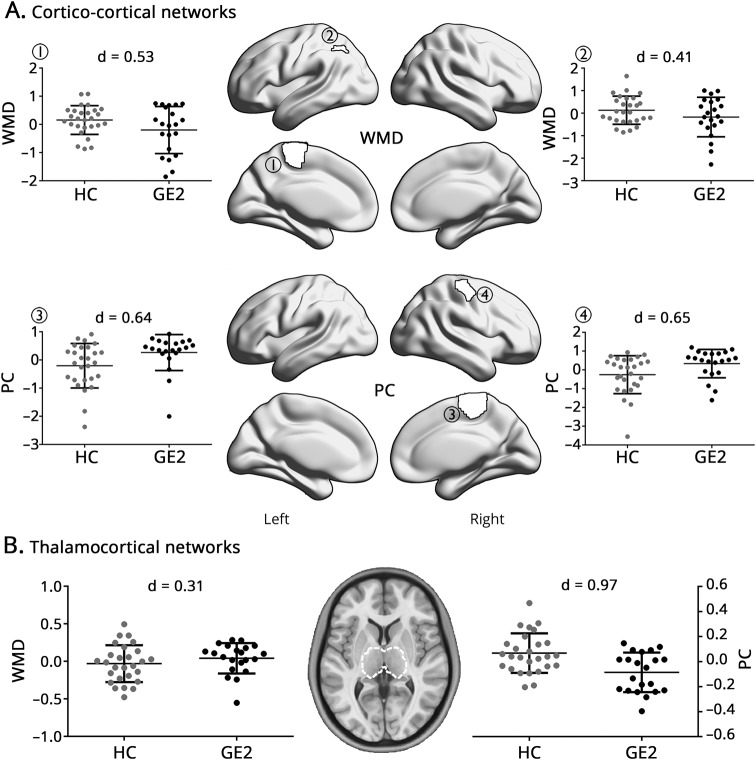
Comparing the replication (GE2) cohort to HCs, we observed moderate to high effects for cortical WMD reductions (d = 0.4–0.53) and PC increases (d = 0.64–0.65) as in the main analysis (figure 5). In the thalamus, patients also showed scattered WMD increases and a widespread PC reduction.
Figure 5. Comparing an independent cohort of 21 patents with idiopathic generalized epilepsy (GE2) and 27 healthy controls (HCs).
(A) Cortico-cortical network analysis, centered on parcels with significant within-module degree (WMD)/participation coefficient (PC) differences from the overall group comparison (figure 1). (B) Differences in thalamic WMD/PC. In both analyses, findings were corrected for age and sex.
Discussion
Harnessing connectome markers of intrinsic functional embedding of thalamic and cortical subregions within large-scale communities, we identified a marked network imbalance in epileptic patients with GTCS. Changes in network organization were characterized by an increase in connectional diversity of cortical regions, notably frontocentral cortices, while the thalamus showed a more restrictive and stereotypical connectivity profile. Findings were robust after we controlled for MRI markers of thalamocortical morphology, indicating network effects above and beyond structural compromise. Because the subgroup of newly diagnosed patients (before initiation of antiepileptic drug therapy) showed similar findings, our findings suggest the possibility of a preexisting functional imbalance contributing to the development of the disease. Notably, we observe more marked alterations in patients who continued to have seizures at follow-up despite drug therapy compared to those who were seizure-free, suggesting a potential utility of community-informed thalamocortical circuit profiling for drug-response prognosis.
We used a recently developed framework to study cortico-cortical networks and to parameterize connectome embedding of the thalamus, one of the most globally connected brain regions,14,22,23 in HCs and patients. Central to our approach was an initial decomposition of the functional connectome into communities, ensembles of closely interacting regions including default mode, salience, frontoparietal, sensory, and motor networks. We then calculated WMD, indexing integration of a region within its overarching community, and PC to measure its connectional diversity across communities. Regions with high WMD, also referred to as provincial hubs, are thought to participate in more specialized processes,24 while those with high PC serve as connector hubs mediating integrative global communication across distributed systems. Examining the topography of cortical WMD and PC values in our HCs, we observed a preferential aggregation of provincial and connector hubs in default mode networks, a finding resembling recent data in healthy young adults14 and in line with earlier results showing high centrality of default mode nodes in terms of both long- and short-range connectivity.25 Furthermore, we confirmed that the thalamus shows rather similar WMD yet markedly elevated PC compared to cortical nodes in corresponding communities, re-emphasizing its key role in mediating intercommunity cross talk. Notably, by comparing patients to HCs, we gathered evidence for a marked imbalance in both components of the corticothalamic system, characterized by reduced PC but increased WMD in the thalamus, while cortico-cortical networks showed an inverted pattern, particularly in frontocentral networks. With respect to the interhemispheric divergence of cortical WMD and PC findings, it is possible that increased functional diversity in one hemisphere (i.e., PC) may cascade toward reduced WMD in other nodes of its overarching module (which generally makes up the contralateral homolog region as well) and vice versa. The interhemispheric findings observed in the current study may thus point to a bilateral imbalance of specifically the paracentral functional network in generalized epilepsy. Our results were replicated in a comparison of an independent patient cohort initially held out to the HCs, suggesting robustness. By stratifying connectional anomalies in generalized epilepsy relative to their role within and across network communities, our findings extend previous work that mainly localized structural and network anomalies,3,26,27 moving toward pathoconnectomic models centered on the dichotomy between thalamic and cortical connectivity.
The diverging changes in cortical and thalamic embedding with macroscale functional communities in our patients can be easily understood as a “fanning-in” of thalamic connections together with “fanning-out” of cortical connectivity profiles. A more restricted thalamic connectivity could reflect the tendency to engage in more monotonic, and possibly recursive, thalamocortical functional loops, which may ultimately contribute to network synchronization and hyperexcitability. Animal studies have demonstrated that increased rhythmic firing in the neocortex and thalamus may indeed lead to spike-and-wave discharges.28,29 Further support for a role of atypical thalamocortical interactions in generalized epileptic activity1,30 comes from experimental studies in animals in which abnormal oscillations in either region may subsequently lead to synchronization of large-scale thalamocortical loops.31,32 Notably, seizure-initiating nodes in the thalamocortical system may vary across species, across syndromes, and even from one episode to the next in a single individual.33 With respect to cortical regions, the fanning-out of nodes directly involved or proximal to the initially dysregulated thalamocortical network, notably the frontocentral areas we observed in the current study, may further relay abnormal electric activity to an extended bilateral cortical territory. Findings based on resting-state magnetoencephalography are in line with these results, suggesting increases in medial frontal and temporal regions in mixed generalized epilepsy cohorts.34
The subgroup of our patients with newly diagnosed epilepsy before the initiation of drug therapy presented with an imbalance similar to that of patients who were treated by antiepileptic medication for several years. A similar conclusion can also be made when considering the results of the initially held-out patient cohort (GE2), in whom treatment outcome could not be reliably established at the time of study and who had overall a shorter duration compared to our main GE1 patient cohort. Although these findings are based on 2 small patient subgroups, they suggest the possibility of preexisting alterations in thalamocortical circuit organization, possibly of genetic and neurodevelopmental origin before clinical symptoms arise35 and before treatment affects network function36,37 and structure.38 Generalized epilepsy syndromes have traditionally been subsumed under the umbrella term idiopathic generalized epilepsy; however, a genetic origin is now largely accepted.39 This is also reflected in discussions to revise the nomenclature from idiopathic generalized epilepsy to genetic generalized epilepsy,40 even if the full genetic underpinnings of these syndromes remain to be established.41 Future studies that combine neuroimaging and genetic analysis and work based on sibling designs might thus be worthwhile. In the context of our findings, such work could clarify whether the thalamocortical imbalance represents a genetically mediated endophenotype, paralleling other endophenotypes identified in other generalized subtypes,42 or whether it is selectively found in patients affected by the disease.
Although the syndrome with GTCS only is often associated with favorable outcomes,39,43 a subgroup of patients do not show adequate seizure control.44 Prospective markers of drug resistance are virtually nonexistent. In our study, we observed more marked perturbations of thalamocortical circuit organization in patients who continued to have seizures at follow-up despite antiepileptic drug therapy compared to those in whom seizures were well controlled. Because these findings are based on small samples and derived from post hoc analyses, they need to be interpreted with care. First, patients may not always have benefited from optimal medical treatment. In fact, some were treated by drugs such as carbamazepine, phenytoin, and phenobarbital, which may increase seizure frequency in some patients with generalized seizures.45 Furthermore, our drug-resistant cohort was composed mainly of patients who already had a more chronic disease at baseline (i.e., 4 of 14 with new onset) compared to the drug-resistant subgroup (14 of 27 with new-onset seizures). Nevertheless, when comparing patients stratified by prospective drug control, we statistically corrected for preexisting disease duration and could thus some sources of between-cohort inhomogeneity. Therefore, our findings provide an overall optimistic outlook on the potential of thalamocortical network metrics for drug-response prognosis in generalized epilepsy,43 and we recommend future prospective studies of large cohorts with close monitoring of seizures and medication. Such work would benefit from multicentric data aggregation and dissemination efforts,46 because this may potentially give access to large and more homogeneous cohorts. Alternatively, it may also provide a gateway to investigate patients with GE, regardless of the particular subsyndrome to identify common markers among those responding and those who are refractory to medication.
Glossary
- FDR
false discovery rate
- GTCS
generalized tonic-clonic seizures
- HC
healthy control
- ILAE
International League Against Epilepsy
- PC
participation coefficient
- rs-fMRI
resting-state fMRI
- WMD
within-module degree
Author contributions
Z. Wang: study design; MRI acquisition and processing; statistical analysis; data interpretation; drafting/revising manuscript. S. Larivière: MRI processing; data interpretation; drafting/revising manuscript. Q. Xu: MRI processing; data interpretation. Z. Wang and Y. Xu: patient diagnosis and grouping. B. Zhu: revising manuscript. R. Vos de Wael: MRI processing; data interpretation. S.-J. Hong, N. Bernasconi, A. Bernasconi, and B. Zhang: revising manuscript; data interpretation. Z. Zhang and B. Bernhardt: study design; data interpretation; drafting/revising manuscript; study supervision.
Study funding
Z.W., Q.X., and B.Z. were supported by the Natural Science Foundation of China (81301198, 81401402, 81571040). Z.W. was also supported by the Key Project supported by Medical Science and Technology Development Foundation, Nanjing Department of Health (YKK18087), and Jiangsu Government Scholarship for Overseas Studies. S.-J.H was supported by a Canadian League Against Epilepsy Postdoctoral Fellowship. N.B. and A.B. were supported by Canadian Institutes of Health Research (MOP-57840 to A.B., MOP-123520 to N.B.) and Fonds de la Recherche du Quebec–Santé. Z.Z. was supported by National Science Foundation of China (81871345, 81422022) and China Postdoctoral Science Foundation (2016M603064). B.C.B. acknowledges research support from the National Science and Engineering Research Council of Canada (Discovery-1304413), Canadian Institutes of Health Research (FDN-154298), Azrieli Center for Autism Research, and SickKids Foundation (NI17-039), as well as salary support from the Fonds de la Recherche du Quebec–Santé (Chercheur Boursier).
Disclosure
The authors report no disclosures relevant to the manuscript. Go to Neurology.org/N for full disclosures.
References
- 1.Blumenfeld H. From molecules to networks: cortical/subcortical interactions in the pathophysiology of idiopathic generalized epilepsy. Epilepsia 2003;44(suppl 2):7–15. [DOI] [PubMed] [Google Scholar]
- 2.Gotman J, Grova C, Bagshaw A, Kobayashi E, Aghakhani Y, Dubeau F. Generalized epileptic discharges show thalamocortical activation and suspension of the default state of the brain. Proc Natl Acad Sci USA 2005;102:15236–15240. [DOI] [PMC free article] [PubMed] [Google Scholar]
- 3.Bernhardt BC, Rozen DA, Worsley KJ, Evans AC, Bernasconi N, Bernasconi A. Thalamo-cortical network pathology in idiopathic generalized epilepsy: insights from MRI-based morphometric correlation analysis. NeuroImage 2009;46:373–381. [DOI] [PubMed] [Google Scholar]
- 4.Wang Z, Zhang Z, Jiao Q, et al. Impairments of thalamic nuclei in idiopathic generalized epilepsy revealed by a study combining morphological and functional connectivity MRI. PLoS One 2012;7:e39701. [DOI] [PMC free article] [PubMed] [Google Scholar]
- 5.Wang Z, Lu G, Zhang Z, et al. Altered resting state networks in epileptic patients with generalized tonic-clonic seizures. Brain Res 2011;1374:134–141. [DOI] [PubMed] [Google Scholar]
- 6.Gleichgerrcht E, Kocher M, Bonilha L. Connectomics and graph theory analyses: novel insights into network abnormalities in epilepsy. Epilepsia 2015;56:1660–1668. [DOI] [PubMed] [Google Scholar]
- 7.Stam CJ. Modern network science of neurological disorders. Nat Rev Neurosci 2014;15:683–695. [DOI] [PubMed] [Google Scholar]
- 8.Bernhardt BC, Bonilha L, Gross DW. Network analysis for a network disorder: the emerging role of graph theory in the study of epilepsy. Epilepsy Behav 2015;50:162–170. [DOI] [PubMed] [Google Scholar]
- 9.Tavakol S, Royer J, Lowe AJ, et al. Neuroimaging and connectomics of drug-resistant epilepsy at multiple scales: from focal lesions to macroscale networks. Epilepsia 2019;60:593–604. [DOI] [PMC free article] [PubMed] [Google Scholar]
- 10.Buckner RL, Krienen FM, Castellanos A, Diaz JC, Yeo BT. The organization of the human cerebellum estimated by intrinsic functional connectivity. J Neurophysiol 2011;106:2322–2345. [DOI] [PMC free article] [PubMed] [Google Scholar]
- 11.Power Jonathan D, Cohen Alexander L, Nelson Steven M, et al. Functional network organization of the human brain. Neuron 2011;72:665–678. [DOI] [PMC free article] [PubMed] [Google Scholar]
- 12.Power JD, Schlaggar BL, Lessov-Schlaggar CN, Petersen SE. Evidence for hubs in human functional brain networks. Neuron 2013;79:798–813. [DOI] [PMC free article] [PubMed] [Google Scholar]
- 13.Bertolero MA, Yeo BT, D'Esposito M. The modular and integrative functional architecture of the human brain. Proc Natl Acad Sci USA 2015;112:E6798–E6807. [DOI] [PMC free article] [PubMed] [Google Scholar]
- 14.Hwang K, Bertolero MA, Liu WB, D'Esposito M. The human thalamus is an integrative hub for functional brain networks. J Neurosci 2017;37:5594–5607. [DOI] [PMC free article] [PubMed] [Google Scholar]
- 15.Fisher RS, Cross JH, French JA, et al. Operational classification of seizure types by the International League Against Epilepsy: position paper of the ILAE Commission for Classification and Terminology. Epilepsia 2017;58:522–530. [DOI] [PubMed] [Google Scholar]
- 16.Kwan P, Arzimanoglou A, Berg AT, et al. Definition of drug resistant epilepsy: consensus proposal by the Ad Hoc Task Force of the ILAE Commission on Therapeutic Strategies. Epilepsia 2010;51:1069–1077. [DOI] [PubMed] [Google Scholar]
- 17.Yan CG, Wang XD, Zuo XN, Zang YF. DPABI: data processing & analysis for (resting-state) brain imaging. Neuroinformatics 2016;14:339–351. [DOI] [PubMed] [Google Scholar]
- 18.Worsley KJ, Taylor JE, Carbonell F, et al. SurfStat: a MatLab toolbox for the statistical analysis of univariate and multivariate surface and volumetric data using linear mixed effects models and random field theory. NeuroImage 2009;47:S102. [Google Scholar]
- 19.Benjamini Y, Hochberg Y. Controlling the false discovery rate: a practical and powerful approach to multiple testing. J R Stat Soc 1995;57:289–300. [Google Scholar]
- 20.Bernhardt BC, Bernasconi N, Hong SJ, Dery S, Bernasconi A. Subregional mesiotemporal network topology is altered in temporal lobe epilepsy. Cereb Cortex 2016;26:3237–3248. [DOI] [PMC free article] [PubMed] [Google Scholar]
- 21.Bernhardt BC, Chen Z, He Y, Evans AC, Bernasconi N. Graph-theoretical analysis reveals disrupted small-world organization of cortical thickness correlation networks in temporal lobe epilepsy. Cereb Cortex 2011;21:2147–2157. [DOI] [PubMed] [Google Scholar]
- 22.Crossley NA, Mechelli A, Vértes PE, et al. Cognitive relevance of the community structure of the human brain functional coactivation network. Proc Natl Acad Sci USA 2013;110:11583–11588. [DOI] [PMC free article] [PubMed] [Google Scholar]
- 23.Sherman SM. Thalamic relays and cortical functioning. Prog Brain Res 2005;149:107–126. [DOI] [PubMed] [Google Scholar]
- 24.Guimerà R, Nunes Amaral LA. Functional cartography of complex metabolic networks. Nature 2005;433:895–900. [DOI] [PMC free article] [PubMed] [Google Scholar]
- 25.Sepulcre J, Liu H, Talukdar T, Martincorena I, Yeo BT, Buckner RL. The organization of local and distant functional connectivity in the human brain. PLoS Comput Biol 2010;6:e1000808. [DOI] [PMC free article] [PubMed] [Google Scholar]
- 26.Kim JB, Suh SI, Seo WK, Oh K, Koh SB, Kim JH. Altered thalamocortical functional connectivity in idiopathic generalized epilepsy. Epilepsia 2014;55:592–600. [DOI] [PubMed] [Google Scholar]
- 27.O'Muircheartaigh J, Vollmar C, Barker GJ, et al. Abnormal thalamocortical structural and functional connectivity in juvenile myoclonic epilepsy. Brain 2012;135:3635–3644. [DOI] [PMC free article] [PubMed] [Google Scholar]
- 28.Avoli M, Gloor P. Interaction of cortex and thalamus in spike and wave discharges of feline generalized penicillin epilepsy. Exp Neurol 1982;76:196–217. [DOI] [PubMed] [Google Scholar]
- 29.Steriade M, Contreras D. Relations between cortical and thalamic cellular events during transition from sleep patterns to paroxysmal activity. J Neurosci 1995;15:623–642. [DOI] [PMC free article] [PubMed] [Google Scholar]
- 30.Gloor P. Generalized epilepsy with spike-and-wave discharge: a reinterpretation of its electrographic and clinical manifestations: the 1977 William G. Lennox Lecture, American Epilepsy Society. Epilepsia 1979;20:571–588. [DOI] [PubMed] [Google Scholar]
- 31.Meeren HK, Pijn JP, Van Luijtelaar EL, Coenen AM, Lopes da Silva FH. Cortical focus drives widespread corticothalamic networks during spontaneous absence seizures in rats. J Neurosci 2002;22:1480–1495. [DOI] [PMC free article] [PubMed] [Google Scholar]
- 32.Castro-Alamancos MA. Neocortical synchronized oscillations induced by thalamic disinhibition in vivo. J Neurosci 1999;19:RC27. [DOI] [PMC free article] [PubMed] [Google Scholar]
- 33.Blumenfeld H. Cellular and network mechanisms of spike-wave seizures. Epilepsia 2005;46(suppl 9):21–33. [DOI] [PubMed] [Google Scholar]
- 34.Elshahabi A, Klamer S, Sahib AK, Lerche H, Braun C, Focke NK. Magnetoencephalography reveals a widespread increase in network connectivity in idiopathic/genetic generalized epilepsy. PLoS One 2015;10:e0138119. [DOI] [PMC free article] [PubMed] [Google Scholar]
- 35.Chowdhury FA, Woldman W, FitzGerald TH, et al. Revealing a brain network endophenotype in families with idiopathic generalised epilepsy. PLoS One 2014;9:e110136. [DOI] [PMC free article] [PubMed] [Google Scholar]
- 36.Wandschneider B, Koepp MJ. Pharmaco fMRI: determining the functional anatomy of the effects of medication. Neuroimage Clin 2016;12:691–697. [DOI] [PMC free article] [PubMed] [Google Scholar]
- 37.Wandschneider B, Burdett J, Townsend L, et al. Effect of topiramate and zonisamide on fMRI cognitive networks. Neurology 2017;88:1165–1171. [DOI] [PMC free article] [PubMed] [Google Scholar]
- 38.Pardoe HR, Berg AT, Jackson GD. Sodium valproate use is associated with reduced parietal lobe thickness and brain volume. Neurology 2013;80:1895–1900. [DOI] [PMC free article] [PubMed] [Google Scholar]
- 39.Panayiotopoulos CP. The Epilepsies: Seizures, Syndromes and Management. Bladon Medical Publishing; Oxfordshire, UK: 2005. [PubMed] [Google Scholar]
- 40.Scheffer IE, Berkovic S, Capovilla G, et al. ILAE classification of the epilepsies: position paper of the ILAE Commission for Classification and Terminology. Epilepsia 2017;58:512–521. [DOI] [PMC free article] [PubMed] [Google Scholar]
- 41.Jallon P, Latour P. Epidemiology of idiopathic generalized epilepsies. Epilepsia 2005;46(suppl 9):10–14. [DOI] [PubMed] [Google Scholar]
- 42.Wandschneider B, Centeno M, Vollmar C, et al. Motor co-activation in siblings of patients with juvenile myoclonic epilepsy: an imaging endophenotype? Brain 2014;137:2469–2479. [DOI] [PMC free article] [PubMed] [Google Scholar]
- 43.Holtkamp M, Kowski AB, Merkle H, Janz D. Long-term outcome in epilepsy with grand mal on awakening: forty years of follow-up. Ann Neurol 2014;75:298–302. [DOI] [PubMed] [Google Scholar]
- 44.Gomez-Ibanez A, McLachlan RS, Mirsattari SM, Diosy DC, Burneo JG. Prognostic factors in patients with refractory idiopathic generalized epilepsy. Epilepsy Res 2017;130:69–73. [DOI] [PubMed] [Google Scholar]
- 45.Benbadis SR. Practical management issues for idiopathic generalized epilepsies. Epilepsia 2005;46(suppl 9):125–132. [DOI] [PubMed] [Google Scholar]
- 46.Whelan CD, Altmann A, Botia JA, et al. Structural brain abnormalities in the common epilepsies assessed in a worldwide ENIGMA study. Brain 2018;141:391–408. [DOI] [PMC free article] [PubMed] [Google Scholar]
Associated Data
This section collects any data citations, data availability statements, or supplementary materials included in this article.
Data Availability Statement
Cortico-cortical and thalamocortical network feature data and details on both patient cohorts are available from Dryad (tables 1 and 2, doi.org/10.5061/dryad.bj486f4).


