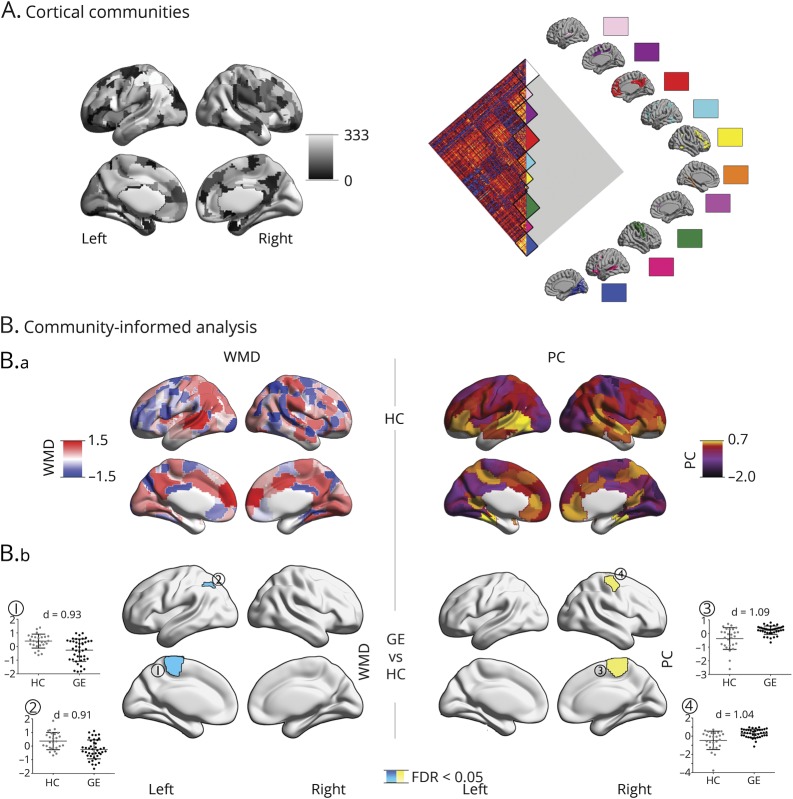
Figure 1. Community-based analysis of cortico-cortical networks.
(A) Gordon's 333 cortical parcels and 10 predefined communities. (B.a) Distribution of cortical within-module degree (WMD) and participation coefficient (PC) z scores, averaged across a sample of 27 healthy controls (HCs). (B.b) Differences between HCs (gray) and 41 patients with generalized epilepsy (GE) (black). Cyan/yellow clusters were corrected for multiple comparisons (p < 0.05; false discovery rate (FDR) corrected). Scatterplots represent WMD/PC values in significant clusters. Findings were corrected for age and sex.

