Abstract
Objective:
To provide calibration curves for correcting intraocular pressure (IOP) measurements in cat, cow, and sheep with the Tono-Pen XL tonometer.
Animal Studied:
12 eyes from 9 cats, 13 eyes from 7 cows, 10 eyes from 5 sheep.
Procedure:
The anterior chamber of the eye was cannulated in vivo or ex vivo with a fine needle and IOP was varied from 10–90 mmHg in steps of 10 mmHg by adjusting the height of a saline reservoir connected to the needle. For each pressure setting several readings of IOP were made with the tonometer.
Results:
The relationship between Tono-Pen reading and manometer setting was linear over the full range of measurement. However, the slope of the data regression line deviated significantly from one, indicating that the instrument systematically underestimated IOP. For cats the average slope was 0.62 and for cows and sheep it was 0.72 and 0.69, respectively. For the latter animals the regression line also had a non-zero intercept of ~4.5 mmHg. Similar results were obtained from intact and excised eyes and with different Tono-Pen XLs.
Conclusions:
Though developed for use on humans, the Tono-Pen XL can provide reproducible and accurate measurement of IOP in cat, cow, and sheep when suitably calibrated by manometry. The calibration curves provided here, and by implication those reported for other animals using this tonometer, differ in slope from those measured with earlier models of the Tono-Pen. The reproducibility of the curves we obtained implies that they can be used to correct IOP readings from the Tono-Pen XL when manometry is not possible.
Keywords: intraocular pressure, tonometer, glaucoma, cat, cow, sheep
INTRODUCTION
The Tono-Pen is a handheld electromechanical device that measures intraocular pressure (IOP) without penetrating the eye. To take a pressure reading the 3.2-mm tip of the device is gently placed in contact with the cornea. The contact slightly flattens the corneal surface, which resists the deformation and presses against a 1.2-mm plunger housed in the tip. A strain gauge attached to the plunger converts the pressure into an electrical signal that is analyzed for acceptability and digitally displayed. Current models of the device have a microprocessor that stores several IOP readings and displays the mean and coefficient of variation of those readings.
Although the Tono-Pen was developed for human subjects, the principles of its operation apply to any eye and so a growing number of researchers and veterinary clinicians are using the device to measure IOP in nonhuman animals. For the pressure measurements to be accurate the device should be properly calibrated because the mechanical properties of an animal eye could differ greatly from those of the human eye. A common method of tonometer calibration is to cannulate the eye with a needle and vary IOP by constant pressure perfusion (ie., manometry). While this may not be practical in a clinical setting, researchers have found that the Tono-Pen underestimates IOP in a variety of animals by an amount that scales linearly with pressure.1–10 The scaling factor was shown to be reproducible for a given animal but ranged from 0.5 to 0.8 across animal species. The reason for the diversity of scaling factors is unclear. It could reflect species differences in corneal thickness, rigidity, and angle of curvature, and perhaps the experimental condition of the eyes (ie., intact versus excised). Factory changes in tonometer design might also be involved. One study noted that in rat the scaling factor of the Tono-Pen XL was less than that of the Tono-Pen 2, an earlier model,9 and a comparison of scaling factors reported for the models by two rabbit studies supports the finding.2,3
Our aim was to measure IOP in cat eyes using the Tono-Pen XL. Since recent literature indicates that pressure readings from this tonometer might differ from that of earlier models and that the performance of the device might differ across animal species, we set out to calibrate the device by direct manometry. To assess the reliability of the calibration curves we also measured IOP in cow and sheep eyes using different Tono-Pen XLs.
MATERIALS AND METHODS
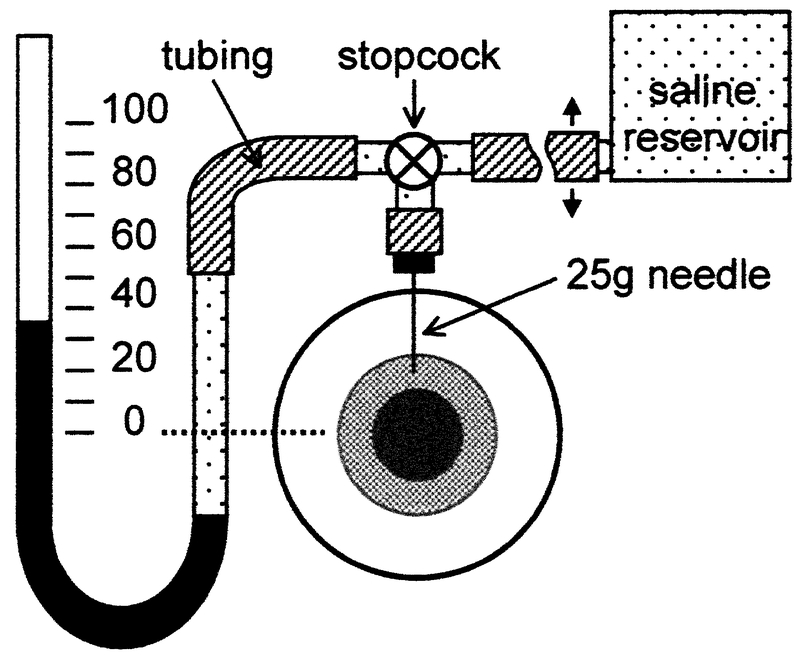
All experimental procedures were approved by Northwestern University Animal Care and Use Committee and were in accordance with National Institutes of Health guidelines. To manipulate IOP a 25-gauge needle was inserted through the peripheral cornea into the anterior chamber of the eye (Fig. 1). For several eyes (n = 5) cyanoacrylate glue was applied around the needle to prevent possible leakage of aqueous fluid. A Seidel test was performed on 10 eyes and no sign of leakage was evident. Connected to the needle via polyethylene tubing and a three-way stopcock were a reservoir of physiological saline (Sigma Diagnostics, St. Louis, MO) and a mercury manometer. During IOP measurement the stopcock was left open to maintain constant perfusion pressure and the height of the saline reservoir was varied so as to raise or lower the mercury level in steps of 10 mmHg over the range of 10 to 90 mmHg. For each of the steps, which we sampled in random order, 10 valid readings of mean IOP were made with a Tono-Pen XL (Medtronic Solan, Jacksonville, FL) tonometer. A reading was considered valid only if the coefficient of variation provided by the tonometer was less than 5%. Between pressure steps, or as needed, the eye was bathed in saline to keep the cornea moist. For some eyes (n = 4) we also attempted to take IOP measurements with the stopcock closed but found that the readings were unstable using this approach, declining in time with a pressure-dependent rate. As a result we did not pursue the closed stopcock arrangement further.
Figure 1.
Schematic diagram of the experimental setup. A 25-gauge needle was inserted into the peripheral cornea of one eye. Connected to the needle via tubing were a mercury manometer and a saline reservoir. By varying the height of the reservoir IOP could be lowered or raised. Care was taken to remove air bubbles from the tubing and to position zero pressure on the manometer level with the center of the eye (dotted line).
IOP measurements were made on 12 eyes from 9 cats (8–15 months of age), 13 eyes from 7 cows (20–22 weeks of age), and 10 eyes from 5 sheep (6–8 months of age). All of the pressure readings in cat were taken at the end of experiments investigating the physiological properties of retinal ganglion cells. In none of the experiments was the eyeball penetrated by the recording electrode, ganglion cell responses were accessed from the optic tract. The experiments lasted up to 3 days during which the animal (3–5 kg) was continually maintained under anesthesia with ethyl carbamate (200 mg/kg loading dose, 15–50 mg/kg/hr infusion rate, IV) and paralysis with pancuronium bromide (0.2 mg/kg/hr infusion rate, IV).11 Because IOP was set manometrically, the anesthetic and paralytic agents should not have affected the results. For most of the cat eyes (n = 9) IOP was measured while the animal was alive. For the others it was measured in situ immediately after sacrifice (n = 2) or ex vivo 24 hrs later (n = 1). All cow and sheep pressure readings were taken from excised eyes within 4–24 hrs of enucleation. The significance of results from different animal species and tonometers was tested by performing a Student’s t-test. For 3 cat eyes, 4 cow eyes, and 3 sheep eyes IOP measurements were also made with a second Tono-Pen XL to assess the generality of calibration curves.
RESULTS
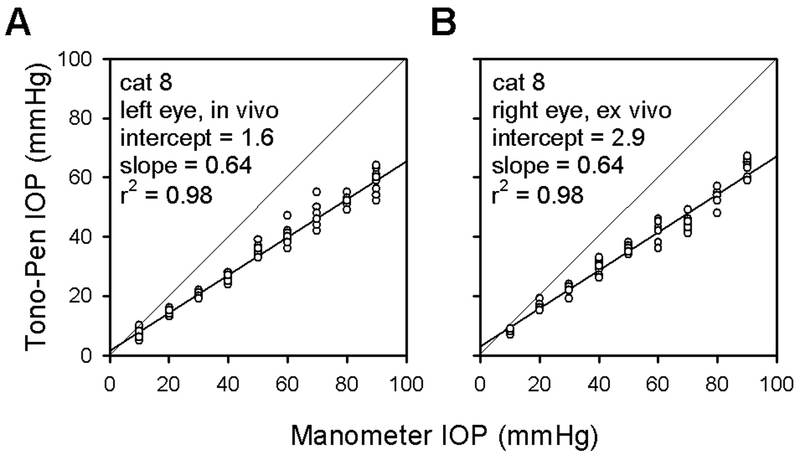
Fig. 2A displays Tono-Pen XL readings taken from one eye of a living cat subjected to varying levels of IOP. The tonometer systematically underestimated IOP for this and all other cat eyes. Linear regression analysis (thick lines) gave intercepts ranging from –3 to 2 mmHg and slopes ranging from 0.58 to 0.66 across the ensemble of cat eyes. The average intercept was 0.3 ± 1.8 (standard deviation, SD) mmHg, which is statistically indistinguishable from zero, and the average slope was 0.62 ± 0.03 (SD), which is significantly less than one (thin lines, p≪0.001). This means a tonometer reading of, for example, 20 mmHg actually corresponded to an IOP of ~32 mmHg in cat. The underestimation of IOP was not caused by leakage around the needle as no loss of fluid was evident even for the highest pressure setting.
Figure 2.
Tono-Pen XL readings of IOP as a function of manometric pressure setting for an in vivo (A) and ex vivo (B) cat eye. Measurements on the excised eye were taken at 24 hrs post mortem. Thick lines are linear regression fits of the data. The intercept and slope of the regression line are provided for each eye. Thin lines with a slope of one indicate what an appropriately calibrated tonometer would read. r2 = correlation coefficient.
It is apparent in Fig. 2A that the Tono-Pen XL readings exhibit a moderate degree of variability. At best the standard deviation of IOP measurements from a given cat was ~1 mmHg and at worst ~4 mmHg. In an attempt to reduce variability the stopcock was closed, eliminating the possibility of fluid backflow through the needle during applanation. This generally reliable technique3,4 did not work for us, however, because the eye failed to hold constant pressure (data not shown). Since no leakage was observed around the needle, we presume fluid left the eye via its normal outflow pathway. Some measurement variability may therefore have been related to small changes in intraocular volume associated with the open stopcock arrangement. It was not, however, associated with natural processes of a living animal. Fig. 2B displays Tono-Pen XL readings taken from the opposite eye of the cat one day after enucleation. For this and two additional eyes the standard deviation of IOP measurements (~2 mmHg) fell within the range obtained when the animals were alive. The data regression lines for ex vivo and in vivo cat eyes were essentially identical as well.
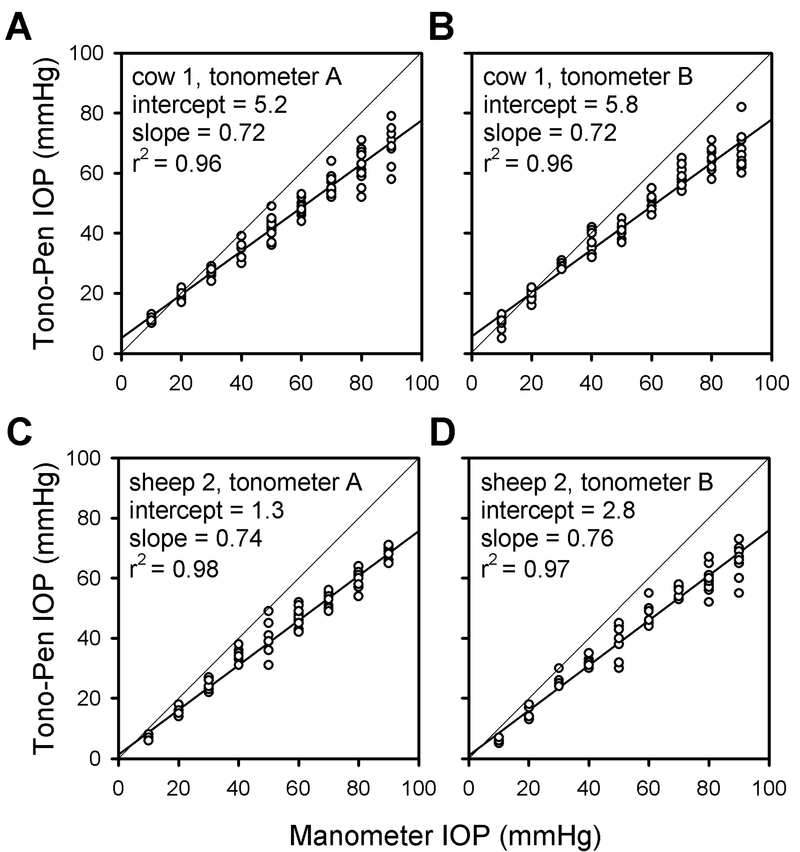
To further evaluate the performance of the device, Fig. 3 displays pressure readings taken from an enucleated cow eye and sheep eye with different Tono-Pen XLs. Both of the tonometers underestimated IOP by the same amount for these and all other eyes that were tested with the two tonometers (n = 10). Across the ensemble of cow and sheep eyes the average intercept was 4.6 ± 2.0 and 4.2 ± 1.7 mmHg, respectively, and the average slope was 0.72 ± 0.05 and 0.69 ± 0.05. For both animals the intercept is statistically different from zero and the slope is significantly less than one and greater than that for cat eyes (p<0.001). It may be seen from Fig. 3 that the intercept was non-zero because the tonometers gave more accurate readings over the range of 10 to 30 mmHg than at higher pressure settings, especially for cow eyes.
Figure 3.
Tono-Pen XL readings of IOP from excised cow and sheep eyes. The pressure readings were taken using our tonometer (tonometerA) and a loaner tonometer (tonometerB). Thick lines are linear regression fits of the data. All measurements were taken within one day of enucleation. r2 = correlation coefficient.
DISCUSSION
The Tono-Pen tonometer has been shown by direct manometry to accurately measure IOP in human cadaver eyes,12–14 though with a slight tendency to overestimate pressures below 20 mmHg and underestimate pressures above 25 mmHg. Such a tendency was also noted with rat eyes.1,9 We find that the Tono-Pen XL underestimates IOP at every pressure setting in cat and, like dogs7,8 and horses8, at mainly high settings in cow and sheep. The underestimation may be conveniently described by the slope of the tonometer-manometer regression line, which differed significantly between cat and the other two species. Why the calibration curve for these and other nonhuman animals should have a non-unity slope is unclear. Whatever the reason it does not appear related to physiological processes, such as blood pressure or aqueous outflow regulation, because the mean and variance of IOP measurements were the same for intact and excised eyes.
What are the implications of using the Tono-Pen XL to noninvasively measure IOP? Table 1 provides the intercepts and slopes of the calibration curves reported for different models of the Tono-Pen for various animal species that have been examined. Measurements made with the Tono-Pen 1 give slopes for non-human animals that are similar (~0.72), as do measurements made with the Tono-Pen 2 although the slope for this model appears greater (~0.81). The slopes that we obtained with the Tono-Pen XL for cow and sheep are comparable to those reported for the Tono-Pen 1 in other animal species. Our results in cat, however, do not fit well with previous findings. Firstly, the previously reported slope for cat (0.73, Tono-Pen 1) is well outside the range of variability in our measurements (>3 SDs or p=0.00013), implying that modifications in tonometer design over the past two decades have had a measurable effect on the output of the device. And secondly, the slope we obtained for cat is significantly different from that for cow and sheep (p<0.001), implying that differences in the calibration curve of these animal species are real. This means that, if a generic curve having a slope of 0.72 were used to correct Tono-Pen XL output in cat, an IOP of 40 mmHg would be underestimated by ~4 mmHg. Hence, to attain the most accurate estimate of cat IOP, which was an aim of this paper, one should divide the tonometer output by 0.62 (or multiply it by 1.6). Because of measurement variability some uncertainty will inevitably remain about the IOP of a given animal in question. This uncertainty can be quantified from the standard deviation of the tonometer output, which for sedated cats was ~5 mmHg after rescaling. Such variability implies that, to estimate the IOP of a sedated cat to a precision of ±3 mmHg, at least 10 pressure readings would need to be averaged.15 What a suitable number would be for an awake cat cannot be determined from our results because variability caused by movements of the eye and animal might overwhelm the noise observed here under controlled conditions and could also bias tonometer output towards higher readings. It is presumably for these reasons that the manufacturer recommends the lowest reproducible reading from the instrument be considered the most accurate one.
Table 1.
Tono-Pen calibration curves reported for various animal species and measured here for cat, cow, and sheep (last three entries).
ACKNOWLEDGEMENTS
The authors thank Dr. Angelo Tanna for use of his Tono-Pen XL tonometer and Dr. Christina Enroth-Cugell and the anonymous reviewers for comments on the manuscript. The research was supported by National Eye Institute grant R01-EY06669.
REFERENCES
- 1.Moore CG, Milne ST, Morrison JC. Noninvasive measurement of rat intraocular pressure with the Tono-Pen. Investigative Ophthalmology and Visual Science 1993; 34: 363–369. [PubMed] [Google Scholar]
- 2.Mermoud A, Baerveldt G, Minckler DS, Lee MB, Rao NA. Measurement of rabbit intraocular pressure with the Tono-Pen. Ophthalmologica 1995; 209: 275–277. [DOI] [PubMed] [Google Scholar]
- 3.Abrams LS, Vitale S, Jampel HD. Comparison of three tonometers for measuring intraocular pressure in rabbits. Investigative Ophthalmology and Visual Science 1996; 37: 940–944. [PubMed] [Google Scholar]
- 4.Peterson JA, Kiland JA, Croft MA, Kaufman PL. Intraocular pressure measurement in cynomolgus monkeys. Tono-Pen versus manometry. Investigative Ophthalmology and Visual Science 1996; 37: 1197–1199. [PubMed] [Google Scholar]
- 5.Miller PE, Pickett JP, Majors LJ, Kurzman ID. Evaluation of two applanation tonometers in cats. American Journal of Veterinary Research 1991; 52: 1917–1921. [PubMed] [Google Scholar]
- 6.Miller PE, Pickett JP, Majors LJ. Evaluation of two applanation tonometers in horses. American Journal of Veterinary Research 1990; 51: 935–937. [PubMed] [Google Scholar]
- 7.Priehs DR, Gum GG, Whitley RD, Moore LE. Evaluation of three applanation tonometers in dogs. American Journal of Veterinary Research 1990; 51: 1547–1550. [PubMed] [Google Scholar]
- 8.Dziezyc J, Millichamp NJ, Smith WB. Comparison of applanation tonometers in dogs and horses. Journal of the American Veterinary Medicine Association 1992; 201: 430–433. [PubMed] [Google Scholar]
- 9.Morrison JC, Moore CG, Deppmeier LMH, Gold BG, Meshul CK, Johnson EC. A rat model of chronic pressure-induced optic nerve damage. Experimental Eye Research 1997; 64: 85–96. [DOI] [PubMed] [Google Scholar]
- 10.Miller PE, Pickett JP, Majors LJ. In vivo and in vitro comparison of the Mackay-Marg and Tono-Pen applanation tonometers in the dog and cat. Transactions of the Nineteenth Annual Science Program of the American College of Veterinary Ophthalmologists 1988; 19: 53–58. [Google Scholar]
- 11.Troy JB, Robson JG. Steady discharges of X and Y retinal ganglion cells of cat under photopic illuminance. Visual Neuroscience 1992; 9: 535–553. [DOI] [PubMed] [Google Scholar]
- 12.Boothe WA, Lee DA, Panek WC, Pettit TH. The Tono-Pen: a manometric and clinical study. Archives of Ophthalmology 1988; 106: 1214–1217. [DOI] [PubMed] [Google Scholar]
- 13.Hessemer V, Rossler R, Jacobi KW. Comparison of intraocular pressure measurements with the Oculab Tono-Pen versus manometry in humans shortly after death. American Journal of Ophthalmology 1988; 105: 678–682. [DOI] [PubMed] [Google Scholar]
- 14.Menage MJ, Kaufman PL, Croft MA, Landay SP. Intraocular pressure measurement after penetrating keratoplasty: minified Goldmann applanation tonometer, pneumatonometer, and Tono-Pen versus manometry. British Journal of Ophthalmology 1994; 78: 671–676. [DOI] [PMC free article] [PubMed] [Google Scholar]
- 15.Hogg RV, Ledolter J. Engineering statistics. Macmillan Publishing, New York, 1987. [Google Scholar]


