

Abstract
Decreased adipose tissue oxygen tension and increased HIF-1α expression can trigger adipose tissue inflammation and dysfunction in obesity. Our current understanding of obesity-associated decreased adipose tissue oxygen tension is mainly focused on changes in oxygen supply and angiogenesis. Here, we demonstrate that increased adipocyte O2 demand, mediated by ANT2 activity, is the dominant cause of adipocyte hypoxia. Deletion of adipocyte Ant2 improves obesity-induced intracellular adipocyte hypoxia by decreasing obesity-induced adipocyte oxygen demand, without effects on mitochondrial number or mass, or oligomycin-sensitive respiration. This led to decreased adipose tissue HIF-1α expression and inflammation with improved glucose tolerance and insulin resistance in both a preventative or therapeutic setting. Our results suggest that ANT2 may be a target for the development of insulin sensitizing drugs and that ANT2 inhibition might have clinical utility.
Keywords: Obesity, Type 2 diabetes, Insulin Resistance, Adipose Tissue Hypoxia, HIF-1α, Inflammation, ANT2, Mitochondria, Uncoupled Respiration, Oxygen Consumption
Introduction
Obesity is the most common cause of insulin resistance in man and the obesity epidemic is driving a parallel rise in the incidence of Type 2 diabetes mellitus (T2DM) 1. In obesity, the expanded adipose tissue depots exhibit altered glucose and lipid metabolic profiles, which contribute to systemic metabolic abnormalities 2. In addition to storing excess energy as triglycerides, adipose tissue plays an active role in maintaining systemic metabolic homeostasis through a multi-modular communication system with other tissues, including liver, skeletal muscle, pancreatic endocrine cells and brain 2,3. For example, adipocytes release multiple hormones and cytokines, including leptin, adiponectin and TNFα 4–6, as well as different lipid metabolite species including palmitoleate and conjugated fatty acids 5,7. These molecules can act in a paracrine and/or endocrine manner to regulate adipose tissue inflammatory tone and systemic energy balance and metabolism.
In obesity, macrophages and other immune cell types accumulate in adipose tissue 3,8. These immune cells release cytokines, chemokines and microRNA-containing exosomes which can gain access to the circulation and modulate systemic lipid and glucose homeostasis 9–11. Numerous in vitro and in vivo studies have demonstrated that genetic or pharmacologic inhibition of pro-inflammatory pathways in mice can block migration/accumulation of macrophages into adipose tissue with beneficial effects on glucose tolerance and systemic insulin sensitivity 3,12–16.
Recently, we 17 and others 18,19 have proposed that decreased adipose tissue oxygen (O2) tension and increased adipocyte hypoxia-inducible factor (HIF) −1α expression can be an initiating trigger for adipose tissue inflammation and dysfunction. During the course of high fat diet (HFD)/obesity, a decrease in intracellular adipocyte O2 tension with increased HIF-1α protein expression precedes macrophage accumulation and pro-inflammatory gene expression 17. HIF-1α is a ubiquitous transcription factor abundantly expressed in most cell types 20. In normoxic conditions, prolyl hydroxylase domain proteins (PHDs) bind to HIF-1α. PHD-dependent HIF-1α hydroxylation targets HIF-1α for ubiquitin-dependent proteasomal degradation. In hypoxic conditions, PHDs become inactive, leading to HIF-1α stabilization and increased expression of HIF-1α and its target genes involved in hypoxia responses, angiogenesis, macrophage chemotaxis and oxidative stress 20. Moreover, adipocyte-specific HIF-1α KO mice are protected from obesity-induced adipose tissue inflammation and systemic insulin resistance 17,21,22.
Tissue O2 tension is maintained by the balance between O2 demand and supply. Previous reports showed that O2 supply is compromised in obese adipose tissue (particularly in subcutaneous adipose tissue) and that diffusion of O2 to the cytosol might be limited by enlarging adipocyte size 23. While the effects of obesity on adipose tissue vascular function and O2 supply have been well studied 24, the impact of obesity on adipose tissue O2 demand is not clearly understood.
Recently, we proposed that increased intracellular saturated free fatty acid (FFA) levels stimulate an adenine nucleotide translocase (ANT)-2-dependent increase in uncoupled mitochondrial respiration 17. This leads to increased O2 consumption and a state of relative adipocyte hypoxia with increased HIF-1α expression. In the current studies, we have generated adipocyte-specific ANT2 KO (ANT2 AKO) mice and assessed changes in O2 balance, HIF-1α expression and inflammation within adipose tissue and adipocytes. We found that both decreased O2 supply and ANT2-mediated increased consumption contribute to decreased interstitial O2 tension in obese adipose tissue, but that increased O2 demand is the major determinant of intracellular hypoxia and increased HIF-1α expression.
Results
Generation of adipocyte-specific ANT2 KO mice
Previously we proposed that ANT2 mediates saturated fatty acid-induced increased uncoupled respiration, leading to relative hypoxia and increased HIF-1α expression in white adipocytes 17. To investigate the role of adipocyte ANT2 in obesity-induced adipose tissue hypoxia, inflammation and insulin resistance, we generated adipocyte-specific ANT2 knockout (ANT2 AKO) mice using the Cre-loxP system (ANT2fl/fl:Adiponectin-Cre+/−). Cre− Ant2 floxed mice (ANT2fl/fl;Adiponectin-Cre−/−) were used as WT controls, referred to, hereafter, as WT. As expected, ANT2 mRNA expression was significantly diminished in epididymal (eWAT), inguinal (iWAT) and interscapular brown (BAT) adipose tissues of ANT2 AKO mice, compared with WT mice (Fig. 1a). Decreased Ant2 expression was restricted to adipocytes and Ant2 expression was not altered in stromal vascular cells (SVCs) of eWAT or in other tissues such as liver and muscle of ANT2 AKO mice, compared with WT mice (Fig. 1a,b). Ant1 mRNA expression was not changed in any of the tissues (including eWAT) and cell types examined in the ANT2 AKO mice.
Figure 1.
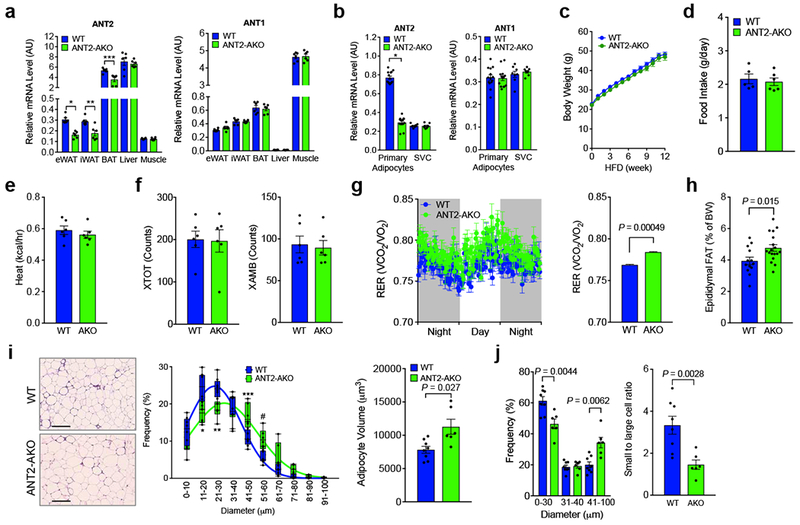
Adipocyte-specific ANT2 knockout mice exhibit normal body weight with increased adipose tissue mass. (a) mRNA expression of ANT1 and ANT2 in different tissues of WT and ANT2 AKO mice fed HFD for 12 weeks (n=6 mice per group). *P=0.00038, **P=0.0062, and ***P=0.0056 vs. WT controls. (b) mRNA expression of ANT1 and ANT2 in primary adipocytes (n=14 mice per group) and SVCs (n=8 mice per group) isolated from eWAT of WT and ANT2 AKO mice. *P=8.25×10⁻¹⁷, vs. WT controls. (c) Body weight gain on HFD (n=17 and 22 for WT and AKO mice, respectively). (d) Average daily food intake in HFD WT (n=5 mice) and ANT2 AKO mice (n=6 mice). (e-g) Metabolic rates (heat generation, e; locomotor activity, f; respiratory exchange rate, g) of HFD WT and ANT2 AKO mice (n=6 mice per group). Each of data points from individual mice was omitted in the bar graph to more clearly show the mean values and error bar sizes. Statistical analyses were performed by the two-way ANOVA. (h) Tissue weights of eWAT of HFD WT (n=13) and ANT2 AKO (n=18) mice. (i) H&E staining (left) of eWAT and the frequency distribution of adipocyte sizes (middle) and average adipocyte volume (right). n=8 (7944 cells) and 6 (4334 cells) mice for WT and AKO, respectively. Scale bar, 200 μm. *P=0.0064, ** P=0.0022, *** P=0.018, and #P=0.010 vs WT controls. Box plot element and lines indicate the range of minimum to maximum and curve fits, respectively. (j) The frequency distribution in panel i was divided into tertiles and the right hand bars show he ratio of lowest and highest adipocyte size tertiles. Statistical analyses in panels a,b,h-j were performed by the two-tailed Student’s t test. All data are presented as mean +/− SEM.
Body weight and food intake were comparable in WT and ANT2 AKO mice on both normal chow diet (NCD) and high fat diet (HFD) (Fig. 1c,d and Supplementary Fig. 1). Physical activity and heat generation were also unaltered (Fig. 1e,f). The respiratory exchange ratio (RER) was slightly, but significantly elevated in ANT2 AKO mice, compared with WT controls (Fig. 1g), suggesting that the KO mice exhibit an increased preference for glucose over lipid as an energy source. Histologic analysis of epididymal adipose tissue revealed that deletion of Ant2 conferred increased adipocyte size by ~23% and a proportional increase in adipose tissue mass (Fig. 1h,i). Since the increases in adipocyte volume and adipose tissue mass were comparable, it is likely that ANT2 AKO does not change overall adipocyte number. This is shown by the corresponding decrease in small adipocytes and increase in larger ones (Fig. 1j).
Deletion of adipocyte Ant2 improves relative hypoxia and decreases HIF-1α expression
To assess the effect of adipocyte Ant2 deletion on adipose tissue O2 balance, we measured interstitial O2 tension and O2 supply in adipose tissue, along with O2 consumption in primary adipocytes. Consistent with previous reports 18,19, HFD/obesity decreased interstitial O2 tension in visceral adipose tissue in WT mice and Ant2 was abundantly expression in eWAT (Supplementary Fig. 2a,b). Interstitial O2 tension in eWAT, mesenteric WAT (mWAT) and iWAT was measured in individual mice on NCD and HFD, with consistent decreases noted in HFD vs NCD (Fig. 2a). eWAT Ant2 expression was unchanged in HFD WT compared with NCD WT mice (Supplementary Fig. 2b), consistent with the view that increased ANT2 activity, but not expression, contributes to obesity-induced adipocyte oxygen consumption in obesity 17. The effect of obesity to decrease adipose O2 tension was mitigated in AKO mice (Fig. 2a). This decrease in interstitial O2 tension in WT mice was not accompanied by decreased arterial O2 supply (Fig. 2b), but was associated with decreased functional capillary density (Fig. 2c) and increased adipocyte O2 consumption (Fig. 2d). The relative intracellular hypoxic state was exemplified by increased pimonidazole adduct staining in HFD WT adipocytes compared with ANT2 KOs (Fig. 2e). Since pimonidazole forms protein adducts at O2 tensions below ~1.3%, these results suggest that the intracellular O2 concentration of adipocytes drops from the interstitial levels down to ~1.3% or below.
Figure 2.
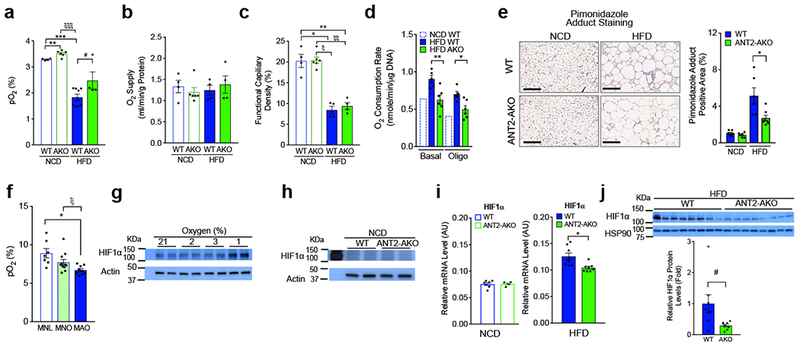
Intracellular O2 tension and HIF-1α expression are decreased in the eWAT of ANT2 AKO mice. (a,b) Interstitial O2 tension (a) and arterial O2 supply (b) in the eWAT of NCD or HFD WT or ANT2 AKO mice (n=4, 6, 8 (or 4) and 4 mice, respectively). **P=0.0041, ξξξP=5.1×10⁻⁶, ***P=4.3×10⁻⁷ according to the two-way ANOVA with post-hoc two-tailed t-tests between the individual groups. #P=0.073 (one-tailed t-test). (c) Functional capillary density in eWAT of mice fed NCD or HFD (n=4 mice per group). *P=0.0015, **P=0.0024, ξP=3.0×10⁻⁵, and ξξP=2.1×10⁻⁵. (d) O2 consumption in primary adipocyte isolated from eWAT of mice fed HFD WT or AKO mice (n=5 and 6 mice for HFD WT and HFD AKO, respectively). NCD WT mouse data was modified from a previous report 17. *P=0.0074, **P=0.011. (e) Pimonidazole (brown) and H&E stainings of eWAT from WT (n=6 mice) and ANT2 AKO (n=7 mice) mice fed NCD or HFD. Scale bar, 200 μm. P=0.037. (f) Human subcutaneous abdominal adipose tissue O2 tension. Subcutaneous abdominal adipose tissue O2 tension in metabolically-normal lean (MNL) (n=7 individual participants), metabolically-normal obese (MNO) (n=11 individual participants) and metabolically-abnormal obese (MAO) (n=9 individual participants) participants. *P=0.01, ξP=0.028. (g) Western blot analysis of HIF-1α protein expression at different O2 conditions. (h-j) Protein (h, j) and mRNA (i) levels of HIF-1α in eWAT of NCD (h, i) or HFD (i, j) WT or ANT2 AKO mice. Individual data points in panels h,i,j were collected from 2 WT and 2 KO mice (h), 7 NCD WT, 5NCD KO, 8 HFD WT and HFD KO mice (i), and 8 WT and 8 KO mice (j), respectively. *P=0.012, #P=0.045 according to the two-tailed t-test. Similar results to those in panels g,h data were obtained from at least two independent experiments. All data are presented as mean +/− SEM. Statistical analyses in panels c-f were performed by the ANOVA with post-hoc two-tailed t-tests between the individual groups.
In a general sense, HFD WT and AKO mice showed metabolic phenotypes similar to humans with metabolically-abnormal obesity (MAO) and metabolically-normal obesity (MNO), respectively. This prompted us to evaluate adipose tissue O2 tension in MNO and MAO in people. MNO and MAO were defined by the results of an oral glucose tolerance test and HbA1c values (Supplementary Table 1). Comparable to previous reports 25,26, adipose tissue interstitial O2 tension was generally 2-3 fold higher in humans than in mice (Fig. 2a,f). Interstitial adipose tissue O2 tension was lower in people with obesity than metabolically-normal lean participants (MNL) (Fig. 2f). Moreover, interstitial adipose tissue O2 tension was lower in MAO than MNO participants, and this is similar to the directional changes in comparative interstitial adipose tissue O2 tension values observed in WT and AKO HFD-fed mice (Fig. 2a,f).
To provide insight into the effects of O2 tension on HIF-1α expression, we incubated 3T3-L1 adipocytes in O2 conditions ranging from 21% to 1%. Since eWAT interstitial oxygen levels were ~3.4% and 1.8% in lean and HFD/obese mice, respectively, we compared adipocyte HIF-1α expression at 2% and 3% O2. As seen in Fig. 2g and Supplementary Fig. 2c, adipocyte HIF-1α expression was not increased at 2% O2 compared with 3% O2 , but was significantly increased at 1% O2.
In HFD WT mice, adipocyte O2 consumption is significantly increased compared with NCD mice 17 and deletion of ANT2 blocked this obesity-induced increase. This effect was preserved in the presence of the ATP synthase inhibitor (oligomycin), indicating that the decreased O2 consumption in HFD ANT2 KO adipocytes, compared with WT was largely due to decreased uncoupled respiration (Fig. 2d). Mitochondrial DNA content, citrate synthase activity and the levels of mitochondrial complex components were comparable in eWATs of HFD WT and ANT2 AKO mice (Supplementary Fig. 2d-f). Consistent with this, knockdown of ANT2 in 3T3-L1 adipocytes did not change citrate synthase activity or mitochondrial complex component expression (Supplementary Fig. 2g,h). Interestingly, the number of pimonidazole adduct-positive adipocytes was substantially decreased in eWAT of HFD ANT2 AKO mice compared with HFD WT controls without changes in O2 supply (Fig. 2b,e). Together, these results strongly suggest that relative intracellular hypoxia in obese adipocytes is due to ANT2-mediated increased uncoupled respiration and O2 consumption and that interstitial O2 concentration can be dissociated from intracellular O2 pressure in ANT2 AKO mice.
We assessed whether the increased O2 tension in ANT2 KO adipocytes led to decreased HIF-1α expression, using Western blot analyses. On NCD, Hif1a mRNA and protein expression was comparable in WT and KO mice (Fig. 2h,i). However, on HFD, the expression of Hif1a protein and mRNA was significantly reduced in ANT2 AKO mice compared with WT mice (Fig. 2i,j). Clearly, the effects of the KO were greater on HIF-1α protein compared with mRNA expression, consistent with the well-known view that O2 regulates HIF-1α mainly by affecting protein stability 27. Moreover, mRNA expression of HIF-1α target genes including Nos2, Cyr61 and Pdk1, which are increased in WT obese adipose tissue 17, were also decreased in the eWAT of HFD ANT2 AKO mice (Supplementary Fig. 2i).
ANT2 AKO mice display improved glucose tolerance and insulin sensitivity on HFD
To assess the metabolic consequence of adipocyte ANT2 KO, we measured glucose and insulin tolerance in WT and ANT2 AKO mice. On NCD, glucose tolerance and fasting plasma insulin levels were comparable in WT and ANT2 AKO mice (Fig. 3a,b). However, on HFD, ANT2 AKO mice exhibited significantly improved glucose tolerance with decreased fasting plasma insulin levels (Fig. 3c,d). Insulin tolerance was also substantially improved in HFD ANT2 AKO mice compared with WT controls (Fig. 3e). To quantitatively measure changes in insulin sensitivity in each of the classical insulin target tissues, liver, skeletal muscle and adipose tissue, we performed hyperinsulinemic euglycemic clamp studies. As seen in Fig. 3f, HFD ANT2 AKO mice displayed an ~39 % increase in systemic insulin sensitivity as assessed by the increased glucose infusion rate (GIR). This increase was mostly due to increased hepatic insulin sensitivity. Thus, insulin-dependent suppression of hepatic glucose production (HGP) was substantially increased in ANT2 AKO mice compared with WT controls (Fig. 3g,h). The ability of insulin to suppress plasma FFA levels provides an indication of adipose tissue insulin sensitivity, and the insulin-effect on plasma FFA suppression was also increased in ANT2 AKO mice compared with WT controls (Fig. 3i and Supplementary Fig. 3a). On the other hand, insulin-stimulated glucose disposal rate (IS-GDR), which primarily reflects skeletal muscle insulin sensitivity, was not changed by adipocyte ANT2 KO (Fig. 3j). Consistent with this, insulin-stimulated Akt phosphorylation was markedly increased in eWAT and liver, but not muscle in HFD ANT2 AKO mice (Fig. 3k). Together these results suggest that ANT2 AKO mice are protected from HFD-induced glucose intolerance and insulin resistance mainly through increased adipose tissue and liver insulin sensitivity.
Figure 3.
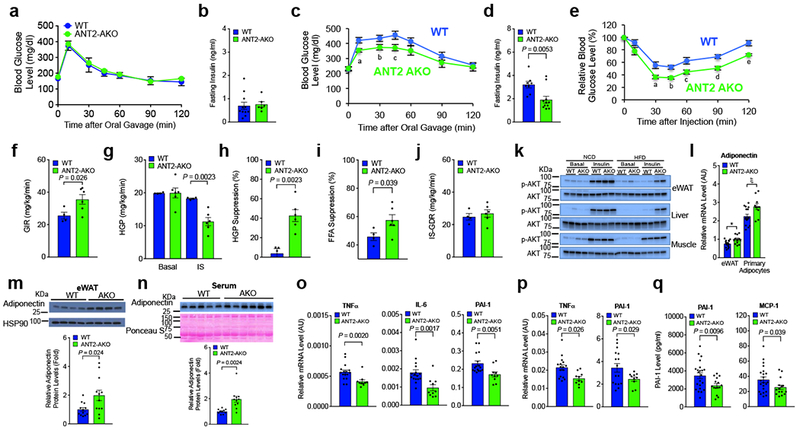
ANT2 AKO mice are protected from HFD-induced adipose tissue inflammation, glucose intolerance and insulin resistance. (a) GTTs in NCD mice (WT, n=10; ANT2 AKO, n=5). (b) Fasting plasma insulin levels in NCD mice (n=11 and 6 mice for WT and ANT2 AKO, respectively). (c) GTTs in 12 week HFD mice (n=11 and 8 mice for WT and ANT2 AKO, respectively). aP=0.008, bP=0.043, cP=0.028, according to the two-way ANOVA with post-hoc two-tailed t-tests between the individual groups. (d) Fasting plasma insulin levels in HFD mice (n=8 and 11 mice for WT and ANT2 AKO, respectively). (e) ITTs in HFD mice for 12 weeks (n=8 and 11 mice for WT and ANT2 AKO, respectively). aP=0.020, bP=0.002, cP=0.030, dP=0.005, eP=0.005 according to the two-way ANOVA with post-hoc two-tailed t-tests between the individual groups. (f-j) Systemic and tissue-specific effects of ANT2 AKO was determined by hyperinsulinemic euglycemic clamp studies in 12 week HFD mice (n=4 and 6 mice for WT and ANT2 AKO, respectively). (f) GIR. (g) HGP. (h) HGP suppression. (i) Suppression of plasma FFA levels. (j) IS-GDR. (k) Akt phosphorylation in eWAT, liver, and muscle of WT and ANT2 AKO mice. Representative data from two independent experiments are shown. (l) mRNA levels of adiponectin in eWAT and primary adipocytes of HFD WT and ANT2 AKO mice (n=8 mice per group). *P=0.027, ξP=0.018. (m,n) Western blot analysis of adiponectin protein levels in eWAT (m; n=12 mice per group) and serum (n; n=10 and 11 for WT and AKO, respectively) of HFD WT and ANT2 AKO. Representative images were shown on the top of each bar graph. (o,p) mRNA levels of inflammatory cytokines in primary adipocytes (o) or eWAT (p) of HFD WT (n=16 mice) and ANT2 AKO (n=10 mice per group) mice. (q) Serum levels of PAI-1 and MCP-1 in HFD WT (n=11 mice) and ANT2 AKO mice (n=15 mice). Statistical analyses in panels d,f-i,l-q were performed by the two-tailed Student’s t test. All data are presented as mean +/− SEM.
Adiponectin is secreted specifically from adipocytes and enhances insulin sensitivity in liver and skeletal muscle, whereas pro-inflammatory cytokines induce insulin resistance 2. As seen in Fig. 3l, Adipoq mRNA levels were significantly increased in eWAT and primary adipocytes in ANT2 AKO mice. Moreover, serum and eWAT adiponectin protein levels was also increased in ANT2 AKO mice (Fig. 3m,n). Consistent with this, adiponectin expression was increased in ANT2 knockdown (KD) adipocytes (Supplementary Fig. 3b). In contrast, mRNA expression of pro-inflammatory cytokines such as Tnfa, Il6 and Pai1 was reduced in primary adipocytes or eWATs of ANT2 AKO mice with decreased plasma PAI-1 and MCP-1 levels (Fig. 3o-q).
ANT2 AKO mice are protected from HFD-induced adipose tissue inflammation and fibrosis
To investigate how deletion of adipocyte Ant2 led to decreased expression of pro-inflammatory cytokines, we measured adipose tissue macrophage (ATM) accumulation. As seen in Fig. 4a, immuno-staining of adipose tissue sections with anti-F4/80 antibodies demonstrated decreased ATM content in eWAT from HFD ANT2 KO mice. Flow cytometry analysis of eWAT stromal vascular cells (SVCs) showed that the ratio of CD11b+ / F4/80+ double-positive ATMs was significantly decreased in HFD ANT2 AKO mice compared with HFD WT controls (Fig. 4b and Supplementary Fig. 4a), whereas, on NCD, ATM content was comparable in WT and ANT2 AKO mice (Supplementary Fig. 4b). Most of this change in ATM content was due to decreased CD11b+, F4/80+ and CD11c+ triple-positive M1-like polarized ATMs (Fig. 4c), with a smaller change in CD206+ M2-like polarized anti-inflammatory ATMs (Supplementary Fig. 4c). This was accompanied by increased regulatory T cell (Treg) numbers in ANT2 AKO mouse adipose tissue (Fig. 4d and Supplementary Fig. 4d). Consistent with these results, we found decreased expression of macrophage genes such as Emr1 (coding F4/80), Cd11b and Cd11c in ANT2 AKO mouse adipose tissue, as well as decreased chemokine gene expression (Ccl2, Mip1a and Rantes) (Fig. 4e and Supplementary Fig. 4e).
Figure 4.
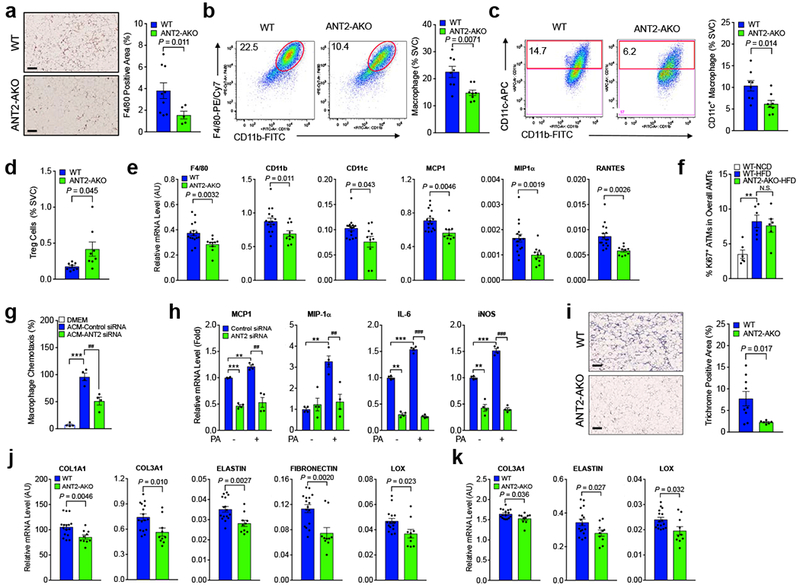
HFD-induced ATM accumulation and M1-like polarization is reduced in ANT2 AKO mice with improved adipose tissue fibrosis. (a) F4/80 staining (brown) of eWAT sections of 12 week HFD mice (n=9 and 5 mice for WT and AKO, respectively). Scale bar, 200 μm. (b-d) Flow cytometry analysis of eWAT SVCs of 12 week HFD mice (n=8). Total macrophage (CD45+ / CD11b+ / F4/80+ triple positive cells) (b), CD11c+ M1-like polarized macrophage (c), and Treg (CD3+ / CD4+ / Foxp3+ triple positive cells) (d) ratio among total SVC population was calculated and presented in bar graphs. Representative scatter plot images were shown on the left side of each bar graph or in Supplementary Fig. 4d. (e) mRNA levels of macrophage marker and chemokine genes in eWAT of HFD WT and ANT2 AKO mice were measured by qRT-PCR (n=16 and 10 for WT and ANT2 AKO mice, respectively). (f) The ratio of Ki67+ ATM population in ATMs of NCD WT, HFD WT, or HFD ANT2 AKO mice (n=6 mice per group). **P=0.0020. N.S., not significant. (g) Migration of Raw264.7 macrophage cells to ACM harvested from 3T3-L1 cells transfected with control or anti-ANT2 siRNA (n=4 wells per group). ***P=0.0007, ##P=0.0043. (h) mRNA levels of inflammatory gene expression. 3T3-L1 adipocytes were transfected with control or ANT2 siRNAs and then incubated in no or high palmitic acid (400 μM) medium for 24 h (n=4 wells per group). For MCP1, ***P=9.8×10⁻⁵, ** P=0.0050, ##P=0.0034. For MIP1α, ** P=0.0023, ##P=0.0060. For IL-6, **P=1.5×10⁻⁵, *** P=1.3×10⁻⁵, ###P=4.4×10⁻⁷. For iNOS, ** P=0.0022, *** P=0.00029, ##P=1.6×10⁻⁶. (i) Trichrome (blue) staining of eWAT sections of 12 week HFD mice (n=9 and 6 mice for WT and AKO, respectively). Scale bar, 200 μm. (j,k) mRNA levels of fibrogenic genes in primary adipocytes (j) and eWAT (k) of HFD mice (n=16 and 10 mice for WT and AKO, respectively). Statistical analyses in panels a-e,i-k were performed by the two-tailed Student’s t test. Statistical analyses in panels f-h were performed by the ANOVA with post-hoc two-tailed t-tests between the individual groups. All data are presented as mean +/− SEM.
Obesity can promote ATM accumulation by increasing blood monocyte recruitment into adipose tissue and by enhancing ATM proliferation 28,29. To test whether the decreased ATM accumulation and M1-like polarization in HFD ANT2 AKO mice involved decreased ATM proliferation, we analyzed the changes in Ki67+ proliferating ATMs in NCD and HFD WT and ANT2 AKO mice. Consistent with previous reports 29,30, a relatively modest (4-8%) proportion of ATMs were Ki67-positive and HFD increased the ratio of Ki67+ ATMs (Fig. 4f and Supplementary Fig. 4f), suggesting enhanced proliferation. However, ANT2 KO did not affect the HFD-induced Ki67+ ATM staining.
Next, we harvested conditioned media (CM) from differentiated 3T3-L1 adipocytes transfected with control or ANT2-specific siRNAs, and measured CM-induced chemotaxis of Raw264.7 monocytes/macrophages towards CM in Transwell dishes. As seen in Fig. 4g, migration of Raw267.4 was decreased with CM from ANT2 KD adipocytes. Consistent with this, the palmitate-induced increased expression of Ccl2 and Mip1a was lower in ANT2 KD adipocytes (Fig. 4h). ANT2 KD also decreased the expression of Il6 and Nos2 (Fig. 4h) with decreased reactive oxygen species (ROS) production (Supplementary Fig. 4g). Similarly, ANT2 KO in primary adipocytes decreased palmitate-induced Il6 and Nos2 expression (Supplementary Fig. 4h,i). Together, these results indicate that decreased adipocyte ANT2 expression in HFD/obese mice lowers adipocyte expression of pro-inflammatory chemokines and cytokines, leading to decreased monocyte/macrophage infiltration, reducing the overall adipose tissue pro-inflammatory state.
HIF-1α can induce fibrogenic gene expression in adipose tissue, and fibrosis contributes to ectopic fat accumulation and exaggerates the ATM pro-inflammatory state 18. In line with this, incubation of adipocytes in hypoxic conditions increased fibrogenic gene expression and decreased the expression of genes involved in lipogenesis and mitochondrial oxidation (Supplementary Fig. 4j,k). Therefore, we assessed whether the decreased adipocyte HIF-1α expression in ANT2 AKO mice also led to decreased adipose tissue fibrosis. Trichrome staining of eWAT sections revealed that ANT2 AKO mice were protected from HFD-induced increased collagen fiber deposition in eWAT (Fig. 4i). Moreover, mRNA expression of Col1a1, Col3a1, Elastin, Lox and Fibronectin was decreased in eWAT and primary adipocytes of ANT2 AKO mice (Fig. 4j,k).
Inducible deletion of adipocyte Ant2 improves glucose and insulin tolerance in HFD mice
We questioned whether inhibition of ANT2 activity could also reverse established glucose intolerance and insulin resistance in obese insulin resistant mice. To address this question, we generated an inducible ANT2 AKO mouse strain (ANT2 iAKO) by crossing tamoxifen (Tam)-inducible Cre expressing transgenic mice to Ant2 floxed mice (Ant2fl/fl:Adiponectin-CreERT2+/−). 12 week HFD insulin-resistant and glucose intolerant mice were given Tam treatment for 2 weeks. 1-2 week(s) after the final Tam injection, mice were subjected to glucose and insulin tolerance tests, and were sacrificed at 3 weeks for further tissue analysis (Fig. 5a). At sacrifice, total eWAT Ant2 mRNA expression level was reduced by 20% in total eWAT and 55% in isolated adipocytes without changes in body weight (Figs. 5b-d), As also seen in the constitutive ANT2 AKO mice, the decrease of Ant2 and the increase in Cre was limited to adipocytes, and were not observed in SVCs, liver, or skeletal muscle (Figs. 5b,c and Supplementary Fig. 5a,b). The proportion of pimonidazole adduct-positive hypoxic adipocytes and eWAT HIF-1α expression was markedly decreased in ANT2 iAKO mice (Fig. 5e,f). Moreover, glucose and insulin tolerance was significantly improved in Tam-treated ANT2 iAKO mice compared with Tam-treated WT controls (Fig. 5g,h). Moreover, this acute deletion of adipocyte Ant2 led to reduced expression of a variety of macrophage and inflammatory marker genes in ANT2 KO eWAT compared with controls (Fig. 5i).
Figure 5.
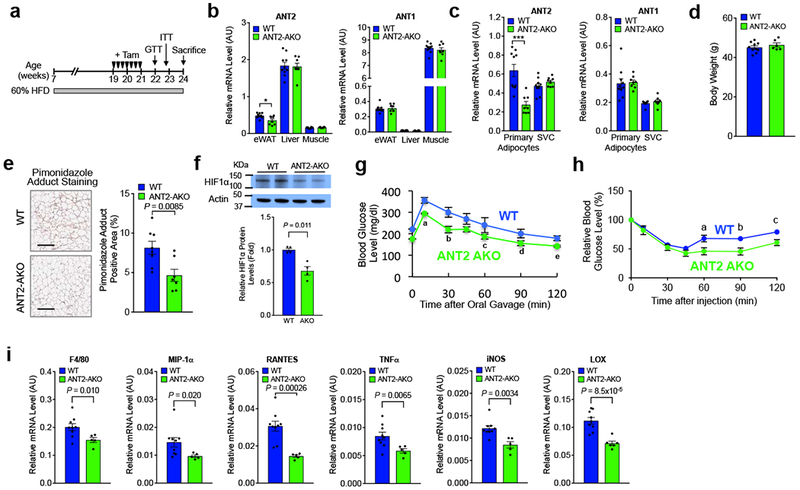
Inducible ANT2 AKO reverses established glucose and insulin intolerance. (a) Schematic representation of the experimental scheme for tamoxifen injection and metabolic analyses in inducible adipocyte ANT2 AKO mice. (b) mRNA levels of Ant2 and Ant1 in eWATs of WT and KO mice after induction (n=9 and 5 mice for WT and AKO, respectively). *P=0.037. (c) mRNA levels of Ant2, and Ant1 in adipocyte and SVC fraction of eWATs of WT and KO mice after induction (n=10 and 8 mice for WT and AKO, respectively). ***P=0.0058. (d) Body weight of HFD WT and KO at 22 weeks of age (n=10 and 6 mice for WT and AKO, respectively). (e) Ratio of pimonidazole adduct positive area among total section area (n=8 and 7 mice per group). Scale bar, 200 μm. (f) Western blot analysis of HIF-1α expression in HFD WT and ANT2 iAKO mice (n=4 mice per group). (g) GTTs (n=7 mice per group). aP=0.018, bP=0.045, cP=0.005, dP=0.004. (h) ITTs (n=10 and 6 mice for WT and AKO, respectively). aP=0.024, bP=0.015, and cP=0.014. (i) mRNA levels of inflammatory genes in eWAT (n=9 and 5 mice for WT and AKO, respectively). Statistical analyses were performed by the two-tailed Student’s t test (in panels b,c,e,f,i) or by the two-way ANOVA with post-hoc two-tailed t-tests between the individual groups (in panels g,h). All data are presented as mean +/− SEM.
Adipocyte apoptosis is decreased in ANT2 AKO mice
To test whether deletion of adipocyte Ant2 reduces obesity-induced adipocyte death, we performed immunochemistry analysis of eWATs from HFD WT and ANT2 AKO mice. As seen in Fig. 6a, the number of cleaved (active form)-caspase-3 containing adipocytes was decreased in HFD ANT2 AKO mice. Consistent with this, cleaved caspase-3 protein levels and caspase-3/7 activity was also decreased in eWAT of HFD ANT2 KO mice compared with HFD WT controls (Fig. 6b,c). On the other hand, cathepsin D activity was unaltered in eWAT of ANT2 AKO mice (Fig. 6d). These results suggest that ANT2 AKO decreases adipocyte apoptosis, but not necrosis, in visceral adipose tissue.
Figure 6.
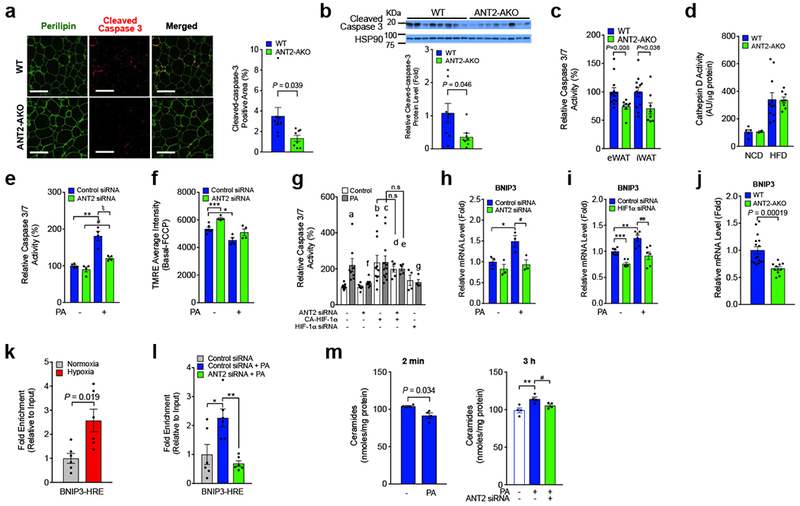
HFD-induced adipocyte apoptosis is decreased in ANT2 AKO mice. (a) Immunofluoresence staining of eWATs from 12 week HFD mice. Percentage of cleaved caspase-positive area was calculated and graphed on the right (n=8 mice per group). Scale bar, 200 μm. (b) Cleaved caspase-3 protein levels in eWAT of 12 week HFD mice (n=8 mice per group). (c) Caspase-3/7 activity in eWAT and iWAT of HFD WT (n=12 mice) and KO (n=8 mice) mice. (d) Cathepin D activity in eWAT (n=5, 2, 11 and 8 mice in bars 1 through 4) . (e,f) ANT2 effects on adipocyte apoptosis. 24 h after siRNA transfection, cells were incubated with or without high palmitate (PA; 400 μM) for 24 h, and subjected to caspase-3/7 activity (e; **P=0.0062, #P=0.012, ξP=0.014) or MMP (f; ***P=0.00083, *P=0.010) measurements (n=4 wells per group). (g) Chronic palmitate-induced Caspase-3/7 activity in 3T3-L1 adipocytes with ANT2 KD, HIF-1α KD and/or constitutively active (CA)-HIF-1α overexpression (n=9, 8,6,7,11,12,6,5,4, and 4 wells in bars 1 through 10). aP=0.013, bP=0.0067, cP=0.0021, dP=0.016, and eP=0.00066 vs lane 1; fP=0.030, and gP=0.039 vs lane 2. (h) Bnip3 mRNA expression in the same set of samples in panel e. *P=0.045, #P=0.038. (i) mRNA levels of Bnip3 in control or HIF-1α KD adipocytes (n=6 wells per group). ***P=0.00014, *P=0.0054, ##P=0.0054. (j) mRNA levels of Bnip3 in eWAT of HFD WT (n=16 mice) and KO mice (n=10 mice). (k,l) ChIP analysis of HIF-1α occupancy at Bnip3 promoter in 3T3-L1 adipocytes incubated at normoxic (21% O2) or hypoxic (1% O2) condition for 3h (k), or after 400 μM palmitic acid treatment for 24h (l). n=6 wells per group. *P=0.021, **P=0.0028. (m) Intracellular ceramide levels in control or ANT2 KD 3T3-L1 adipocytes. 48h after siRNA transfection, cells were incubated with or without 400 μM palmitate-containing media for 2 min or 3h, and subjected to intracellular ceramide measurements (n=4 wells per group). **P=0.012, #P=0.045. Statistical analyses were performed by the two-tailed Student’s t test (in panels a-c,j,l,m(left)) or by the ANOVA with post-hoc two-tailed t-tests between the individual groups was performed (in panels e-i,m(left)). All data are presented as mean +/− SEM.
To determine whether the decrease in adipocyte apoptosis is due to cell autonomous changes, we conducted in vitro ANT2 KD experiments. Chronic palmitate-induced increased caspase-3/7 activity was substantially reduced in ANT2 KD adipocytes (Fig. 6e). Moreover, chronic palmitate-induced decreased mitochondrial membrane potential (MMP) was reversed by ANT2 KD (Fig. 6f). We also measured palmitate-induced caspase-3/7 activity in 3T3-L1 adipocytes transfected with anti-ANT2 siRNA, anti-HIF-1α siRNA or a constitutive active HIF-1α (CA-HIF-1α) expressing plasmid construct. As seen in Fig. 6g, overexpression of HIF-1α induced increased caspase-3/7 activity in adipocytes, which was not blocked by ANT2 KD, while the palmitate-induced increased caspase-3/7 activity was blunted by HIF-1α KD. This suggest that palmitate-induced adipocyte apoptosis is mediated by an ANT2-dependent increase in HIF-1α expression.
Bcl-2/adenovirus E1B 19 KDa interacting protein 3 (BNIP3) is an atypical pro-apoptotic BH3-only protein localized to the mitochondria and mediates hypoxia-induced loss of mitochondrial potential and cell death 31–33. We hypothesized that the effect of palmitate treatment to induce adipocyte apoptosis could be mediated through HIF-1α-dependent induction of Bnip3 expression. Chronic palmitate treatment led to increased Bnip3 and HIF-1α mRNA expression, which was decreased by ANT2 or HIF-1α KD (Fig. 6h,i and Supplementary Fig. 6a,b). Moreover, eWAT Bnip3 expression was significantly decreased in HFD ANT2 AKO mice, compared with WT controls (Fig. 6j). To test whether Bnip3 is a direct target of HIF-1α, we measured HIF-1α occupancy on the Bnip3 promoter in 3T3-L1 adipocytes incubated at normoxic (21% O2) vs hypoxic (1% O2) conditions, or after palmitic acid (PA) treatment with or without ANT2 KD. As seen in Figs. 6k,l, HIF-1α occupancy at the Bnip3 promoter was significantly increased by hypoxia or PA treatment. Moreover, the PA-induced increase in HIF-1α occupancy of the Bnip3 promoter was blocked by ANT2 KD. These results suggest that increased HIF-1α contributes to obesity-induced adipocyte apoptosis by transactivating Bnip3 expression (Supplementary Fig. 6c).
PA can stimulate ceramide synthesis, and increased ceramides cause mitochondrial dysfunction/apoptosis 34. Furthermore, adiponectin expression was increased in ANT2 KD 3T3-L1 adipocytes and in the plasma and eWAT of HFD ANT2 KO mice (Fig. 3l-n), and adiponectin stimulates ceramidase activity 35. We tested whether ceramides participate in PA/ANT2-mediated adipocyte death by measuring intracellular ceramide levels after acute (2min) or subchronic (3h) treatment with 400 μM PA. 3h treatment of 3T3-L1 adipocytes with PA increased intracellular ceramide levels, whereas, 2 min incubation did not (Fig. 6m). Since the maximal effects of FFA treatment to increase ANT2-dependent oxygen consumption occurs within 1-2 minute(s) (Supplementary Fig. 6d) 36, these results suggest that ceramides do not mediate the acute effects of FFAs to increase uncoupled mitochondrial respiration. Interestingly, the 3h PA-induced ceramide levels were attenuated in ANT2 KD cells (Fig. 6m). Therefore, it is likely that increased FFAs and inflammation along with decreased adiponectin expression can contribute to adipocyte apoptosis by increasing intracellular ceramide accumulation.
Discussion
In these studies, we demonstrate that deletion of adipocyte Ant2 improves adipose tissue inflammation and systemic insulin resistance, without changing body weight or energy expenditure in HFD/obese mice. Mechanistically, deletion of adipocyte Ant2 inhibited the obesity-induced increase in uncoupled respiration in white adipocytes, without affecting mitochondrial number, mass or electron transport chain component expression. This led to increased intra-adipocyte O2 tension and decreased HIF-1α expression. Consistent with this, mRNA expression of HIF-1α target genes that are typically increased in WT obese adipose tissue, was also decreased in the eWAT of HFD ANT2 AKO mice. This includes decreased expression of genes involved in macrophage chemotaxis, pro-inflammatory activation of macrophages, oxidative stress, cell death, and fibrosis. Accordingly, ATM accumulation and M1-like polarization was reduced in ANT2 AKO mice along with decreased adipose tissue interstitial collagen deposition. Moreover, we found that deletion of adipocyte Ant2 prevented obesity-induced adipocyte apoptosis with decreased pro-apoptotic Bnip3 expression. Overall, these new results support the concept that obesity leads to increased adipocyte oxygen consumption causing a state of relative adipocyte hypoxia. This provides an early trigger for HIF-1α induction which promotes adipose tissue inflammation and systemic insulin resistance.
Tissue O2 tension is determined by the balance between O2 supply and demand. Several previous studies23,24 have shown decreased interstitial adipose tissue O2 tension in obesity with the general conclusion that this is due to a mechanical imbalance between capillary perfusion and the expanding adipocyte mass. However, in non-ischemic conditions, it is generally believed that increased O2 demand, instead of decreased O2 supply, is largely responsible for physiologic tissue hypoxia. Indeed, we have previously shown increased uncoupled respiration with increased adipocyte oxygen consumption in the initial stages of HFD/obesity 17. Our current in vivo studies of adipose tissue O2 kinetics, combined with ex vivo mitochondrial analyses and O2 consumption, shed new light on this issue. We show that ANT2 AKO selectively blocks the obesity-induced increased adipocyte O2 consumption, without changes in mitochondrial oxidative phosphorylation or systemic energy balance. This enabled us to use ANT2 AKO mice as a model system to analyze the relative contribution of increased O2 consumption to interstitial adipose tissue and intra-adipocyte O2 tension. Inhibition of obesity-induced O2 consumption in the AKO mice led to a ~35% increase in interstitial tissue oxygen tension, indicating that increased adipocyte O2 consumption is responsible for a sizable component of the decrease in tissue O2 tension. Most likely, the decrease in functional capillary density contributes the additional component of decreased interstitial O2 tension. On the other hand, differences in intracellular adipocyte O2 consumption in vitro or in vivo were well-correlated to changes in intracellular O2 tension and HIF-1α expression. Taken together, these results suggest that decreased interstitial O2 tension in obesity is due to a combination of increased O2 demand and reduced supply. However, increased intracellular O2 consumption is the critical determinant of intracellular hypoxia, and is required for increased HIF-1α expression.
It is possible that the decreased interstitial O2 tension in chronic obesity creates a permissive environment allowing greater increases in HIF-1α expression. In this regard, it is important to note that inducible deletion of adipocyte Ant2 also exerted beneficial metabolic effects in the intervention mode. This indicates that ANT2-mediated increased O2 consumption plays a role in decreasing intracellular O2 tension, HIF-1α induction and increased inflammation in the context of chronic obesity. It is interesting to note that, in our inducible ANT2 KO mice, the KO efficiency was ~20% in whole adipose tissue and ~55% in adipocytes, while the beneficial metabolic effects were almost comparable to those in the constitutive ANT2 AKO mice. This raises the possibility that adipocyte ANT2 is mediating a relatively rate-limiting step to trigger adipose tissue inflammation, insulin resistance and glucose intolerance. Since pharmacologic intervention usually can not achieve 100% inhibition of a target, this also supports the idea that ANT2 could be a good target for anti-diabetic therapies.
Obese subjects can be classified as MNO individuals, who exhibit normal glucose tolerance and insulin sensitivity with normal hepatic triglyceride levels or MAO, who are glucose intolerant, insulin resistant and have increased hepatic triglyceride content 37. While the mechanistic determinants between MNO and MAO individuals are still unclear and may be multifactorial, previous studies show that MNO subjects exhibit decreased adipose tissue inflammation along with an increased capacity to produce and accommodate intracellular lipids, compared with MAO individuals 37–39. In this study, we found that people with MAO had lower adipose tissue O2 tension than people with MNO, who in turn had lower adipose tissue O2 tension than MNL participants. This is directionally similar to the changes in interstitial O2 tension we observed in obese WT compared with obese AKO mice. A negative relationship between adipose tissue O2 tension and adipose tissue insulin sensitivity (insulin-mediated suppression of adipose tissue lipolysis) has been observed previously in people with obesity 40.
There are only a few examples of MNO-like animal models, without directly manipulating immune cell inflammatory pathways 41–43. While the molecular mechanisms through which each of the individual animal models acquire an MNO-like phenotype varies, all of these models exhibit a common metabolic adaptation to increased energy influx: with increased adipose tissue mass and decreased adipose tissue inflammation. With respect to the analogy between AKO mice and MNO subjects, we found that AKO mice display an overall increase in adipocyte size with an increase in the ratio of larger to smaller adipocytes, a finding also reported in MNO subjects 38. Further studies are required to determine whether decreased ANT2 activity is mechanistically related to the MNO phenotype in man.
It is of interest that the AKO mice showed a marked improvement in adipose tissue function and this was reflected by systemic insulin sensitivity in the liver, but not muscle. There are many other examples in which improved adipose tissue function causes increased insulin sensitivity in muscle and liver, but, in this case, the effects were hepatic restricted. The mechanism of this tissue-specific crosstalk between adipose tissue and liver remains to be defined.
We found that deletion of ANT2 prevented the adipocyte apoptosis associated with HFD in WT mice. Our results indicate that this was due to abrogation of HIF-1α induction in the AKO animals. This is consistent with the overall view that obesity induces adipocyte apoptosis, at least partially, through a cascade of events including ANT2 stimulation leading to HIF-1α induction with a subsequent HIF-1α-induced increase in Bnip3 expression. As an additional component, increased FFAs and inflammation, along with decreased adiponectin expression can chronically increase ceramide accumulation, providing a further mechanism to exaggerate adipocyte mitochondrial dysfunction and apopotosis. Additionally, our studies showed that the adipose tissue hypoxia in obesity is also downstream of intracellular adipocyte hypoxia.
There are 4 isoforms of ANTs in humans (ANT1, 2, 3 and 4) and 3 in mice (ANT1, 2 and 4) 44. In mouse adipocytes, ANT1 and 2 are predominantly expressed while ANT4 is barely detected 17. Only ANT2 mediates FFA-induced uncoupled respiration while ANT1 is responsible for the basal respiratory activity of mitochondria 17,45. In this study, we observed that adipocyte ANT2 KO did not affect ANT1 expression in fat cells. While redundant and distinct roles and expression patterns of different ANT isoforms in adenine nucleotide transport across the mitochondrial inner membrane have been reported, the molecular mechanisms of how different ANT isoforms exert their effects remain to be determined.
In this study, we demonstrate that deletion of adipocyte Ant2 in obese mice improved glucose intolerance and insulin resistance by decreasing obesity-induced uncoupled respiration, O2 consumption and HIF-1α expression in adipocytes. These beneficial effects were seen in both prevention and intervention modes. Other studies have shown that liver-specific ANT2 KO protects mice from HFD-induced liver steatosis 46. Taken together, these results suggest a plausible scenario in obesity-induced inflammation and insulin resistance. Thus, obesity leads to a rapid initial onset of increased uncoupled respiration in adipocytes via an ANT2-mediated mechanism. This results in: increased adipocyte O2 consumption → relative adipocyte hypoxia → increased HIF-1α expression → increased adipose tissue inflammation → systemic insulin resistance. This suggests that ANT2 may be an important insulin sensitizing drug discovery target, and future work will be necessary to determine whether this has clinical utility.
Online Methods
Animals
To generate adipocyte-specific ANT2 KO mice, Ant2fl/fl mice 47 were crossed to mice expressing Cre recombinase (Jackson Labs, strain # 028020) or Cre-ERT2 chimeric protein (Jackson Labs, strain # 025124) under the control of the Adiponectin promoter. Mice were housed in colony cages in 12 h light/12 h dark cycles. For the HFD study, 8 week-old male mice were subjected to 60% HFD for the indicated time periods (Research Diets, Inc). Glucose and insulin tolerance tests and hyperinsulinemic-euglycemic clamp experiments were performed as described previously 16,17. Briefly, for euglycemic clamp studies, mice were surgerized for jugular vein cannulation. After five days of recovery, mice were fasted for 6 h and infused with D-[3-3H] glucose (Perkin Elmer) for 90 min. After tracer equilibration, blood samples were collected at −10 and 0 min (basal). Glucose (50% dextrose) and tracer (5 uCi/h) plus insulin (8 mU/kg/min) were then infused into the jugular vein. Blood glucose levels were monitored at every 10 min and glucose infusion rate was adjusted as necessary. Steady-state blood glucose levels were maintained at 120 mg/dl ± 10 mg/dl for the last 20 min or longer, without changing glucose infusion rate, and blood samples were collected at 110 and 120 min (clamped). Specific activity and plasma free fatty acid and insulin levels were measured from the basal and clamped plasma samples. Metabolic rate and physical activity were measured monitored with the CLAMS/Oxymax system (Columbus Instruments). All animal procedures were performed in accordance with an IACUC-approved protocol and the research guidelines for the use of laboratory animals of University of California San Diego.
Study subjects
Twenty seven men and women participated in this study. Subjects were characterized by body weight status and metabolic health into three groups: 1) metabolically-normal lean (MNL; n=7) defined as body mass index (BMI) 18.5–24.9 kg/m2, fasting plasma glucose concentration <100 mg/dl, 2-hr oral glucose tolerance test (OGTT) plasma glucose concentration <130 mg/dl, and hemoglobin A1c ≤5.5%; 2) metabolically-normal obese (MNO; n=11) defined as BMI ≥30.0 kg/m2, fasting plasma glucose concentration <100 mg/dl, 2-hr OGTT plasma glucose concentration <130 mg/dl, and hemoglobin A1c ≤5.5%; and 3) metabolically abnormal obese (MAO; n=9), defined as BMI ≥30.0 kg/m2, fasting plasma glucose concentration ≥100 mg/dl, or 2-hr OGTT plasma glucose concentration ≥140 mg/dl, or hemoglobin A1c 5.7–6.4%. This study was approved by the Institutional Review Board of Washington University School of Medicine in St. Louis, MO; written informed consent was obtained from all subjects before their participation (ClinicalTrials.gov, NCT02706262).
Adipose tissue pO2 measurements in human Subjects
All procedures were performed in the Clinical Research Unit. Body fat mass was determined by dual energy x-ray absorptiometry. An OGTT was performed in the morning after subjects fasted for 12 h overnight. Blood samples were obtained through an indwelling intravenous line before and 120 min after subjects ingested a 75 g glucose drink to determine plasma glucose concentrations. On a separate occasion, subcutaneous abdominal adipose tissue O2 tension (pO2) was determined. After subjects fasted for 12 hr overnight, the periumbilical area of the abdomen was cleaned and draped, the skin anesthetized with 1% lidocaine, and a small 0.5 cm skin incision was made under sterile conditions. A sterile 250 um diameter, O2-sensitive fiber-optic probe (OxyLite™, Oxford Optronix, Ltd. Milton Park, Abingdon, United Kingdom) was inserted through the skin incision into subcutaneous abdominal adipose tissue and held in place for two minutes. Data were recorded every 10 seconds and the pO2 value for each subject was calculated as the average of all values obtained during steady-state (defined as less than a 10% variance in pO2 for at least 40 seconds).
Interstitial O2 tension in mice
The O2 partial pressure was measured using carbon fiber electrodes (Carbostar-1, Kation Scientific; Minneapolis, MN). The tip of the electrode was coated with 5% Nafion (Sigma; St. Louis, MO) to increase O2 specificity. The process consisted of three individual Nafion coats. The microelectrodes were polarized at −0.8 V relative to a silver-silver chloride reference electrode (Cypress Systems; Lawrence, KS). O2 measurements were performed using the two electrodes system (working and reference electrode), and the current generated was measured with a potentiostat and electrometer (Keithley model 610C; Cleveland, OH). The microelectrodes were calibrated at 37°C with 0, 5, 10 and 21% O2 gases (Airgas; Los Angeles, CA), and tissues were superfused (0.1 mL/min) with physiological Krebs salt solution. The tissue was maintained at 35–37°C by the heated Krebs solution. The solution was spread on the tissue as a thin film, drained into a platter, and drawn off by suction. The solution was equilibrated with 95% N2 and 5% CO2, which maintained the superfusate at a pH of 7.4 and minimized O2 delivery to the tissue from the atmosphere. O2 measurements were made by penetrating the tissue with the microelectrode tip. The reference electrode was placed in the bath, and the microelectrode was placed in a shielded holder and advanced towards the measurement site with a micromanipulator. A long-working distance ×10 Leitz objective was used to direct the electrode to the measurement site. Before measurements, the electrode tip was immersed in the supernatant suffusion solution and the current was registered. The supernatant suffusion solution was set as 0 mmHg reference point. Upon introduction into the tissue, the microelectrodes responded with a time constant that was estimated to be of the order of 10 sec. A stable reading was obtained within 30 sec, and upon reaching the current plateau value, the electrode was extracted from the tissue and the tip maintained within the suffusing saline solution. The unit of tissue O2 tension was converted from mmHg to %, later.
Functional capillary density
Functional capillary density (FCD) was defined as the ratio of the total length of capillary segments with transit of, at least, a single RBC in a 60-s period per total length of plasma-perfused capillary segements. This parameter was evaluated in 20 successive microscopic fields (totaling a region of ~1.6 mm2, 420 × 320 μm each) by systematically displacing the microscopic field of view by a field width in successive steps in the lateral direction. The first field was chosen by a distinctive anatomic landmark (i.e., large microvascular bifurcation) to easily and quickly re-establish the same observation fields at each observation time point. Each field had between 10 and 18 capillary segments with RBC flow. Total length of the RBC-perfused capillaries per the given microscopic field area of view, was evaluated by measuring and adding the length of capillaries with RBC transit in the field of view for 60s.
Adipocyte O2 consumption rate
O2 consumption in primary adipocytes were measured as described previously 17.
Histology
Immunohistochemistry analyses were performed as described previously 17. For apoptotic cells analysis, paraffin-embedded tissue sections were stained with anti-Perilipin (Abcam, Cat. No. ab-61682) and cleaved caspase-3 (Cell Signaling Technology, Cat No. 9664) antibodies. Images were captured using a NanoZoomer slide scanner system with NanoZoomer Digital Pathology software (Hamamatsu) or confocal fluorescence microscopy. Microscopic images were analyzed using ImageJ software.
Western blot analysis
Tissues and cells were lysed with Mammalian Protein Extraction Reagent (Thermo Scientific, Rockford, IL) containing EDTA-free protease and phosphatase inhibitor mixture (Roche Diagnostics) and then centrifuged at 12,000 rpm for 10 min at 4 °C. The supernatants were separated by precast gels (Bio-Rad) using a running buffer and electrotransferred to polyvinylidene difluoride (PVDF) membranes. The membranes were blocked for 2 h in Tris-buffered saline with Tween 20 (TBST) (10 mM Tris-HCl, 0.1% Tween 20, pH 7.4) containing 5% BSA and then incubated with anti-cleaved caspase-3 (Cell signaling technology, Cat. No. 9664), HIF-1α (Abcam, Cat. No. ab-2185), HIF-2α (Novus Biologicals, Cat. No. NB100-122), HSP90 (Santa Cruz Biotechnology, Cat. No. SC-13119), total OXPHOS rodent WB antibody cocktail (Abcam, ab-110413), Adiponectin (Invitrogen, Cat No. MA1-054) antibodies at 4 °C for overnight. After washing with fresh TBST, the membrane was incubated with secondary antibody conjugated with horseradish peroxidase specific to rabbit or mouse IgG (Jackson ImmunoResearch Lab.; 1:5,000 dilution) and visualized using the ECL system (Thermo Scientific) followed by autoradiography or Bio-Rad ChemiDoc XRS+ imaging system. Intensity of the bands in the autoradiograms was measured using ImageJ software.
Quantitative real-time PCR
Total RNA was extracted by TRIzol reagent (Invitrogen) or RNeasy Mini Kit (QIAGEN, Hilden, Germany). Synthesis of cDNA was performed using the High-Capacity cDNA Reverse Transcription Kit (Applied Biosystems, Foster City, CA). Quantitative real-time PCR (qRT-PCR) was performed using Power SYBR Green PCR Master Mix (Applied Biosystems) and primers shown in Supplementary Table 2.
Mitochondrial DNA content
Total DNA was extracted from cells using the DNeasy Blood & Tissue Kit (Qiagen Technologies, USA) according to the instructions from the manufacturer. The relative mtDNA copy number was determined by normalizing mtDNA copy number to genomic GAPDH copy number (Quispe-Tintaya et al. 2013). Primer sequences are shown in Supplementary Table 2.
Mitochondrial citrate synthase activity
Citrate synthase activities were measured using a commercial kit according to the manufacturer’s instruction (BioVision, Milpitas, CA, USA).
Insulin-stimulated AKT phosphorylation in mouse tissues
In vivo tissue insulin action was evaluated by measuring insulin-stimulated Akt phosphorylation in liver, skeletal muscle, and eWAT. Briefly, after 6 hr fasting, mice were anesthetized and parts of these insulin target tissues were collected to measure basal level of Akt phosphorylation. After a dose of insulin (0.6 U/kg body weight) was injected via inferior vena cava, parts of liver, skeletal muscle, and eWAT were collected at 3 min, 7 min, and 10 min, respectively. Total and phospho-Akt levels were measured by Western blot analyses. Phosphorylated Akt (Ser473, Cat. No. 4060) or total AKT (Cat. No. 4685) was purchased from Cell Signaling Technology, Inc.
Serum/plasma insulin and adipokine measurements
Serum/plasma adipokine and insulin levels were measured by using multiplex mouse adipokine assays (EMD Millipore) or insulin ELISA (ALPCO) kit.
Adipose tissue fractionation and flow cytometry
Flow cytometry analysis of adipose tissue immune cells was performed as described previously 16,17. Briefly, epididymal adipose tissues were minced and digested with collagenase (1 mg/mL; Sigma-Aldrich) buffer for 30 min at 37°C with shaking. The digests were filtered through 100 μm cell strainers and centrifuged at 500 g for 5 min. Pellets containing SVCs were saved for immune cell analysis. After incubation in erythrocyte lysis buffer (eBioscience) for 5 min, cells were resuspended into FACS buffer (PBS supplemented with 1% endotoxin-low BSA). Cells were stained with Live/Dead Aqua to exclude dead cells and blocked with CD16/32 monoclonal antibody (Thermofisher, Cat No. 14-0161-81). The fluorescence labeled antibodies against CD45 (eBioscience, Cat No. 83-0451-42) for leukocytes, CD11b (eBioscience, Cat No. 11-0112-82), F4/80 (eBioscience, Cat No. 25-4801-82), CD11c (eBioscience, Cat No. 17-0114-82), and CD206 (BioLegend, Cat No. 141706) for macrophages, CD3 (eBioscience, Cat No. 56-0032-82), CD4 (eBioscience, Cat No. 17-0041-82), CD8 (BioLegend, Cat No. 100722), and Foxp3 (eBioscience, Cat No. 12-5773-80) for T cells were used. For intracellular staining of Foxp3, we used Foxp3 staining kits (eBioscience, Cat No. 00-5523-00) according to the manufacturer’s instructions. For the assessment of proliferating ATMS, FITC-labeled Ki-67 monoclonal antibodies (eBioscience, Cat. No. 11-5698-82) were used. Cells were gently washed twice and resuspended in FACS buffer. Data was acquired in a FACS CANTO (BD Biosciences) and analyzed using FlowJo software (Treestar).
Cell culture and adenovirus infection
3T3-L1 preadipocytes were grown in Dulbecco’s modified Eagle’s medium (DMEM) supplemented with 10% fetal bovine serum (FBS), at 10% CO2 and 37°C. Differentiation of 3T3-L1 cells was induced as described previously 48. Briefly, confluent cells were incubated for 2 days in a medium comprising DMEM supplemented with 10% FBS, 0.5 mM 3-isobutyl-1-methylxanthine, 1 μM dexamethasone, and 10 μg of insulin/ml. Thereafter, medium was replaced every other day with DMEM containing 10% FBS and 10 μg/ml insulin.
Primary preadipocytes were isolated from subcutaneous adipose tissue of ANT2fl/fl mice using a conventional collagenase method. Differentiated adipocytes were infected with adenovirus (Ad-mock and Ad-Cre-GFP) 12 h after plating for 24 h at multiplicity of infection (m.o.i.) of 100 in serum-free medium. After 24 h, cells were stimulated with palmitic acid for 48 h. RNA was extracted and qRT-PCR was performed as described above.
siRNAs and transient transfection
The negative control (sc-37007) and specific siRNAs against ANT2 (sc-72506), and HIF-1α (sc-35562) were purchased from Santa Cruz Biotechnology, Inc. Transfections were performed with DharmaFECT 1 transfection reagent (Dharmacon) and conducted according to the manufacturer’s instruction.
Measurement of intracellular ROS and mitochondrial membrane potential (MMP)
Intracellular ROS and MMP levels were measured using 5-(and-6)-chloromethyl-2′,7′-dichlorodihydro-fluorescein diacetate (CM-H2DCF-DA; Molecular Probes, Eugene, OR, USA) and 1 μM tetramethylrhodamine, ethyl ester (TMRE, Life Technologies), respectively.
Caspase-3/7 activity and viable cell activity assays
Caspase-3/7 activity and viable cell activity were measured by using ApoLive-Glo™ Multiplex Assay kit (Promega, USA).
Chromatin Immunoprecipitation (ChIP) Assays
ChIP was performed using the ChIP-IT High Sensitivity Kit (Active Motif, Cat. No. 5030) according to the manufacturer’s instructions, with minor modifications. Differentiated 3T3-L1 adipocytes were cross-linked with 1% formaldehyde, followed by quenching with 135 mM glycine. Cells were disrupted with a Dounce homogenizer and the chromatin was isolated. The lysates were sonicated to shear the DNA to an average length of 300–600 bp. Chromatin was immunoprecipitated using an anti-HIF1α (Abcam, Cat. No. ab-2185) antibody or nonspecific rabbit IgG control (Jackson ImmunoResearch Laboratories, 011-000-003). ChIP DNAs were purified and ChIP enrichment was quantified by quantitative PCR (qPCR). Fold enrichment was determined by the fold input method. Primers used were for Bnip3-HRE (forward, 5’-CGG TCC ACT TCT GCA TTA GA-3’ and reverse, 5’-CAC TGG ACT GAG GGA CAA GG-3’) as described previously 49.
Ceramide Measurement
At the end of treatment, 3T3-L1 adipocytes (in 6-well plates) were washed with ice-cold PBS and saved at −70°C. For ceramide assays, adipocytes were scrapped off in 0.5 ml methanol and transferred to 2ml Eppendorf tubes. 1ml of 50% chloroform was added to each tube and the vortexed. After centrifugation at 10,000g for 10 minutes. Two fluid layers were generated, separated by a white protein-containing interphase. The upper aqueous layers were discarded, and lower organic layers were transferred into new Eppendorf tubes. The interphase was saved for protein assays. Organic solvent was dried by blowing nitrogen gas. To the dry tubes, 100 μl reaction buffer (RB) containing 0.15% Triton X-100, 0.2 mM cardiolipin in 20 mM Hepes, 10 mM KCl, 15 mM MgCl2 and 1 mM DTT was added. The tubes containing lipids in RB were subjected to sonication in ice to form lipid micelles. These micelles were analyzed for ceramide content. We adopted a protocol from Don AS and Rosen H (Analytical Biochemistry, vol. 375, p.265-271, 2008). The principle of the assay was to convert ceramide to ceramide phosphate in presence of a ceramide kinase preparation (Sigma) and γ32P-ATP (Perkin Elmer). The reaction mixture contained 0.1 μCi γ32P-ATP (5 mM) per assay and incubated at 35°C for 30 minutes. Reactions were stopped by adding 250 μl of a mixture of chloroform and methanol (2:1). The reaction tubes were centrifuged (10000 μ g for 10 minutes) to separate two layers and subsequently, ceramides and ceramide phosphates present in the lower organic phase were separated by thin layer chromatography (TLC) on silica gel 60 plates (Millipore) using a solvent mixture, n-butanol: acetic acid: water (3:1:1) to achieve the separation. At first, we calibrated the assay using fluorescent labeled C8-NBD-Ceramide (Cayman Chemicals) as the substrate to visualize the formation of C8-NBD-Ceramide-32P-phosphates on the TLC plate. A calibration curve consisting of n moles of NBD-ceramide used as substrate versus the radioactive counts on the fluorescent spots on the TLC plates was constructed. It is to be noted that the aqueous phase demonstrated no significant fluorescent spots. Although aqueous phase had all the residual unreacted γ32p-ATP, there was no significant radioactivity on the designated TLC spots for NBD-Ceramide-phosphates (visualized by running reference NBD-Ceramide-phosphates during TLC analysis of the aqueous phase). Therefore, while assaying the micelles prepared from 3T3-L1 extracts, we decided to directly count radioactivity in the organic phase and determine n moles of ceramide present from the calibration curve. The ceramide content of 3T3-L1 adipocytes were normalized to protein content.
Statistics
The results are shown as means ± SEM. Statistical analyses were performed by the two-tailed Student’s t test (for comparison between two groups) or 1 or 2-way ANOVA (for comparison between three or more groups or in two groups at multiple time points, respectively, with post-hoc t tests between the individual groups) unless indicated in the figure legend; p < 0.05 was considered significant. Statistical methods were not used to predetermine necessary sample size, but sample sizes were chosen based on estimates from pilot experiments and previously published results such that appropriate statistical tests could yield significant results. Statistical analyses used in the data presented are justified and described in all legends. Parametric tests were used that assume normal distribution, which we showed to be the case when data were plotted as frequencies. Variances were tested by Levene’s test for homogeneity of variance, and variances in the data were not significantly different.
Life Sciences Reporting Summary
Further information on experimental design is available in the Life Sciences Reporting Summary.
Data Availability
All data that support the findings of this study are included in the paper or its supplementary information.
Supplementary Material
Acknowledgements
We thank Dr. Douglas Wallace (University of Pennsylvania) for providing Ant2 floxed mice. This study was supported by the US National Institute of Diabetes and Digestive and Kidney Diseases (DK074868, DK063491, DK56341 and DK101395), a UCSD/UCLA Diabetes Research Center P&F grant, the Basic Science Research Program and the Bio-Synergy Research Project through National Research Foundation of Korea (NRF-2017R1C1B2011125, NRF-2017M3A9C4065956), the POSCO TJ Park Foundation, and a grant from the Pershing Square Foundation. M.R. was supported by a post-doctoral fellowship from the American Heart Association (16POST29990015).
Footnotes
Authors have no competing interest to declare.
References
- 1.Olefsky JM & Glass CK Macrophages, inflammation, and insulin resistance. Annu Rev Physiol 72, 219–246 (2010). [DOI] [PubMed] [Google Scholar]
- 2.Kusminski CM, Bickel PE & Scherer PE Targeting adipose tissue in the treatment of obesity-associated diabetes. Nat Rev Drug Discov 15, 639–660 (2016). [DOI] [PubMed] [Google Scholar]
- 3.Lee YS, Wollam J & Olefsky JM An Integrated View of Immunometabolism. Cell 172, 22–40 (2018). [DOI] [PMC free article] [PubMed] [Google Scholar]
- 4.Friedman J The long road to leptin. J Clin Invest 126, 4727–4734 (2016). [DOI] [PMC free article] [PubMed] [Google Scholar]
- 5.Yore MM, et al. Discovery of a class of endogenous mammalian lipids with anti-diabetic and anti-inflammatory effects. Cell 159, 318–332 (2014). [DOI] [PMC free article] [PubMed] [Google Scholar]
- 6.Hotamisligil GS Inflammation, metaflammation and immunometabolic disorders. Nature 542, 177–185 (2017). [DOI] [PubMed] [Google Scholar]
- 7.Cao H, et al. Identification of a lipokine, a lipid hormone linking adipose tissue to systemic metabolism. Cell 134, 933–944 (2008). [DOI] [PMC free article] [PubMed] [Google Scholar]
- 8.Ferrante AW Jr. The immune cells in adipose tissue. Diabetes Obes Metab 15 Suppl 3, 34–38 (2013). [DOI] [PMC free article] [PubMed] [Google Scholar]
- 9.Ying W, et al. Adipose Tissue Macrophage-Derived Exosomal miRNAs Can Modulate In Vivo and In Vitro Insulin Sensitivity. Cell 171, 372–384 e312 (2017). [DOI] [PubMed] [Google Scholar]
- 10.Li P, et al. Hematopoietic-Derived Galectin-3 Causes Cellular and Systemic Insulin Resistance. Cell 167, 973–984 e912 (2016). [DOI] [PMC free article] [PubMed] [Google Scholar]
- 11.Schwartz DR & Lazar MA Human resistin: found in translation from mouse to man. Trends Endocrinol Metab 22, 259–265 (2011). [DOI] [PMC free article] [PubMed] [Google Scholar]
- 12.Kanda H, et al. MCP-1 contributes to macrophage infiltration into adipose tissue, insulin resistance, and hepatic steatosis in obesity. J Clin Invest 116, 1494–1505 (2006). [DOI] [PMC free article] [PubMed] [Google Scholar]
- 13.Solinas G, et al. JNK1 in hematopoietically derived cells contributes to diet-induced inflammation and insulin resistance without affecting obesity. Cell Metab 6, 386–397 (2007). [DOI] [PubMed] [Google Scholar]
- 14.Saberi M, et al. Hematopoietic cell-specific deletion of toll-like receptor 4 ameliorates hepatic and adipose tissue insulin resistance in high-fat-fed mice. Cell Metab 10, 419–429 (2009). [DOI] [PMC free article] [PubMed] [Google Scholar]
- 15.Patsouris D, et al. Ablation of CD11c-positive cells normalizes insulin sensitivity in obese insulin resistant animals. Cell Metab 8, 301–309 (2008). [DOI] [PMC free article] [PubMed] [Google Scholar]
- 16.Lee YS, et al. Inflammation is necessary for long-term but not short-term high-fat diet-induced insulin resistance. Diabetes 60, 2474–2483 (2011). [DOI] [PMC free article] [PubMed] [Google Scholar]
- 17.Lee YS, et al. Increased adipocyte O2 consumption triggers HIF-1alpha, causing inflammation and insulin resistance in obesity. Cell 157, 1339–1352 (2014). [DOI] [PMC free article] [PubMed] [Google Scholar]
- 18.Halberg N, et al. Hypoxia-inducible factor 1alpha induces fibrosis and insulin resistance in white adipose tissue. Mol Cell Biol 29, 4467–4483 (2009). [DOI] [PMC free article] [PubMed] [Google Scholar]
- 19.Hosogai N, et al. Adipose tissue hypoxia in obesity and its impact on adipocytokine dysregulation. Diabetes 56, 901–911 (2007). [DOI] [PubMed] [Google Scholar]
- 20.Palazon A, Goldrath AW, Nizet V & Johnson RS HIF transcription factors, inflammation, and immunity. Immunity 41, 518–528 (2014). [DOI] [PMC free article] [PubMed] [Google Scholar]
- 21.Jiang C, et al. Disruption of hypoxia-inducible factor 1 in adipocytes improves insulin sensitivity and decreases adiposity in high-fat diet-fed mice. Diabetes 60, 2484–2495 (2011). [DOI] [PMC free article] [PubMed] [Google Scholar]
- 22.Lee KY, Gesta S, Boucher J, Wang XL & Kahn CR The differential role of Hif1beta/Arnt and the hypoxic response in adipose function, fibrosis, and inflammation. Cell Metab 14, 491–503 (2011). [DOI] [PMC free article] [PubMed] [Google Scholar]
- 23.Gealekman O, et al. Depot-specific differences and insufficient subcutaneous adipose tissue angiogenesis in human obesity. Circulation 123, 186–194 (2011). [DOI] [PMC free article] [PubMed] [Google Scholar]
- 24.Cao Y Angiogenesis and vascular functions in modulation of obesity, adipose metabolism, and insulin sensitivity. Cell Metab 18, 478–489 (2013). [DOI] [PubMed] [Google Scholar]
- 25.Sun K, Halberg N, Khan M, Magalang UJ & Scherer PE Selective inhibition of hypoxia-inducible factor 1alpha ameliorates adipose tissue dysfunction. Mol Cell Biol 33, 904–917 (2013). [DOI] [PMC free article] [PubMed] [Google Scholar]
- 26.Pasarica M, et al. Reduced adipose tissue oxygenation in human obesity: evidence for rarefaction, macrophage chemotaxis, and inflammation without an angiogenic response. Diabetes 58, 718–725 (2009). [DOI] [PMC free article] [PubMed] [Google Scholar]
- 27.Keith B, Johnson RS & Simon MC HIF1alpha and HIF2alpha: sibling rivalry in hypoxic tumour growth and progression. Nat Rev Cancer 12, 9–22 (2011). [DOI] [PMC free article] [PubMed] [Google Scholar]
- 28.Lumeng CN, Bodzin JL & Saltiel AR Obesity induces a phenotypic switch in adipose tissue macrophage polarization. J Clin Invest 117, 175–184 (2007). [DOI] [PMC free article] [PubMed] [Google Scholar]
- 29.Amano SU, et al. Local proliferation of macrophages contributes to obesity-associated adipose tissue inflammation. Cell Metab 19, 162–171 (2014). [DOI] [PMC free article] [PubMed] [Google Scholar]
- 30.Haase J, et al. Local proliferation of macrophages in adipose tissue during obesity-induced inflammation. Diabetologia 57, 562–571 (2014). [DOI] [PubMed] [Google Scholar]
- 31.Regula KM, Ens K & Kirshenbaum LA Inducible expression of BNIP3 provokes mitochondrial defects and hypoxia-mediated cell death of ventricular myocytes. Circ Res 91, 226–231 (2002). [DOI] [PubMed] [Google Scholar]
- 32.Kubli DA, Ycaza JE & Gustafsson AB Bnip3 mediates mitochondrial dysfunction and cell death through Bax and Bak. Biochem J 405, 407–415 (2007). [DOI] [PMC free article] [PubMed] [Google Scholar]
- 33.Vande Velde C, et al. BNIP3 and genetic control of necrosis-like cell death through the mitochondrial permeability transition pore. Mol Cell Biol 20, 5454–5468 (2000). [DOI] [PMC free article] [PubMed] [Google Scholar]
- 34.Chavez JA & Summers SA A ceramide-centric view of insulin resistance. Cell Metab 15, 585–594 (2012). [DOI] [PubMed] [Google Scholar]
- 35.Holland WL, et al. Receptor-mediated activation of ceramidase activity initiates the pleiotropic actions of adiponectin. Nat Med 17, 55–63 (2011). [DOI] [PMC free article] [PubMed] [Google Scholar]
- 36.Andreyev A, et al. The ATP/ADP-antiporter is involved in the uncoupling effect of fatty acids on mitochondria. Eur J Biochem 182, 585–592 (1989). [DOI] [PubMed] [Google Scholar]
- 37.Fabbrini E, et al. Metabolically normal obese people are protected from adverse effects following weight gain. J Clin Invest 125, 787–795 (2015). [DOI] [PMC free article] [PubMed] [Google Scholar]
- 38.McLaughlin T, et al. Subcutaneous adipose cell size and distribution: relationship to insulin resistance and body fat. Obesity (Silver Spring) 22, 673–680 (2014). [DOI] [PMC free article] [PubMed] [Google Scholar]
- 39.Kolehmainen M, Vidal H, Alhava E & Uusitupa MI Sterol regulatory element binding protein 1c (SREBP-1c) expression in human obesity. Obes Res 9, 706–712 (2001). [DOI] [PubMed] [Google Scholar]
- 40.Pasarica M, et al. Reduced oxygenation in human obese adipose tissue is associated with impaired insulin suppression of lipolysis. J Clin Endocrinol Metab 95, 4052–4055 (2010). [DOI] [PMC free article] [PubMed] [Google Scholar]
- 41.Li P, et al. Adipocyte NCoR knockout decreases PPARgamma phosphorylation and enhances PPARgamma activity and insulin sensitivity. Cell 147, 815–826 (2011). [DOI] [PMC free article] [PubMed] [Google Scholar]
- 42.Kusminski CM, et al. MitoNEET-driven alterations in adipocyte mitochondrial activity reveal a crucial adaptive process that preserves insulin sensitivity in obesity. Nat Med 18, 1539–1549 (2012). [DOI] [PMC free article] [PubMed] [Google Scholar]
- 43.Kim JY, et al. Obesity-associated improvements in metabolic profile through expansion of adipose tissue. J Clin Invest 117, 2621–2637 (2007). [DOI] [PMC free article] [PubMed] [Google Scholar]
- 44.Liu Y & Chen XJ Adenine nucleotide translocase, mitochondrial stress, and degenerative cell death. Oxid Med Cell Longev 2013, 146860 (2013). [DOI] [PMC free article] [PubMed] [Google Scholar]
- 45.Shabalina IG, Kramarova TV, Nedergaard J & Cannon B Carboxyatractyloside effects on brown-fat mitochondria imply that the adenine nucleotide translocator isoforms ANT1 and ANT2 may be responsible for basal and fatty-acid-induced uncoupling respectively. Biochem J 399, 405–414 (2006). [DOI] [PMC free article] [PubMed] [Google Scholar]
- 46.Cho J, et al. Mitochondrial ATP transporter depletion protects mice against liver steatosis and insulin resistance. Nat Commun 8, 14477 (2017). [DOI] [PMC free article] [PubMed] [Google Scholar]
- 47.Kokoszka JE, et al. The ADP/ATP translocator is not essential for the mitochondrial permeability transition pore. Nature 427, 461–465 (2004). [DOI] [PMC free article] [PubMed] [Google Scholar]
- 48.Seo JB, et al. Activated liver X receptors stimulate adipocyte differentiation through induction of peroxisome proliferator-activated receptor gamma expression. Mol Cell Biol 24, 3430–3444 (2004). [DOI] [PMC free article] [PubMed] [Google Scholar]
- 49.Farrall AL & Whitelaw ML The HIF1alpha-inducible pro-cell death gene BNIP3 is a novel target of SIM2s repression through cross-talk on the hypoxia response element. Oncogene 28, 3671–3680 (2009). [DOI] [PubMed] [Google Scholar]
Associated Data
This section collects any data citations, data availability statements, or supplementary materials included in this article.
Supplementary Materials
Data Availability Statement
All data that support the findings of this study are included in the paper or its supplementary information.