Abstract
Background.
Non-ulcer dyspepsia (NUD) is a heterogeneous disorder, which is characterized by upper gastrointestinal symptoms and sensorimotor disturbances, including abnormal gastric emptying (GE) and increased intestinal chemosensitivity, and associated with greater plasma glucagon-like peptide-1 (GLP-1) levels during duodenal lipid infusion. However, the relationship(s) between these disturbances and daily symptoms in NUD is variable. We hypothesize that abnormal GE, symptoms during a GE study and during duodenal lipid infusion are associated with daily symptoms and that GLP-1 mediates symptoms during duodenal lipid infusion in NUD.
Methods.
GE of solids, symptoms during the GE study and duodenal lipid infusion, and daily gastrointestinal symptoms (2 week diary) were measured in 24 healthy controls and 40 NUD patients. During duodenal lipid infusion, participants received the GLP-1 antagonist exendin 9–39 or placebo.
Key Results.
In controls and patients, GE of solids was normal in 75% and 75%, delayed in 8% and 12.5%, or rapid in 17% and 12.5%, respectively. No controls but 26 patients (65%) had severe symptoms during the GE study. During lipid infusion, gastrointestinal symptoms were greater (P=0.001) in patients and not affected by exendin. Symptoms during GE study and lipid infusion accounted for respectively 62% and 37% of variance in daily symptom severity.
Conclusions.
In NUD, symptoms during a GE study and to a lesser extent during lipid infusion explain the variance in daily symptoms. Intestinal chemosensitivity is not reduced by GLP-1 antagonist. Assessment of symptoms during a GE study may provide a useful biomarker for NUD in research and clinical practice. ClinicalTrials.gov number
Keywords: gastroparesis, QOL, PAGI, pathophysiology
Graphical abstract
Abbreviated abstract:
During a gastric emptying study, 65% of non-ulcer dyspepsia patients had severe symptoms, which explained a substantial proportion (62%) of variance in daily symptoms among these patients
Enteral chemosensitivity, which is assessed by evaluating symptoms during duodenal lipid infusion, was also greater in non-ulcer dyspepsia than controls. However, this was less useful than symptoms during a GE study for explaining the severity of daily symptoms in non-ulcer dyspepsia.
Introduction
Non-ulcer dyspepsia (NUD), which affects between 5–11% of the adult population, is defined by upper gastrointestinal symptoms, often related to eating.(1) Between 20% and 50% of patients with NUD have abnormal, often delayed, gastric emptying (GE).(2, 3) However, the relationship between delayed GE and symptoms varies among studies. (4, 5)
Consensus guidelines recommend recording any symptoms that patients experience during the GE scintigraphy and comparing those symptoms with daily symptoms.(6) However, it is our impression that few centers adhere to this guideline. In one study of 409 patients with NUD, more severe symptoms during a GE study were associated with more severe daily symptoms.(7) Because the correlation between symptoms during a GE study and daily symptoms was evaluated on a continuous scale, it is unclear if symptoms that exceed a certain threshold (eg, severe symptoms) predict the severity of daily symptoms or the dyspepsia-related quality of life.
NUD is associated with abnormal gastric emptying, impaired gastric accommodation, increased gastric sensitivity,(1) and with increased enteral chemosensitivity. Approximately 60% of NUD patients but only 10% of healthy controls reported moderate, severe, or intolerable symptoms, suggestive of increased enteral chemosensitivity, during duodenal carbohydrate and lipid infusions (300 kcal).(8) Moreover, the rate of nutrient delivery to the small intestine also determines the hormonal response.(9) Increased enteral chemosensitivity is associated with more severe daily symptoms. However, the etiology of enteral chemosensitivity in NUD is unknown. During duodenal lipid infusion, the area under the curve for plasma glucagon-like peptide-1 (GLP-1) and concentrations was greater in patients than controls and also greater in participants (i.e. controls and patients) with more severe symptoms.(8) The median AUC (IQ range) for plasma GLP-1 concentrations was 2,730 (2,073–3,466) pmol/l * minute in patients with versus 1,564 (1,016–2904) pmol/l * minute in participants without severe symptoms during the duodenal lipid infusion. In another study, the severity of postprandial nausea after a liquid meal was correlated with the plasma GLP-1 concentrations in NUD.(10) Since GLP-1, which is released from enteroendocrine cells in response to nutrient intake, induces nausea and satiety by vagally-mediated mechanisms,(11) it is conceivable that GLP-1 contributes to enteral chemosensitivity in NUD.
Hence, the aims of this study were to: (i) compare GE, symptoms during a GE study, and sensitivity to duodenal nutrient infusion in NUD and healthy controls (ii) evaluate if gastrointestinal sensorimotor dysfunctions can predict day-to-day symptoms and QOL, and (iii) evaluate the contribution of GLP-1 to intestinal chemosensitivity in NUD
Methods
Study Participants
Twenty four healthy asymptomatic persons (mean [standard error] [SE] age, 40 [3] years; 14 women) with a body mass index (BMI) of 26.1 (1.0) kg/m2 and 40 patients with non-organic postprandial upper gastrointestinal symptoms consistent with dyspepsia (age, 42 [2] years; 31 women) with a BMI of 26.7 (1.04) kg/m2 were studied (Table 1). The main exclusion criteria were age <18 or >70 years; another condition or gastrointestinal structural disorder that may cause gastrointestinal symptoms; diabetes mellitus; clinically significant non-gastrointestinal diseases that may interfere with study objectives or pose safety concerns; GI surgery other than appendectomy or cholecystectomy; or medications (eg, opioids, metoclopramide, or erythromycin) that affect GI motility. In addition, controls did not have any Rome III criteria for a functional gastrointestinal disorder. Women of child-bearing potential had a negative pregnancy test within 48 hours of study participation. The study was approved by the Mayo Clinic Institutional Review Board, registered on clinicaltrials.gov (), and conducted between June 2014 and May 2017 at Mayo Clinic, Rochester, MN. All participants signed informed consent. All authors had access to the study data reviewed and approved the final manuscript.
Table 1.
Demographic and baseline clinical characteristics
| Characteristic | Controlsa (n=24) | NUDa (n=40) |
|---|---|---|
| Age, y | 40 (3) | 42 (2) |
| BMI, kg/m2 | 26.1 (1.0) | 26.7 (1.04) |
| Female sex, No. (%) | 14 (58) | 31 (78) |
| Borderline, definite anxiety, No. | 0, 0 | 7, 11* |
| Borderline, definite depression, No. | 0, 0 | 8, 3* |
| Mean NDI dyspepsia symptom severity score, median (IQR) | 12.95 (12.5, 13.0) | 10.78 (10.03, 11.41)* |
| Mean NDI QOL score, median (IQR) | 100 (100,100) | 41.28 (18.6, 62.1)* |
| PAGI-SYM subscores, median (IQR) | ||
| Heartburn subscore | 0 (0, 0.14) | 1.9 (1.1, 2.6)* |
| Nausea, vomiting and regurgitation subscore | 0 (0, 0) | 1 (0.3,2.3)* |
| Early satiety subscore | 0 (0, 0.3) | 3.1 (2.5, 4)* |
| Bloating subscore | 0 (0, 0.13) | 3.5 (2.5, 4.6)* |
| Upper abdominal pain subscore | 0 (0, 0) | 3.5 (2.4, 4)* |
| GE t½ (minutes) | 103.8 (6.6) | 122.6 (5.5)* |
| Colonic filling at 6 hours (%) | 56 (4) | 40 (3)* |
| Cholecystectomy (n) | 0 | 18 |
| Appendectomy (n) | 0 | 11 |
Abbreviations: BMI, body mass index; HADS, Hospital Anxiety and Depression Scale; IQR, interquartile range; NDI, Nepean Dyspepsia Index; QOL, quality of life; GE, GE; SEM, standard error of mean; PAGI-SYM, Patient Assessment of Upper Gastrointestinal Disorders-Symptom Severity.
Values are presented as mean (SEM) unless specified otherwise;
P<0.05
Assessment of Symptoms
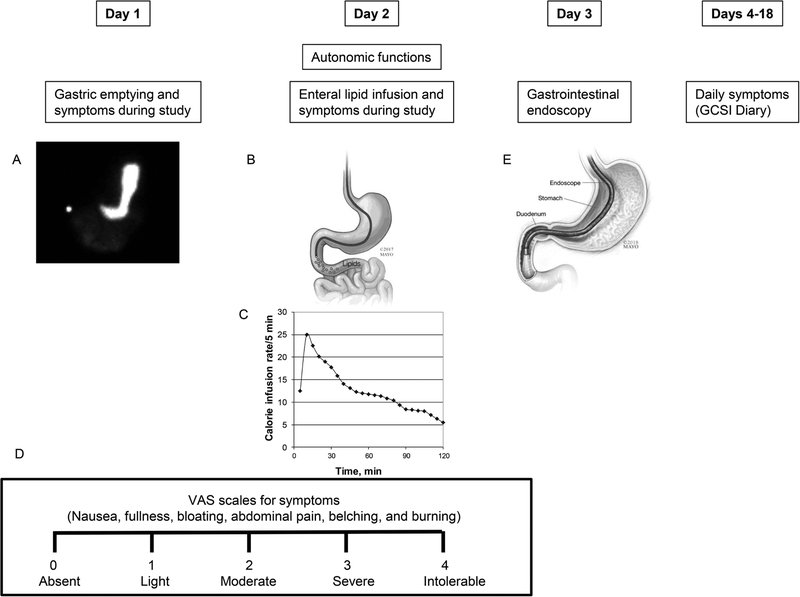
Baseline symptoms were evaluated with the Nepean Dyspepsia Index and the Hospital Anxiety and Depression Scale (HADS) questionnaires questionnaire.(12–14) Gastrointestinal symptoms over the preceding 2 weeks were evaluated using the Patient Assessment of Upper Gastrointestinal Disorders-Symptom Severity (PAGI-SYM) index and summarized as subscores.(15) After completing objective assessments, patients recorded their daily GI symptoms in the Gastroparesis Cardinal Symptom Index-Daily Diary (GCSI-DD) for 2 weeks (Figure 1).(16, 17) The nausea, vomiting, fullness, and pain (NVFP) scores were computed by averaging these 4 symptoms.(18)
Figure 1.
Study design. GE scintigraphy (panel A), duodenal lipid infusion (panel B) at a variable rate (panel C), and gastrointestinal endoscopy (panel E) were performed over 3 days. Symptoms during the GE study and lipid infusion were assessed with VAS scales (panel D). Thereafter, participants recorded their symptoms daily for 2 weeks.
Gastric and Small-Bowel Transit
GE of solids and liquids (296 kcal; 32% protein, 35% fat, and 33% carbohydrate) and small-bowel transit were simultaneously assessed with scintigraphy.(8) Rapid and delayed emptying were defined as ≥ 36% emptied at 1h, and < 76% emptied at 4h respectively.(19) Small-bowel transit time (SBTT) was calculated by the percentage of 99mTc (technetium) in the colon at 6 hours. Because the rate of colonic filling is also influenced by gastric emptying, this is a surrogate measure of small-bowel transit.(20)
Duodenal Nutrient Infusion
This was administered through a nasoduodenal feeding tube placed under fluoroscopic guidance with the tip in the second part of the duodenum (Figure 1).(8) The lipid infusion (Microlipid; Covidien AG) (66.7 mL diluted to 222 mL, for 0.5 g/mL, 300 kcal) was administered over 2 hours at a rate which mimicked the systemic delivery of glucose after glucose ingestion. The infusion started at 12.5 kcal/5 minutes, increased to a peak rate of 24.9 kcal/5 minutes at 5 minutes after the infusion was started, and declined thereafter to a nadir of 5.47 kcal/5 minutes just before the infusion ended. As previously described,(8, 21) the duodenal lipid dosing regimen was designed to administer calories at a rate that mimics the systemic delivery of glucose after glucose ingestion.(22–24)
Exendin 9–39
Participants were randomized in a double-blind, placebo-controlled, parallel-group design to receive placebo or the GLP-1 antagonist exendin 9–39 (C.S. Bio, Menlo Park, Ca) in a ratio of 1:1 during the duodenal lipid infusion. Under the aegis of an investigator-initiated IND 122276 from the Food and Drug Administration, the exendin 9–39 was administered intravenously as a bolus (1,200 pmol/kg) followed by infusion at 300 pmol/kg/min throughout the lipid infusion.(25) This dose blocks the effects of GLP-1 infused at supraphysiologic doses and the effects of endogenous GLP-1 on gastrointestinal motility and insulin secretion.(26)
Symptoms during GE Study and Duodenal Lipid Infusion
Participants rated the severity of 6 symptoms—nausea, fullness, bloating, abdominal pain, belching, and burning—at 15-minute intervals on a Visual Analog Score scale marked absent(0), light(1), moderate(2), severe(3) and intolerable(4) (Figure 1D).(8) Data were analyzed as: (i) the mean symptom score, which was the average scores for nausea, fullness, bloating, and abdominal pain over the 2 hour infusion and (ii) the proportion of participants with “severe” or “intolerable” symptoms.
Plasma GLP-1 levels
Blood samples for plasma GLP-1 were collected every 5-minutes for 30 minutes, every 10-minutes from 30 to 60 minutes, and every 15-minutes from 60 to 120 minutes. Arterialized venous plasma samples were obtained from a retrograde hand or forearm vein and were placed in a Perspex hot box heated to 55°C. Samples were placed in ice, centrifuged at 4°C, separated, stored at −20°C and evaluate with a GLP1 enzyme-linked immunosorbent assay (ELISA) (Linco Research Inc) that measures biologically active GLP-1 (7–36 amide, 7–37) levels with no cross-reactivity to GLP-1-(9–36) amide, GLP-2, or glucagon.
Upper gastrointestinal endoscopy
The same investigator (AEB) performed an upper gastrointestinal endoscopy in all participants.
Study End Points
The mean symptom score during the duodenal lipid infusion was the primary outcome of the effects of the exendin 9–39. The other outcome variables were: GE t½, mean symptom score during the GE scintigraphy, NVFP score calculated from GCSI-DD, PAGI-SYM subscores, and QOL score computed from Nepean Dyspepsia Index questionnaire.
Sample Size and Statistical Analysis
In our previous study, 56% of NUD patients reported severe symptoms during duodenal lipid infusion.(8) Hence, the sample size of 40 patients and 24 controls provided 80% power to detect an absolute difference of 38% between the prevalence of symptoms in NUD patients treated with placebo and exendin 9–39 (for example, 18% versus 56%).
An EXCEL spreadsheet of treatment assignments (balanced on sex and GE using a block size of 4), was generated (ARZ) by computer and sent to the research pharmacy. Study personnel were blinded until the study was completed.
All analyses used SAS® software (version 9.3, Cary NC) and continuous data are reported as mean ± SEM while discrete data as frequencies (%). The associations between symptoms during nutrient infusion and participant status were evaluated with Fisher exact test. An analysis of covariance compared symptoms during duodenal lipid infusion and exendin’s effects between controls and patients. Multiple linear regression models assessed the extent to which GE and symptoms during the GE scintigraphy predicted (i) daily symptoms summarized by the NVFP score (18) and (ii) overall quality of life calculated from the Nepean Dyspepsia Index questionnaire.
Results
Participants, Study Conduct, and Completion
The sex distribution, BMI, and age were not significantly different between controls and patients. GE was evaluated in all 64 participants. A nasoduodenal tube could not be placed in 3 controls and 5 patients (Supplementary Figure 1). Of 21 controls and 35 patients who received the duodenal infusion, the infusion was terminated prematurely because of gastrointestinal symptoms in 1 control and 8 patients. All these patients reported severe symptoms before the infusion was stopped. Sixteen, 3, 8, 5, and 5 patients were on proton pump inhibitors, tricyclic antidepressants, selective serotonin reuptake inhibitors, serotonergic agents and gabaminergic agents (pregabalin and gabapentin) respectively. Fourteen patients were taking tricyclic antidepressants and/or a serotonergic agent (including SSRIs). A total of three patients were taking TCAs, of whom 2 were also on SSRIs. The gabaminergic agents were discontinued for 4 half-lives before the study. None of the patients were taking iberogast. Supplementary Table 1 provides all drugs being taken by participants. Eighteen patients but no controls had a cholecystectomy; 11 patients but no controls had an appendectomy.
Clinical Features
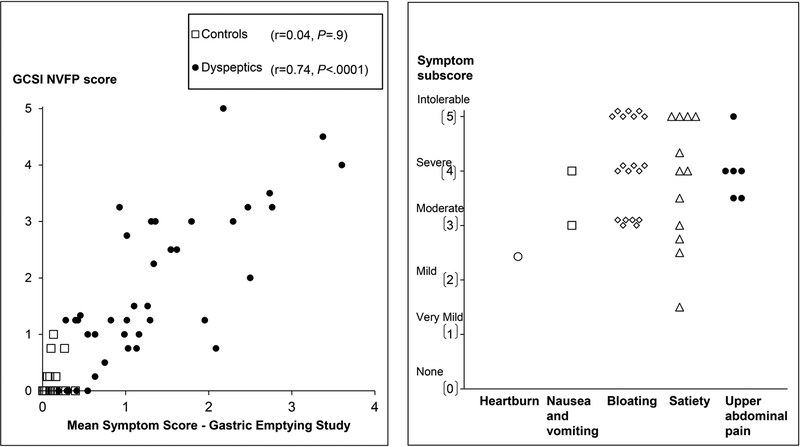
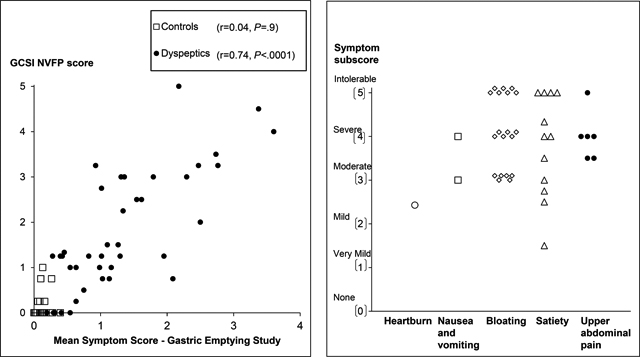
In 39 of 40 patients, the PAGI-SYM questionnaire disclosed a score of two or greater (i.e., moderately-severe symptoms or worse) for at least one PAGI subscore (i.e., satiety, nausea and vomiting, bloating, or upper abdominal pain) (Figure 2). While Figure 2 shows the highest subscore in each patient, many patients had several upper gastrointestinal symptoms. For example, 22 patients had more than two moderate, severe, or intolerable symptoms. Thirty two patients satisfied Rome III criteria for functional dyspepsia. The upper gastrointestinal endoscopy was normal or disclosed cystic fundic gland polyps (32 patients and 14 controls), antral erythema or minor erosions that were not deemed sufficient to explain symptoms (6 patients and 4 controls) and mild esophagitis (1 patient and 3 controls). One patient and three controls did not have an upper endoscopy. Eight patients had definite anxiety only. In addition, 3 patients had definite depression and anxiety.
Figure 2.
Left panel. Relationship between symptoms during the GE study and the GCSI NVFP score in all participants (controls and NUD). Right panel. Scores for the most severe PAGI symptom subscore in each patient.
GE and Small-Bowel Transit
GE of solids was normal in 18 controls (75%) and 30 patients (75%). Two controls (8%) and 5 patients (12.5%) had delayed GE while 4 controls (17%) and 5 patients (12.5%) had rapid emptying of solids. GE of liquids was normal in 20 controls (83%) and 39 patients (98%). Four controls had borderline accelerated GE of liquids. Colonic filling at 6h was lower (P<0.05) in patients than in controls, reflecting delayed small bowel transit (Table 1).
Symptoms during GE Study
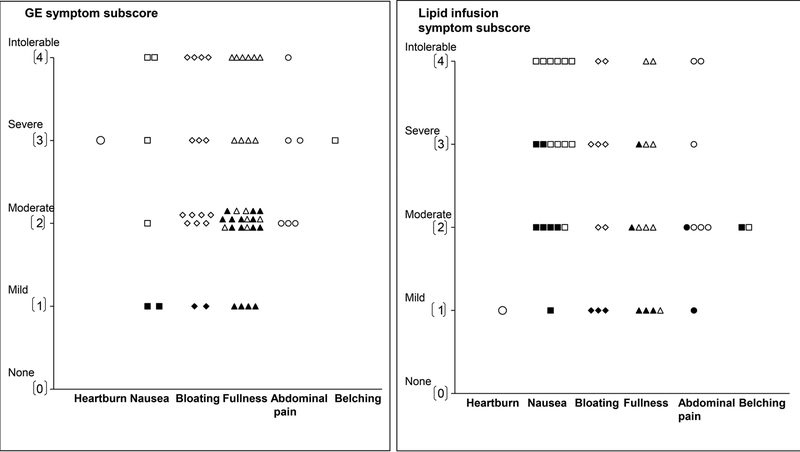
During the GE scintigraphy, no controls but 26 of 40 patients (65%) (P<0.0001), reported one or more “severe” or “intolerable” symptoms (i.e., fullness (11 patients), bloating (11 patients), nausea (17 patients), abdominal pain (13 patients), and heartburn (3 patients). Among patients with severe symptoms, 4 reported only one severe symptom. The remaining patients reported two (11 patients), three or more severe symptoms (11 patients). The most severe symptoms during scintigraphy are depicted in Figure 3 (left panel). Among these patients, 20 had normal, 2 had rapid, and 4 had delayed GE. The mean symptom scores during the GE scintigraphy and duodenal infusion were correlated (r=0.69, P<0.0001). Of 14 patients who were taking tricyclic antidepressants or serotonergic agents, 10 and 8 respectively had severe symptoms during the GE scintigraphy and duodenal lipid infusion.
Figure 3.
Scores for the most severe symptoms during the gastric emptying study (left panel) and duodenal lipid infusion (right panel). Filled symbols depict controls and open symbols depict patients. Among patients in whom the highest subscore was recorded for two or more symptoms, only one symptom is shown in the figure. No controls had severe or intolerable symptoms during the GE study.
Duodenal Nutrient Infusion
Of 27 women and 8 men with NUD who received duodenal lipid infusion, 13 women and 4 men were randomized to exendin 9–39. Among dyspeptic patients, the HADS anxiety and depression scores, severity of daily symptoms, and GE t½ were not significantly different between patients randomized to exendin 9–39 and placebo.
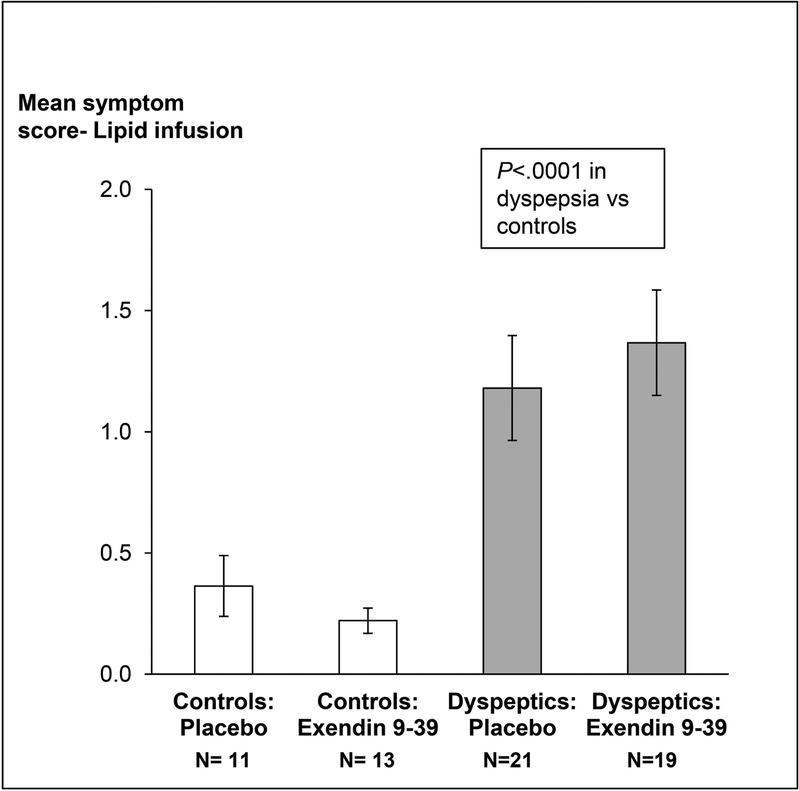
Twelve of 21 controls and 17 of 35 patients received exendin 9–39 during lipid infusion. Twenty two patients (63%) and 3 controls reported at least 1 symptom of “severe” or “intolerable” intensity during lipid infusion (P=0.001). The most severe symptoms during lipid infusion are depicted in Figure 3 (right panel). These patients had normal (n=15), delayed (n=4) or rapid (n=3) GE. Of these, 11 patients and 2 controls received exendin 9–39. The effects of exendin 9–39 on symptoms were not significant (P=0.77). After adjusting for treatment, the mean GI symptom score during lipid infusion was greater (P<0.0001) in NUD than in controls (Figure 4). Only 2 patients with severe symptoms during lipid infusion had borderline anxiety. None had definite anxiety.
Figure 4.
Comparison of symptoms during duodenal lipid infusion in controls and non-ulcer dyspepsia. Data are Mean ± SEM
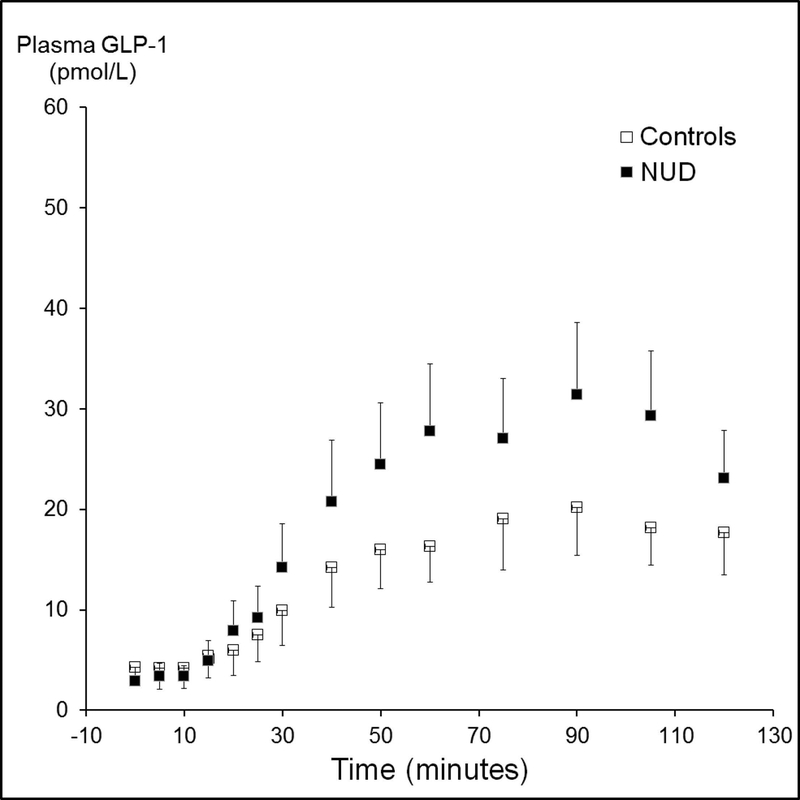
The mean [95% CI] plasma GLP-1 concentrations (AUC) were not significantly different between treatment groups in NUD (2666 ± 353 [exendin] versus 2653 ± 306 pmol/L*min [placebo]) and separately in controls (1542 ± 170 [exendin] versus 2270 ± 516 pmol/L*min [placebo]). However, the mean [95% CI] plasma GLP-1 concentrations were greater (P<0.01) in patients with NUD (2659 ± 230 pmol/L*min) than controls (1854 ± 247 pmol/L*min) (Figure 5). Among controls, the plasma GLP-1 concentrations were correlated (r=0.64, P=0.002) with the severity of nausea during lipid infusion in controls. GLP-1 levels were not correlated with the severity of other symptoms or the mean symptom severity score in NUD patients or controls.
Figure 5.
Comparison of plasma GLP-1 concentrations during lipid infusion in controls and patients. The overall plasma concentration (AUC over 2 hours) was greater (P<0.01) in non-ulcer dyspepsia than controls. Data are Mean ± SEM.
Factors associated with Daily Symptom Severity and QOL
The severity of the most severe symptom, as calculated by the average subscore from the PAGI-SYM questionnaire, was very mild (PAGI-SYM score of 1–1.99, 2 patients), mild (2–2.99, 3 patients), moderate (3–3.99, 10 patients), severe (4–4.99, 13 patients) or very severe (5, 12 patients). Figure 2 provides the scores for the most severe symptom subscore in each participant.
Among NUD patients but not controls, the mean symptom score during GE strongly was correlated with the GCSI NVFP score (r=0.74, P<0.0001) (Figure 2). In the univariate analysis, the HAD depression score explained 20% (P<0.02), mean symptom score during the GE scintigraphy explained 64% (P<0.0001), and the mean symptom score during the lipid infusion explained 39% (P<0.001) of the variation in daily symptom severity in patients with NUD; the GE t½ was not significant.
In the multivariate model (Table 2), the GE t½ and mean symptom score during GE study together explained 62% (P=0.0001) of the variance in daily symptom severity in NUD. By comparison, the GE t½ and mean symptom score during lipid infusion together explained 37% (P=0.002) of the variance in daily symptom severity in NUD. The depression score did not augment the utility of these models. Among all participants, the GE t½ and mean symptom score during GE study explained 79% (P<0.0001) of the variance in symptoms. While symptoms during duodenal lipid infusion were significant in the corresponding univariate analysis (R2= 0.57, P<0.0001), they did not augment the utility of the GE t½ in this multivariate model.
Table 2.
Multivariable linear regression models for predicting symptoms and quality of life in NUD a
| Daily Symptoms | Daily QOL | |||
|---|---|---|---|---|
| NUD | Controls and NUD | NUD | Controls and NUD | |
| GE t½ | 0.02 (0.49) | 0.02 (0.39) | 0.06 (0.17) | 0.03 (0.3) |
| Mean symptom score during GE studyb | 0.61 (<0.0001) | 0.78 (<0.0001) | 0.19 (0.01) | 0.2 (0.0008) |
| Mean symptom score during duodenal lipid infusionb | 0.002 (0.83) | 0.14 (0.006) | ||
| Depression score | 0.31 (0.001) | 0.42 (<0.0001) | ||
| Total variance explained (%) | 62% (0.0001) | 79% (<0.0001) | 40% (0.0005) | 68% (<0.0001) |
Unless stated otherwise, data are partial R2 (p values) values
For QOL models, the mean symptom score was replaced with the presence of any severe symptom
NA – Not applicable
In NUD, the mean symptom score during the GE scintigraphy explained 19% (P=0.003) of the variance in QOL. The mean symptom score during the GE scintigraphy and lipid infusion and the GE t½ explained 17% variance in QOL in NUD (P=0.03). The depression score explained 30% of variance in QOL in dyspeptics (P=0.0001). Taken together, these variables explained 40% (P=0.0005) of the variance in QOL among dyspeptics and 68% (P<0.0001) of the variance among controls and dyspeptics. The anxiety score did not predict the severity of daily symptoms or QOL in NUD (data not shown).
Discussion
Among patients with NUD, we found that the severity of symptoms during a GE study and to a lesser extent duodenal lipid infusion are comparable to the daily symptoms experienced by patients. This suggests that an assessment of symptoms during a GE study may serve as a biomarker for NUD in research as well as in clinical practice. Thus, in this cohort of NUD patients with a variety of upper gastrointestinal symptoms that were mild, moderate, or severe, 75% of patients had normal, 12.5% had delayed, and 12.5% had rapid GE. The GE was not correlated with the severity of daily symptoms in this and as in previous studies.(4, 27) However, a more recent analysis of the literature identified a significant association between gastric emptying, when measured optimally, and symptoms.(28) Among therapeutic trials in NUD that utilized optimal techniques to measure GE, the drug-related improvement in symptoms and acceleration of GE were correlated.(28) Moreover, after a 296 kcal meal, 65% of patients (i.e., 67% with normal, 80% with delayed, and 40 % with rapid GE) but no asymptomatic controls reported “severe” or “intolerable” symptoms of NUD. The severity of symptoms during a GE study explained 62% of the variance in daily symptoms among patients with NUD and nearly 79% of the corresponding variance among controls and NUD. These observations, which extend a previous study,(7) raise the intriguing possibility that the acute effects of drugs on symptoms during the GE scintigraphy may predict their effects on daily symptoms. Hence, the response to a pharmacological challenge may facilitate the selection of drugs for therapeutic trials and also enable individualized therapy in patients with NUD. To our knowledge, there is no biomarker that facilitates individualized therapy in patients with functional disorders of the upper gastrointestinal tract. In the lower gastrointestinal tract, the acute effects of atropine predicted the long term effects of clonidine on rectal sensorimotor functions in fecal incontinence (29) while the acute effects of neostigmine predicted the response to pyridostigmine on colonic transit in patients with autonomic neuropathy and constipation.(30)
The symptoms during a GE study may be explained by abnormal GE, decreased gastric accommodation, and increased gastric sensitivity.(1) In this study, the symptoms during the GE study and during duodenal lipid infusion were correlated, which suggests that the small intestine may also contribute to symptoms during a GE study. We previously observed that 58% of dyspeptic patients had moderately-severe or more intense symptoms during duodenal lipid infusion.(8) In this different patient cohort, 63% of patients (ie, 50% with normal, 80% with delayed and 60% with rapid GE) but only 13% of controls had severe or intolerable symptoms. By comparison to symptoms during a GE study, enteral chemosensitivity explained a smaller proportion of the variance in daily symptoms. As shown previously, anxiety and depression were associated with daily symptom severity (31) but did not augment the utility of symptoms during the GE scintigraphy for discriminating between controls and NUD, perhaps because the symptoms during a GE study are also influenced by anxiety and depression.
In NUD, plasma GLP-1 concentrations were correlated with the severity of symptoms during duodenal lipid infusion (8) and after a liquid meal.(10) By contrast, in this study, the plasma GLP-1 concentrations were correlated with the severity of nausea only in controls but not in NUD patients. While plasma GLP-1 concentrations were variable in patients and in controls, they were significantly higher in NUD than controls. Similarly, we observed that a subset of patients with NUD had higher plasma GLP-1 concentrations during duodenal lipid infusion.(8) However, the GLP-1 antagonist exendin 9–39, which was administered at a dose sufficient to block the effects of endogenous GLP-1 on gastrointestinal motility,(26) did not reduce gastrointestinal symptoms. This suggests that GLP-1 does not contribute substantially to symptoms during enteral nutrient infusion.
This study had some limitations. Further studies are necessary to ascertain whether there is a correlation between drug-induced improvements in symptoms during a gastric emptying study and daily symptoms. Symptoms were evaluated with NDI and GCSI instruments that evaluate similar symptoms as the Leuven Postprandial Distress Scale.(32) Gastric accommodation and sensitivity were not assessed.(1)
In summary, severe symptoms during the GE scintigraphy explained respectively 62% and 40% of the variance in daily symptom severity and QOL in NUD. The symptoms during a GE study may provide a biomarker of NUD. In order to confirm the utility of this biomarker, further studies should ascertain if the effects of medication(s) on symptoms during a GE study predict drug effects on daily symptoms.
Supplementary Material
Key points.
During a gastric emptying study, 65% of non-ulcer dyspepsia patients had severe symptoms, which explained a substantial proportion (62%) of variance in daily symptoms among these patients.
Enteral chemosensitivity, which is assessed by evaluating symptoms during duodenal lipid infusion, was greater in non-ulcer dyspepsia, and together with the gastric emptying half time, explained 37% of the variance in the severity of daily symptoms in non-ulcer dyspepsia. Enteral chemosensitivity was not reduced by the GLP-1 antagonist exendin 9–39.
Symptoms during a gastric emptying study may provide a biomarker of non-ulcer dyspepsia.
ACKNOWLEDGEMENTS AND DISCLOSURES
Funding disclosure. This study was supported by US Public Health Service National Institutes of Health grant R01 DK68055. This project was supported by grant number UL1 TR000135 from the National Center for Advancing Translational Sciences. Its contents are solely the responsibility of the authors and do not necessarily represent the official views of the National Institutes of Health.
Abbreviations.
- NUD
non-ulcer dyspepsia
- GE
gastric emptying
- t½
time taken for 50% emptying
- GLP-1
glucagon-like peptide 1
- QOL
quality of life
- SEM
standard error of mean
- GCSI
Gastrointestinal Cardinal Symptom Index
- PAGI-SYM
Patient Assessment of Upper Gastrointestinal Disorders-Symptom Severity index; HAD, Hospital Anxiety and Depression
Footnotes
Conflicts of interest. None.
References
- 1.Koduru P, Irani M, Quigley EMM. Definition, Pathogenesis, and Management of That Cursed Dyspepsia. Clinical Gastroenterology & Hepatology 2018; 16: 467–479. [DOI] [PubMed] [Google Scholar]
- 2.Lacy BE. Functional dyspepsia and gastroparesis: one disease or two? Am J Gastroenterol 2012; 107: 1615–1620. [DOI] [PubMed] [Google Scholar]
- 3.Park SY, Acosta A, Camilleri M, et al. Gastric Motor Dysfunction in Patients With Functional Gastroduodenal Symptoms. Am J Gastroenterol 2017; 112: 1689–1699. [DOI] [PubMed] [Google Scholar]
- 4.Talley NJ. Editorial: Moving Away From Focussing on Gastric Pathophysiology in Functional Dyspepsia: New Insights and Therapeutic Implications. Am J Gastroenterol 2017; 112: 141–144. [DOI] [PubMed] [Google Scholar]
- 5.Vijayvargiya P, Jameie-Oskooei S, Camilleri M, Chedid V, Erwin PJ, Murad MH. Association between delayed gastric emptying and upper gastrointestinal symptoms: a systematic review and meta-analysis. Gut 2018; 02: 02. [DOI] [PubMed] [Google Scholar]
- 6.Donohoe KJ, Maurer AH, Ziessman HA, et al. Procedure guideline for adult solid-meal gastric-emptying study 3.0. J Nucl Med Technol 2009; 37: 196–200. [DOI] [PubMed] [Google Scholar]
- 7.Khayyam U, Sachdeva P, Gomez J, et al. Assessment of symptoms during gastric emptying scintigraphy to correlate symptoms to delayed gastric emptying. Neurogastroenterol Motil 2010; 22: 539–545. [DOI] [PMC free article] [PubMed] [Google Scholar]
- 8.Bharucha AE, Camilleri M, Burton DD, et al. Increased nutrient sensitivity and plasma concentrations of enteral hormones during duodenal nutrient infusion in functional dyspepsia. Am J Gastroenterol 2014; 109: 1910–1920. [DOI] [PMC free article] [PubMed] [Google Scholar]
- 9.Marathe CS, Rayner CK, Bound M, et al. Small Intestinal Glucose Exposure Determines the Magnitude of the Incretin Effect in Health and Type 2 Diabetes. Diabetes 2014; 63: 2668–2675. [DOI] [PubMed] [Google Scholar]
- 10.Witte AB, Hilsted L, Holst JJ, Schmidt PT. Peptide YY3–36 and glucagon-like peptide-1 in functional dyspepsia. Secretion and role in symptom generation. Scand J Gastroenterol 2016; 51: 400–409. [DOI] [PubMed] [Google Scholar]
- 11.Camilleri M Integrated upper gastrointestinal response to food intake. Gastroenterology 2006; 131: 640–658. [DOI] [PubMed] [Google Scholar]
- 12.Talley NJ, Haque M, Wyeth JW, et al. Development of a new dyspepsia impact scale: the Nepean Dyspepsia Index. Aliment Pharmacol Ther 1999; 13: 225–235. [DOI] [PubMed] [Google Scholar]
- 13.Talley NJ, Verlinden M, Jones M. Validity of a new quality of life scale for functional dyspepsia: a United States multicenter trial of the Nepean Dyspepsia Index. Am J Gastroenterol 1999; 94: 2390–2397. [DOI] [PubMed] [Google Scholar]
- 14.Zigmond A, Snaith R. The hospital anxiety and depression scale. Acta Psychiatr Scand 1983; 67: 361–370. [DOI] [PubMed] [Google Scholar]
- 15.Rentz AM, Kahrilas P, Stanghellini V, et al. Development and psychometric evaluation of the patient assessment of upper gastrointestinal symptom severity index (PAGI-SYM) in patients with upper gastrointestinal disorders. Qual Life Res 2004; 13: 1737–1749. [DOI] [PubMed] [Google Scholar]
- 16.Revicki DA, Camilleri M, Kuo B, et al. Development and content validity of a gastroparesis cardinal symptom index daily diary. Aliment Pharmacol Ther 2009; 30: 670–680. [DOI] [PubMed] [Google Scholar]
- 17.Revicki DA, Camilleri M, Kuo B, Szarka LA, McCormack J, Parkman HP. Evaluating symptom outcomes in gastroparesis clinical trials: validity and responsiveness of the Gastroparesis Cardinal Symptom Index-Daily Diary (GCSI-DD). Neurogastroenterol Motil 2012; 24: 456–463. [DOI] [PubMed] [Google Scholar]
- 18.Bharucha AE, Daley SL, Low PA, et al. Effects of hemin on heme oxygenase-1, gastric emptying, and symptoms in diabetic gastroparesis. Neurogastroenterol Motil 2016; 28: 1731–1740. [DOI] [PMC free article] [PubMed] [Google Scholar]
- 19.Camilleri M, Iturrino J, Bharucha AE, et al. Performance characteristics of scintigraphic measurement of gastric emptying of solids in healthy participants. Neurogastroenterol Motil 2012; 24: 1076–e1562. [DOI] [PMC free article] [PubMed] [Google Scholar]
- 20.Rao SSC, Camilleri M, Hasler WL, et al. Evaluation of gastrointestinal transit in clinical practice: position paper of the American and European Neurogastroenterology and Motility Societies. Neurogastroenterol Motil 2011; 23: 8–23. [DOI] [PubMed] [Google Scholar]
- 21.Alzaid AA, Dinneen SF, Turk DJ, Caumo A, Cobelli C, Rizza RA. Assessment of insulin action and glucose effectiveness in diabetic and nondiabetic humans. J Clin Invest 1994; 94: 2341–2348. [DOI] [PMC free article] [PubMed] [Google Scholar]
- 22.Firth RG, Bell PM, Marsh HM, Hansen I, Rizza RA. Postprandial hyperglycemia in patients with noninsulin-dependent diabetes mellitus. Role of hepatic and extrahepatic tissues. J Clin Invest 1986; 77: 1525–1532. [DOI] [PMC free article] [PubMed] [Google Scholar]
- 23.McMahon MM, Schwenk WF, Haymond MW, Rizza RA. Underestimation of glucose turnover measured with [6–3H]- and [6,6–2H]- but not [6–14C]glucose during hyperinsulinemia in humans. Diabetes 1989; 38: 97–107. [DOI] [PubMed] [Google Scholar]
- 24.Butler PC, Rizza RA. Contribution to postprandial hyperglycemia and effect on initial splanchnic glucose clearance of hepatic glucose cycling in glucose-intolerant or NIDDM patients. Diabetes 1991; 40: 73–81. [PubMed] [Google Scholar]
- 25.Shah M, Law JH, Micheletto F, et al. Contribution of endogenous glucagon-like peptide 1 to glucose metabolism after Roux-en-Y gastric bypass. Diabetes 2014; 63: 483–493. [DOI] [PMC free article] [PubMed] [Google Scholar]
- 26.Schirra J, Nicolaus M, Roggel R, et al. Endogenous glucagon-like peptide 1 controls endocrine pancreatic secretion and antro-pyloro-duodenal motility in humans. [see comment]. Gut 2006; 55: 243–251. [DOI] [PMC free article] [PubMed] [Google Scholar]
- 27.Janssen P, Harris MS, Jones M, et al. The relation between symptom improvement and gastric emptying in the treatment of diabetic and idiopathic gastroparesis. Am J Gastroenterol 2013; 108: 1382–1391. [DOI] [PubMed] [Google Scholar]
- 28.Vijayvargiya P, Camilleri M, Chedid V, Mandawat A, Erwin PJ, Murad MH. Effects of Promotility Agents on Gastric Emptying and Symptoms: a Systematic Review and Meta-Analysis. Gastroenterology 2019. [DOI] [PubMed] [Google Scholar]
- 29.Sharma M, Feuerhak K, Zinsmeister AR, Bharucha AE. A pharmacological challenge predicts reversible rectal sensorimotor dysfunctions in women with fecal incontinence. Neurogastroenterol Motil 2018; 30: e13383. [DOI] [PMC free article] [PubMed] [Google Scholar]
- 30.Bharucha AE, Low PA, Camilleri M, Burton D, Gehrking TL, Zinsmeister AR. Pilot study of pyridostigmine in constipated patients with autonomic neuropathy. Clin Auton Res 2008; 18: 194–202. [DOI] [PMC free article] [PubMed] [Google Scholar]
- 31.Pohl D, Van Oudenhove L, Tornblom H, Le Neve B, Tack J, Simren M. Functional Dyspepsia and Severity of Psychologic Symptoms Associate With Postprandial Symptoms in Patients With Irritable Bowel Syndrome. Clinical Gastroenterology & Hepatology 2018; 24: 24. [DOI] [PubMed] [Google Scholar]
- 32.Carbone F, Vandenberghe A, Holvoet L, et al. Validation of the Leuven Postprandial Distress Scale, a questionnaire for symptom assessment in the functional dyspepsia/postprandial distress syndrome. Aliment Pharmacol Ther 2016; 44: 989–1001. [DOI] [PubMed] [Google Scholar]
Associated Data
This section collects any data citations, data availability statements, or supplementary materials included in this article.


