Abstract
The possible role of sex in the biosynthesis of lipids in the Meibomian glands (termed meibogenesis) remains unclear. To determine if there were any major sex-specific differences in the lipid composition of meibomian gland secretions (meibum) and gene expression patterns (GEP) related to meibogenesis, we conducted a study using healthy, age and diet-matched young adult wild-type C57Bl/6J mice (2 to 2.5 month old). Tarsal plates (TP) were surgically excised from the eyelids of mice 2and subjected to transcriptomic and lipidomic analyses. The GEP were studied using mRNA microarrays. Lipids were extracted with organic solvents and analyzed using liquid chromatography and mass spectrometry. GEP in the TP of female and male mice demonstrated no statistically significant differences in the expression levels of the main protein-coding genes related to lipid metabolism and storage in general, and meibogenesis specifically (such as Elovl, Scd, Fads, Soat, Far, Awat, Acat, Lss, Dhcr, Hmgcr, Hmgcs, Dgat, Bckdh, Dbt, Fasn, and Plin, among others). The meibomian lipid profiles of female and male mice were virtually indistinguishable: all major lipids such as waxes, cholesteryl esters, cholesterol, (O)-acylated omega-hydroxy fatty acids (OAHFA), cholesteryl esters of OAHFA etc., were present in similar ratios. It seems that the major biosynthetic pathways in the Meibomian glands of male and female mice function in a similar fashion and produce secretions of the same overall chemical composition.
Keywords: Meibomian gland, meibum, meibogenesis, tarsal plate, lipidome, transcriptome, chromatography, mass spectrometry, sex, lipids
INTRODUCTION
In most mammals, Meibomian glands (MG) are a critically important part of the ocular defense system that protects the ocular surface from the harmful effects of the environment. MG produce a lipid secretion called meibum [1]. The quality and the quantity of meibum are both critical for ocular health. When the functions of MG are impaired, various ocular diseases can develop. Among the most common MG-related pathologies are dry eye (DE) and a closely related condition termed MG dysfunction (MGD) [2]. MGD reportedly results in abnormal MG secretions, which may be lacking both quantitatively (because of the MG dropout of varying severity) and qualitatively (because of the abnormal lipid composition and/or possible increase in non-lipid inclusions [3, 4, 5]). The exact triggers of the onset of MGD remain unclear. The dysfunction itself might be multifactorial, and so might be the causes of other forms of DE [6, 7]. The complex interplay of the possible effects of sex, aging, diet, hormonal status, ongoing pharmaceutical treatments, environment, systemic disease, etc. is difficult to dissect, so a logical approach is to conduct targeted experiments in tightly controlled conditions, which is not quite feasible with human subjects.
Previously, we demonstrated that meibum of mice closely resembles that of humans [8, 9, 10]. Also, our transcriptomic studies revealed undeniable similarities in the gene expression patterns (GEP) of humans and mice [9, 10]. Thus, mice seem to be a credible animal model for studying the biosynthesis of meibum in MG (which we termed meibogenesis [9, 10]), and its impairments in various ocular pathologies.
However, before conducting comprehensive DE and MGD-oriented studies, several important matters remain to be investigated, one of which is the possible effects of sex (or lack thereof) on the lipid composition of meibum. Importantly, DE is considered to disproportionately affect women [11], while symptomatic and asymptomatic forms of MGD were reported to be encountered in men more frequently than in women [12], implying that there might be sex-specific differences in meibogenesis in general, and the lipid composition of meibum, specifically. The symptoms of DE and MGD have also been linked to the hormonal status of the subjects and their menopausal state [13, 14]. Still, there is no clear understanding of whether the observed effects were a result of actual sex differences, or were caused by other factors such as age, diet, environment, or genetic background.
Therefore, we conducted a study to determine if there are any major sex-specific differences in the lipid composition of meibum and expression patterns of genes related to meibogenesis in TP of experimental animals – age- and diet-matched wild-type C57Bl/6J mice.
MATERIALS AND METHODS
Materials and reagents.
Lipid standards were from Nu-Chek Prep, Inc. (Elysian, MN), Matreya, Inc. (Pleasant Gap, PA), and Sigma-Aldrich (St. Louis, MO). Organic solvents were of chromatography or mass-spectrometry grade from Sigma-Aldrich, Burdick and Jackson (Muskegon, MI), or ThermoFisher (Waltham, MA). Other reagents (acids, bases, and salts) were of analytical or HPLC grade from Sigma-Aldrich or ThermoFisher.
Experimental animals and procedures.
For the reader's convenience, the overall design of the experiment is illustrated in Figure 1. Wild type C57BL/6J mice were purchased from the Wakeland Mouse Breeding Core facility at UT Southwestern Medical Center in Dallas [http://www.utsouthwestern.edu/labs/wakeland/about/contact.html]. The mice were a mix of 15 males and 15 females, 2 to 2.5 months old. All animal procedures used in the study had been approved by the UT Southwestern Medical Center's Institutional Animal Care and Use Committee and were conducted in accordance with the ARVO Statement for the Use of Animals in Ophthalmic and Vision Research. All mice used in this study were healthy and underwent preliminary examination by animal care specialists at the ARC of the UT Southwestern Medical Center. The mice were housed under a 12 hours light, 12 hours dark cycle, and all tissues were harvested during a 6-hour period within the early portion of the light period. The excision of tarsal plates was performed by trained personnel with experience in ophthalmology and mouse studies. Each mouse tarsal plate specimen was examined microscopically before the lipid and microarray analyses. The tarsal plates differed in sizes, but no signs of meibomian gland abnormalities were observed. A typical specimen is shown in Figure 1. The mice were euthanized using inhalant isoflurane. The whole TP (4 plates per animal) were excised from the eyelids and dissected free from surrounding tissues as described earlier [8, 9, 10]. Two TP from one eye of each animal were placed in a glass vial with 1 mL of a chloroform : methanol = 2 : 1 (v/v) solvent mixture for lipid extraction, while the other two were processed for mRNA microarray analyses using RNAlater storage solution (from Qiagen, Germantown, MD). The tissue samples for lipid analysis can be stored in sealed vials in the organic solvent under nitrogen for several months, provided that they are kept in a freezer at, or below, −20°C.
Figure 1. The overall design of the experiments.
Left panel. A microphotograph of a dissected mouse T. Meibomian glands within tarsal plate are visible as off-white, grape vine-shaped structures, three of which are marked with red asterisks.
Center panel. Extraction of the lipids from the tarsal plates of mice (the red arrow shows the tarsal plates)
Right panel. Preparatory steps for lipid analyses of the extracts.
Preparation of lipid samples.
The lipid extraction was allowed to proceed at 4 °C overnight. Then, the organic solution was transferred into another vial, and the extraction of the tissues was repeated at room temperature for 15 min two more times. In preliminary experiments, we verified that the three-time extraction of the tissues was sufficient to remove all extractable lipid material from the TP specimens as no lipids were detected in the fourth extract. Longer incubations in the solvent neither increased the yield of extracted lipid material, nor did they change the lipid composition of the extracts. The three lipid extracts were pooled and then brought to dryness under a stream of ultra-high purity nitrogen at about 36 °C using a thermostated FlexiVap Work Station (from Glas-Col, Terre Haute, IN). The waxy residue was re-dissolved in a small volume (typically, between 200 μL and 1 mL) of the solvent of choice (see below) – either n-hexane : i-propanol solvent mixtures, or pure i-propanol, – and stored in glass vials in a freezer.
Three pooled samples of expressed wild type mouse meibum (n=3, 2 TP/animal each time) were also collected on three separate occasions to determine if they differed from TP extracts. The expressed material was processed the same way as were TP extracts. As meibum expression directly from the eyelids of mice (a procedure that was used in our previous studies [8, 9, 10]) was found to be rather cumbersome and yielded only small amounts of the material, we used a different approach in the current study: meibum was gently squeezed out of the excised TP and collected using a micro spatula and a dissecting microscope.
Just before the analyses, the sample vials were briefly warmed up to about 30-35 °C to facilitate solubilization of any possible precipitate: at lower temperatures, precipitation of higher molecular weight and saturated lipids in the samples may occur in concentrated samples. The completeness of solubilization was controlled visually using a binocular microscope, and by reproducibility of the analytical results. Then, the samples were analyzed as illustrated in Table S1.
Liquid chromatography-mass spectrometry.
Initial characterization of samples was conducted using mass spectrometry (MS), isocratic normal phase high-performance liquid chromatography (NP-HPLC) on a Diol silica gel column (3.2×150 mm, 5μm, from Phenomenex, Torrance, CA), and gradient ultra-high performance liquid chromatography (UPLC) on C18 columns (see below).
Isocratic NP-HPLC experiments on the Diol column in a n-hexane : i-propanol : glacial acetic acid = 95 : 5 : 0.1 (v/v/v) eluent was the first step in characterization of the samples. The Diol column provided a relatively fast (up to 15 min per analysis) throughput of samples and a tight grouping of elution peaks of meibomian lipids, which facilitated their quick evaluation. For these experiments, the lipid samples were dissolved in 750 μL of n-hexane : i-propanol = 95 : 5 (v/v) solvent mixture. The experiments were performed using a Waters 1525 binary HPLC pump, a Column Heater Module, a Temperature Control Module, and a 717 Plus Autosampler (Waters Corp.). The analytes were detected using a LCQ Fleet ion trap mass spectrometer from ThermoElectron equipped with an atmospheric pressure chemical ionization (APCI) ion source. The details of the method have been described in our previous publications [9, 15, 16] and are summarized in Table S1. Phospholipids (PL) and sphingomyelins (SM) were analyzed as described earlier [16].
The limited resolution of the ion trap (typically, ± 0.2 Da) made it difficult to analyze complex mixtures of compounds, many of which may have had very close m/z values. Thus, to measure accurate m/z values of the meibomian lipids (better than ±0.5 mDa), we performed gradient reversed phase UPLC-high resolution mass spectrometry (C18-UPLC/HRMS) experiments using a binary Waters Acquity M-Class UPLC system and a Synapt G2-Si QToF mass spectrometer equipped with an APCI IonSabre ion source and a LockSpray™ (all from Waters Corp., Milford, MA), operated in the MSE mode. A solution of leucine enkephalin (exact m/z 556.2771, M+H+) was used as a Lock Spray solution to automatically correct for the drift of the m/z values. The analytes were separated on a Acquity UPLC C18 BEH column (1 mm × 100 mm, 1.7 μm) in a binary gradient of 95% acetonitrile : 5% 10mM ammonium formate in water (Solvent A) and 95% i-propanol : 5% 10 mM ammonium formate in water (Solvent B) at 35°C (Table S1). For these experiments, the lipid samples were re-dissolved in 1mL of i-propanol. The choice of the latter solvent instead of a more traditional chloroform or the chloroform : methanol mixture [9, 17, 18], or the n-hexane : i-propanol mixture used in current and past NP-HPLC experiments, was dictated by better shapes of elution peaks in C18-UPLC experiments due to better miscibility of i-propanol with the chromatographic eluents in use. The results were analyzed in the MassLynx (v.4.1) and the MSe Data Viewer (v.1.4) software packages from Waters Corp.
The analytes were detected using previously optimized settings [9, 17, 18]. The apparent abundances of each lipid were routinely calculated from their extracted ion chromatograms (EIC) using the Avalon algorithm built into the Xcalibur software (from Thermo Electron), or the default integration algorithm of the MassLynx software package, by determining the EIC LC-MS peak areas for each lipid and its corresponding lipid standard (when available).
Gas chromatography-mass spectrometry.
As saturated wax esters are almost undetectable in routine LC-MS experiments, the samples were also studied by high temperature gas-chromatography-electron impact mass-spectrometry (HTGC-EIMS) using a TG-5HT column (length 30 m, internal diameter 0.25 mm, film coating 0.1 μm), a Trace GC Ultra gas chromatograph, an ITQ 1100 mass spectrometric detector, and an AI 3000 II autoinjector (all from Thermo Electron). A temperature gradient was used to elute the analytes at 1mL/min of the helium gas flow. The conditions of the analyses, developed for human meibum samples, were described before in detail [19] and used without any major modifications.
Estimation of the total meibomian lipid content in the tarsal plates in NP-HPLC/MS experiments.
Unlike human meibum samples, individual mouse meibum samples were too small for gravimetric analysis. To estimate the lipid content of a mouse TP semi-quantitatively, we used the following approach illustrated in Supplemental Figure S1. A model equimolar lipid mixture of six homologous wax esters (WE), a cholesteryl ester (CE) cholesteryl oleate, free cholesterol (Chl), squalene (Sql) and a triacylglycerol (TAG) triolein that were expected to be present in normal meibum was prepared. Then, the total ion chromatograms (TIC) were generated in NP-HPLC/APCI-MS experiments by injecting increasing amounts of the model lipid mixture. The TIC peaks were integrated using the Avalon algorithm of the Xcalibur software, and the peak areas were plotted against the injected volumes of the mixture. The resulting calibration curve was used to estimate the total amount of lipids in samples, while the EIC of the individual lipids were used to create standard curves for specific lipids and lipid classes.
The inter-sample variability of the total lipid content of TP specimens was determined by comparing their respective TIC corrected for the number of TP in each sample (typically, two). Considering that extracted lipids were reconstituted in the same volume (200 μL or 1 mL), the TIC peak areas provided a meaningful way of comparing the meibomian lipid content per one TP for all tested mice.
The transcriptomic analyses of mouse tarsal plates.
The analyses of whole excised TP were performed in the UT Southwestern Genomics and Microarray Core facility [http://utsouthwestern.edu/research/core-facilities/genomics] using mRNA microarrays (Clariom™ D from Affymetrix, Santa Clara, CA; previously known as GeneChip™ Mouse Transcriptome Array 1.0) as described earlier [9, 10]. Before the analyses, the samples were stored in RNAlater® solution (from ThermoFisher). The data were processed and analyzed using the Expression Console and the Transcriptome Analysis Console (both from Affymetrix) and SigmaStat (v. 3.5) from Systat Software (San Jose, CA). Only samples with RNA integrity numbers (RIN) of 9 and above were used for gene expression profiling.
Considering the substantial cost of the transcriptomic analyses, and to compensate for any uncontrollable interdonor variability of the GEP, two TP from each of 5 female mice (10 TP total; age of animals between 2 and 2.5 months) were pooled to give one combined female sample, and so where 10 TP from 5 male mice of the same age and genetic background, to give a combined male sample. This experiment was repeated two more times 2 and 6 months later with two new sets of mice (5 males and 5 females each time) of the same age from the same vendor.
Statistical approaches.
Standard statistical approaches were used. The lipid samples from male and female mice were compared using SigmaStat software (v. 3.5, from Systat Software Inc., Point Richmond, CA). The t-test and the one-way ANOVA routines were used to compare the groups of study samples. In most cases, the experimental results passed the normality and the equal variance tests; thus, the t-test was used in those cases.
When the normality and/or the variance tests failed, then the Rank sum test was used. For three or more groups of samples, the ANOVA tests were performed. The gene expression data were analyzed using the Transcriptome Analysis Console built-in routines as described later in the manuscript.
RESULTS
Initial characterization of TP extracts and expressed meibum.
Meibomian lipids of mice have been characterized in our previous experiments with meibum expressed directly from the eyelids of experimental animals [8, 9, 10]. However, this approach yielded relatively low amounts of material, which made it hard to conduct fast, reliable, and comprehensive characterization of multiple specimens. The approach that we chose in this study (analyses of total lipid extracts from surgically excised TP) provided much larger amounts of meibomian lipids per animal (5 to 10 times more), which allowed us to use more concentrated samples and improved the signal-to-noise ratio, especially for minor components of meibum.
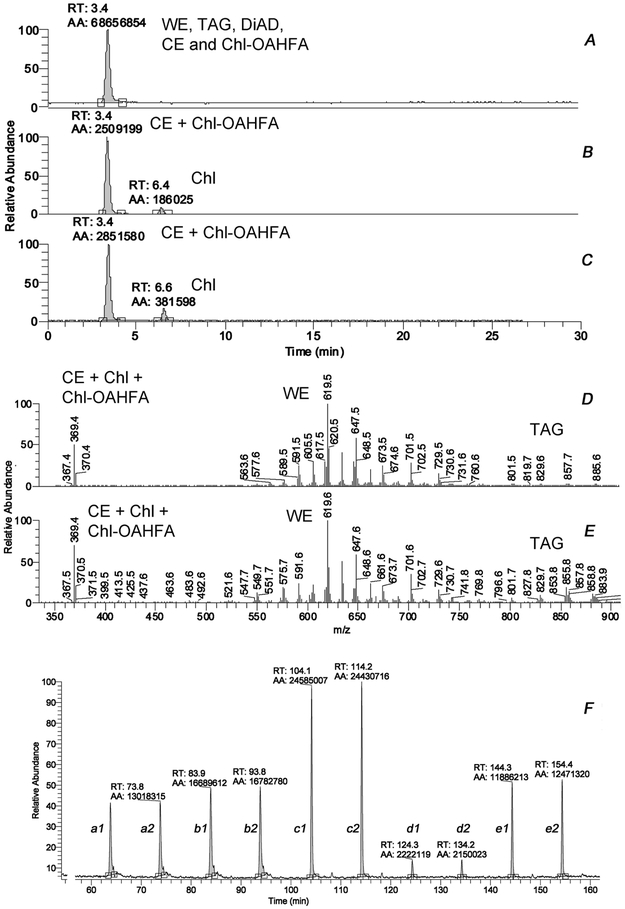
Initially, lipid samples were subjected to NP-HPLC/APCI-MS experiments conducted in positive ion mode (PIM) using a Diol column. The short duration of analysis (about 15 min per sample) allowed for a relatively fast throughput of samples and facilitated preliminary characterization of the samples (Figure 2). For comparison purposes, a similarly analyzed sample of meibum expressed from excised tarsi is also shown. One could conclude that the mass spectrum of the TP extract and that of the expressed meibum were very similar, with the exception of a few features, e.g. a considerably stronger signal with m/z 369 (a combined signal of CE and Chl) in the TP samples. A 2x to 3x-time increase in the Chl/CE ratio, determined as the ratio of the corresponding chromatographic peak areas for Chl and CE in TP extracts and expressed meibum, was one of a very few detectable and repeatable differences between the two types of samples (Figure 2). Another detected difference was the elevated (about ×5) level of triacylglycerols (TAG) in the TP extracts compared with expressed meibum. Note that the NP-HPLC/APCI-MS type of analysis is fine tuned to detect and measure mostly neutral and/or nonpolar lipids such as WE, CE, TAG and diacylglycerols (DAG), diacylated α,ω-diols (DiAD), free cholesterol (Chl), ceramides (Cer), acyl-Cer, and other similar compounds. A side-by-side comparison of a male and a female TP extracts are shown in Figure S2. A more detailed comparison of major lipid classes in mouse specimens is provided below.
Figure 2. Initial characterization of expressed meibum and tarsal plate lipid extracts of wild-type C57Bl/6J mice using NP-HPLC/APCI-MS in positive ion mode.
Panel A. A total ion chromatogram of expressed mouse meibum obtained using a Diol column.
Panel B. An extracted ion chromatogram of ion m/z 369 of expressed mouse meibum.
Panel C. An extracted ion chromatogram of ion m/z 369 of mouse tarsal plate lipid extract.
Panel D. Observation mass spectrum of expressed mouse meibum.
Panel E. Observation mass spectrum of a tarsal plate lipid extract. Note stronger signals of TAGs in the region of m/z values between 800 and 900. TAGs are detected as (M+H)+ adducts. Also noticeable is a stronger common characteristic signal of Chl and CE with m/z 369.4.
Panel F. A fragment of a typical analytical HPLC/MS run. Two mouse samples a and b were injected twice each (as injections a1-a2 and b1-b2, respectively; 2×3μL each), followed by injections of 10μM standard lipid mixture (injections c1-c2, d1-d2, and e1-e2, were 2×20 μL, 2×1 μL, and 2×10 μL, respectively).
Wax Esters.
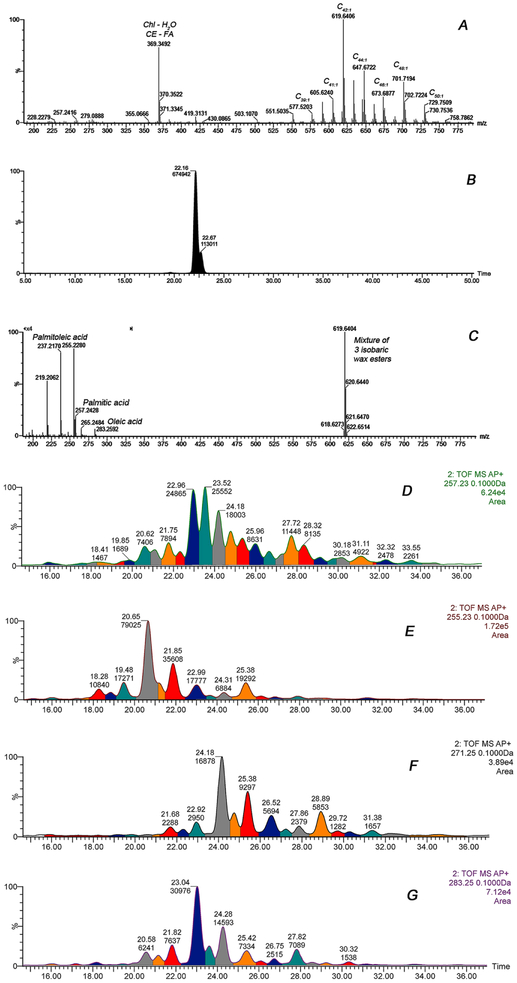
Unsaturated WE were further characterized using C18-UPLC/APCI-HRMS. The APCI IonSabre ion source was operated in the MSE mode. The results are presented in Figure 3 and Table S2. Note that most of the WE shown in Panel A were, in fact, mixtures of two, three, or even four isobaric compounds. For example, a single precursor ion m/z 619.6404 (a proton adduct of a C42:1 WE) was actually an isobaric mixture of at least three individual unsaturated WE with oleic (m/z 283.2592), palmitic (m/z 257.2428) and palmitoleic (m/z 255.2280) acid moieties (Figure 3, panel B). Other major signals visible in the spectrum – m/z 237.2170 and 219.2062 – are products of sequential spontaneous loss of two molecules of water by ion m/z 255.2280. In agreement with our previous results [8, 9, 10], and in disagreement with a recent publication of Sassa et al. [20], the mouse meibomian WE were confirmed to be based primarily on C16:1 (most likely, palmitoleic) fatty acid rather than the C18:1 (oleic) fatty acid (Figure 3, Panel C). The apparent ratio of C16:1- to C18:1-based lipids was between 2:1 and 4:1. The four major fatty acids (FA) that meibomian WE are based upon – palmitic, palmitoleic, heptadecanoic, and oleic – are shown in Figure 3, Panels D through G. Moreover, oleic acid represented <23% of FA residues in the WE fraction of mouse meibum listed in Table S2 – far less than the dominant C16:1 FA (~50%).
Figure 3. Analysis of wax esters of mouse tarsal plate extracts using C18-UPLC/APCI-HRMS in positive ion mode.
Panel A. A high resolution mass spectrum of mouse tarsal plate extract. Peaks are labeled according to the total carbon content (n) and the number of –CH=CH– moieties per molecule (m) as Cn:m.
Panel B. An extracted ion chromatogram of a wax ester with m/z 619.6404. Molecular formula: C42H82O2; detected as (M + H)+ adduct.
Panel C. A MS/MS fragmentation spectrum of a wax ester with m/z 619.6404. Note the dominating presence of palmitoleic acid fragment m/z 255.2280, and its dehydration products (M + H − H2O)+ and (M + H − 2H2O)+ (m/z 237.2170 and 219.2062, respectively).
Panels D-G. Extracted ion chromatograms of four major FA fragments of mouse WE, obtained in the MSE mode. Panel D – C16:0 (palmitic) acid; Panel E – C16:1 (palmitoleic) acid; Panel F – C17:0 (heptadecanoic) acid; Panel G – C18:1 (oleic) acid. Each HPLC peak in Panels D-G (individually colored) corresponds to at least one individual WE species. For this particular sample, the overall amount of palmitoleic acid-based WE was ~4x higher than oleic acid-based ones. HPLC separation was performed on an Acquity UPLC C18 BEH column using conditions described in Table 1.
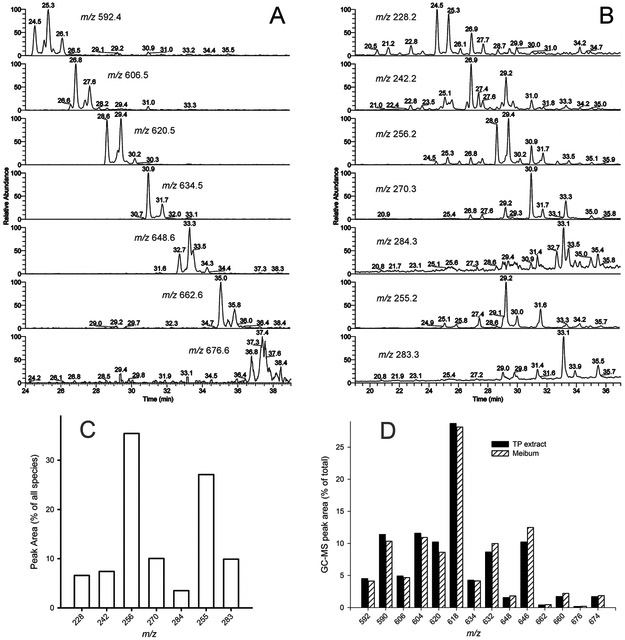
The major saturated WE species were characterized in HTGC-EIMS experiments (Figure 4). The reason for employing this technique was the poor (or nonexistent) ability of saturated WE to form (M + H)+ adducts in the conditions of HPLC/ESI-MS and HPLC/APCI-MS experiments. This was in contrast with HTGC-EIMS, where the signals of saturated WE [detected as a pair of M+ and (M + H)+ ions] were about 7.7 times stronger than those of their equimolar mono-unsaturated counterparts of equal carbon chain length [detected as (M + H)+ and (M + H −H2O)+ ions]. Typical extracted ion chromatograms of individual saturated meibomian WE are shown in Figure 4, Panel A. Clearly, there were several isobaric forms of WE for each tested m/z value, illustrating the fact there was more than one isoform of the lipid with the same elemental composition.
Figure 4. Gas chromatographic-mass spectrometric analysis of wax esters extracted from mouse tarsi.
Panel A. Extracted ion chromatograms of saturated wax esters. Each trace corresponds to a particular ion.
Panel B. Extracted ion chromatograms of FA residues formed due to the spontaneous in-source fragmentation of WE. Each trace corresponds to a particular ion.
Panel C. Relative abundances of FA in the WE fraction of mouse tarsal plate extracts. Note that saturated FA residues produced M+. ions, while unsaturated FA were visible as (M + H)+ adducts.
Panel D. Relative abundances of saturated and unsaturated WE in the mouse tarsal plate extracts and expressed meibum. The analytes were detected as M+. molecular ions (loss of electron). The results are shown as fractions (in %) of the total pool of analytes shown in the Figures.
The well-known partial spontaneous in-source fragmentation of WE was utilized to evaluate their FA composition (Figure 4, Panel B). In these experiments, a range of fully saturated WE based on FA in the following order C16:0 > C17:0 >>C18:0, C15:0, C14:0 were detected (Figure 4, Panels C and D). Among the monounsaturated FA, the C16:1 palmitoleic acid (m/z 255) was again identified as the major FA that exceeded the levels of the next biggest contributor – a C18:1 oleic acid (m/z 283) – by a factor of ~3. These results closely matched the data obtained using HPLC/MS as described in the previous paragraph. These results were corroborated in fragmentation MS/MS experiments with each of the major WE found in the TP extracts and expressed meibum (data not shown).
Determination of the geometry of major saturated WE was performed as described before [19] using characteristic neutral mass losses of 44 Da for iso-branched forms, and 30/28/58 Da – for the anteiso-branched compounds. Saturated FA moieties in WE were a mix of straight chain (s-FA), and iso-(i-FA) and anteiso- (ai-FA) branched isomers. For example, C17:0-FA residues in saturated WE were almost exclusively of anteiso-nature, while C16:0 FA were a mix of straight chain and iso-isomers. The ai-C17:0 FA moiety was detected in WE with m/z 606, 618/620 pair, 634 (major), and 646/648 pair, while both s-C16:0 and i-C16:0 FA contributed to each of several forms of WE with m/z 592, 606, 620 (major), 634, and 648 (Figure 4). A typical monounsaturated WE had a straight chain monounsaturated FA residue, while most of the saturated WE were based on i- and ai-FA. We were unable to reliably detect and conduct fragmentation of the alcohol moieties of WE at this time. However, RT of monounsaturated WE standards consistently differed from those of meibomian WE, making us believe that the FAl moieties of the latter might be branched, too.
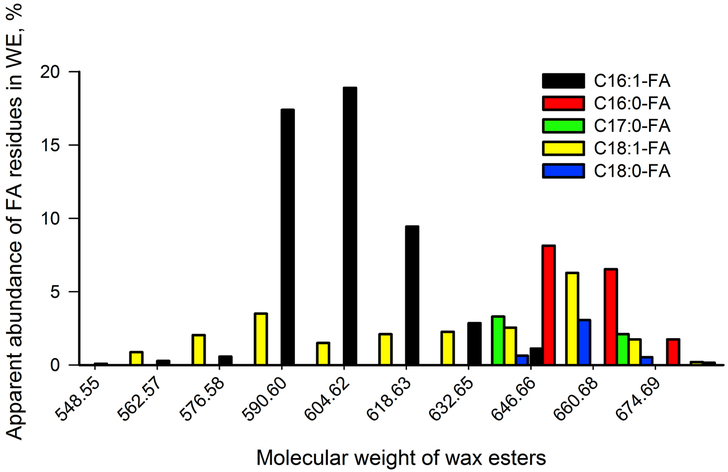
A combination of these approaches allowed for quantitative correction of the abundances of saturated and unsaturated WE in mouse samples. The interdonor variability in distribution of individual species of WE in mouse meibum was very conservative and changed no more than ±13%, on average. The relative abundances of major WE species in a representative sample of a mouse TP extract are shown in Figure 5. Because of the existence of a large number of isobaric species, the exact quantitation of these compounds represents a formidable task and will be reported separately.
Figure 5.
Apparent distribution of FA residues in major unsaturated WE of a representative sample of a mouse tarsal plate extract. The analytes were detected using C18-UPLC/APCI-HRMS in the MSE positive ion mode as shown in Figure 3.
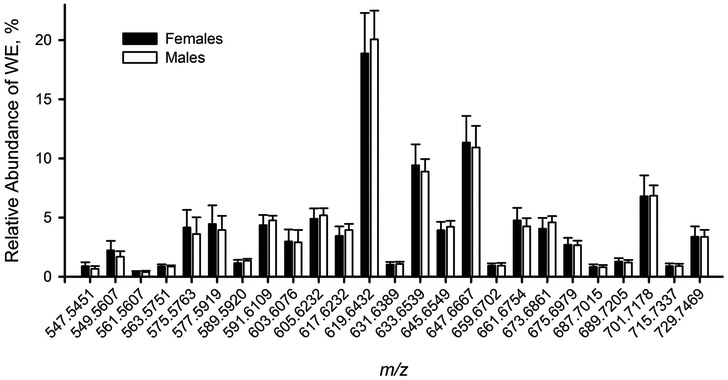
However, WE profiles of male and female mice were found to be very similar (Figure 6): the differences were rather minimal and random. We cannot rule out the possibility that these changes are sporadic and within the natural variability range for this class of lipids.
Figure 6.
Distribution of major WE species in tarsal plate extracts of female and male mice (n=10, each group). The compounds were detected as (M + H)+ ions. Their chemical nature is discussed in the text.
Free Cholesterol and Cholesteryl Esters.
To compare the profiles of Chl and CE in meibum of male and female mice, we utilized previously described LC-MS protocols [8, 9, 17, 21], which were slightly modified to make it compatible with newer LC-MS instrumentation. The nature of ions with m/z value of 369.3521 as cholesteryl fragments of CE was confirmed in single ion monitoring MS/MS experiments – all product ions were identical to those of a chemical standard (Figure S3).
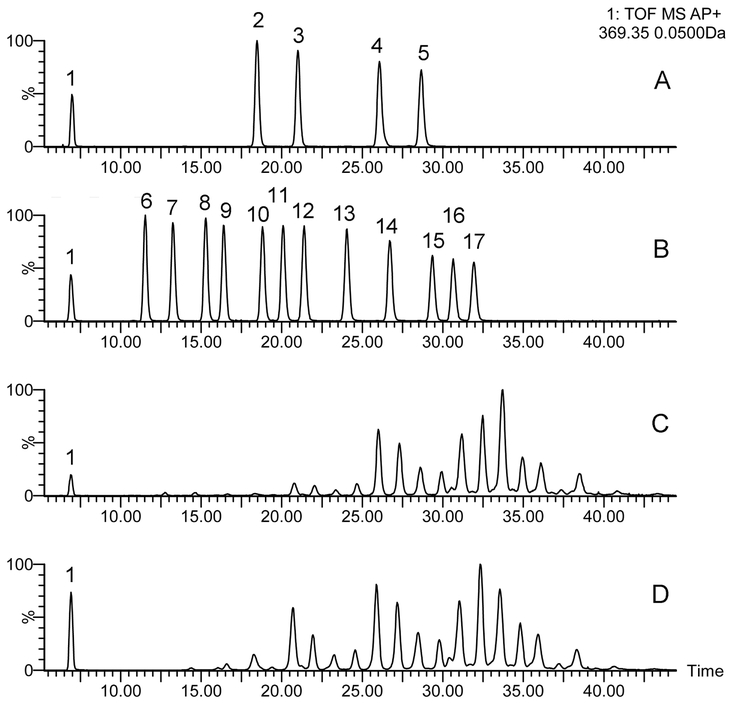
The Chl and CE profiles of TP extracts and those of expressed meibum were determined in C18-UPLC/APCI-HRMS experiments in PIM (Figure 7). As with WE, no major differences between the two types of samples were found, with the exception of the clearly higher levels of Chl in the TP extracts. Identification of CE was performed as described earlier for human and animal meibum [8, 9, 17, 21]. All CE (saturated and unsaturated ones), as well as Chl, spontaneously produced a common ion with m/z value of 369.3521 [(M − FA + H)+, neutral loss of a FA residue; strongest of all product ions], which was used as a universal analytical ion to detect all CE species in the samples (Figure 7). This ion proved to be useful for CE quantitation: an equimolar mixture of four monounsaturated CE with C16:1-C24:1 FA (50 μM each), and another equimolar mixture of twelve saturated CE with C7-C24 FA (50 μM each), produced LC peaks with almost no changes in the peak areas (SD < 8%), which made it possible to estimate the relative ratios of various fractions of CE in the mouse samples using their peak areas. Importantly, the signal intensity for saturated and unsaturated CE was virtually the same, which facilitated their quantitation in mouse samples. Under tested condition, free Chl has always produced LC peaks approximately 40% the areas of those of equimolar CE.
Figure 7. Analysis of free cholesterol and cholesteryl esters using C18-UPLC/APCI-HRMS in positive ion mode.
Panel A. Extracted ion chromatogram of ion m/z 369.35 produced by a mixture of authentic free Chl (peak 1), cholesteryl palmitoleate (peak 2), cholesteryl oleate (peak 3), cholesteryl erucate (peak 4), and cholesteryl nervonate (peak 5). Average peak area for all four CE was 1509582 arbitrary units; SD = 7.9%
Panel B. Extracted ion chromatogram of ion m/z 369.35 produced by a mixture of authentic free Chl (peak 1), and saturated straight chain CE: C7:0-Chl (peak 6), C9:0-Chl (peak 7), C11:0-Chl (peak 8), C12:0-Chl (peak 9), C14:0-Chl (peak 10), C15:0-Chl (peak 11), C16:0-Chl (peak 12), C18:0-Chl (peak 13), C20:0-Chl (peak 14), C22:0-Chl (peak 15), C23:0-Chl (peak 16), C24:0-Chl (peak 17). Average peak area for all twelve CE was 1554166 arbitrary units; SD = 6.0%.
Panel C. Extracted ion chromatogram of ion m/z 369.35 produced by a sample of expressed mouse meibum. Peak 1 – free Chl. Other peaks discussed later in the manuscript.
Panel D. Extracted ion chromatogram of ion m/z 369.35 produced by a sample of extracted mouse tarsal plate lipids.
Then, a more detailed characterization of CE was conducted using molecular adducts of CE with H+, K+, and NH4+ ions. Under the condition of C18-UPLC/APCI-HRMS experiments, standard unsaturated CE were detected as a very weak signal of ion (M+H)+, and two stronger signals (M + K)+ and (M + 55/56 Da)+ [possibly, (NH3 + K)+ ion adducts] (Table S3). Standard saturated CE formed most abundant adducts of the (M + 55/56 Da)+ nature.
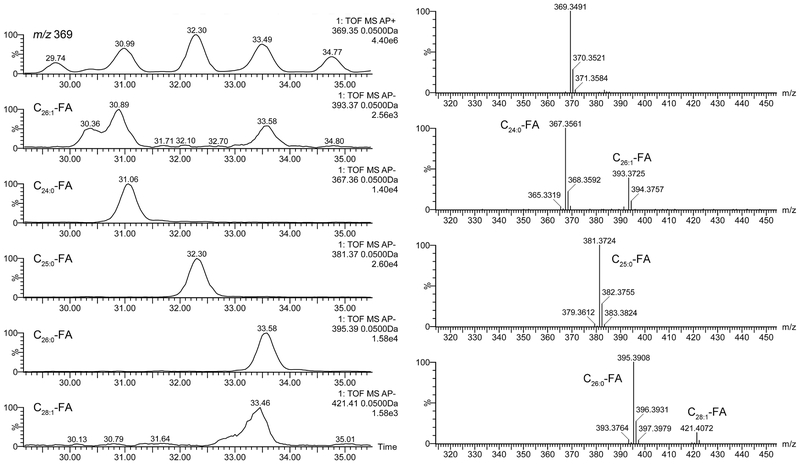
The major detected CE ranged from C16-CE to C34-CE (total range from C12 to C34) and varied in their degrees of unsaturation. The nature of the FA residues in CE was determined by using two approaches: 1) calculating the difference between the m/z values of proton adducts of CE on one hand, and the product ion m/z 369, on the other (neutral loss of FA in PIM); and 2) by conducting simultaneous detection of analytes in PIM and NIM: in the latter case, FA residues of CE were detectable as coeluting anions (FA – H+)-- due to spontaneous fragmentation of CE in the ion source (Figure 8). These two approaches provided reliable identification of CE species present in mouse meibum, and confirmed co-elution of [Cn:0 and C(n+2):1] pairs of CE. We attempted to resolve these coeluting pairs of CE using various combinations of solvents for C18-UPLC. Indeed, a partial separation of the pairs was achieved, but at the expense of either very long separation times, or very high system pressure, both of which were deemed to be impractical.
Figure 8. C18-UPLC/APCI-HRMS analysis of cholesteryl esters detected in tarsal plate extracts of a male mouse in positive and negative ion modes. The analysis is based on spontaneous in-source fragmentation of CE which produces an ion m/z 369.3521 (Chl − H2O + H)+ in PIM, and corresponding FA fragments (FA – H)− in NIM.
Left panels. A fragment of an extracted ion chromatograms of ions m/z 369.35 (PIM) and five FA fragments m/z 393.37, 367.36, 381.37, 395.39, and 421.41 (NIM).
Right panels. High resolution mass spectra of fragments of cholesterol (m/z 369.35; PIM) and three FA fragments of CE m/z 393.37, 367.36, 381.37, 395.39, and 421.41 (NIM).
Note that UPLC peaks of even-chain CE were comprised of two virtually co-eluting compounds with their FA fragments grouped in the follows fashion: [C16:0 and C18:1], [C18:0 and C20:1], [C20:0 and C22:1], [C22:0 and C24:1], [C24:0 and C26:1], [C26:0 and C28:1], [C28:0 and C30:1], [C30:0 and C32:1], and [C32:0 and C34:1], while odd-chain CE with FA moieties from C21:0 to C31:0 either did not have odd-chain monounsaturated counterparts, or the amounts of the latter were below the limits of detection. The shortest detected CE had a C12:0 FA in its structure, while the longest detected CE was a monounsaturated C38:1-CE. The major saturated CE were always the C24:0-CE, C25:0-CE, and C26:0-CE. The relative amounts of individual CE species are shown in Table 1.
Table 1.
Composition of cholesteryl esters detected in mouse tarsal plates.
| Cholesteryl esters | Peak area, % total CE pool | FA signal ratios in the mouse tarsal plate extracts, % | |
|---|---|---|---|
| Saturated CE | Unsaturated CE | ||
| C16:0-CE + C18:1-CE | 6.9 | 40.1 | 59.9 |
| C17:0-CE | 3.5 | >99 | <LLoD |
| C18:0-CE + C20:1-CE | 1.3 | <LLoD | <LLoD |
| C19:0-CE | 1.7 | >99 | <LLoD |
| C20:0-CE + C22:1-CE | 8.5 | 95 | 5 |
| C21:0-CE | 7.5 | >99 | <LLoD |
| C22:0-CE + C24:1-CE | 4.6 | 68.7 | 31.3 |
| C23:0-CE | 3.4 | >99 | <LLoD |
| C24:0-CE + C26:1-CE | 8.8 | 66.7 | 33.3 |
| C25:0-CE | 12.7 | >99 | <LLoD |
| C26:0-CE + C28:1-CE | 9.9 | 80.8 | 19.2 |
| C27:0-CE | 5.4 | >95 | <LLoD |
| C28:0-CE + C30:1-CE | 5 | 32.0 | 68.0 |
| C29:0-CE | <0.5 | <LLoD | <LLoD |
| C30:0-CE + C32:1-CE | 3 | 11.5 | 88.5 |
| C31:0-CE | <LoD | <LLoD | <LLoD |
| C32:0-CE + C34:1-CE | 0.5 | <0.1 | >99.9 |
| Others | 16.8 | ||
Importantly, detected unsaturated meibomian CE coeluted with available chemical standards C16:1, C18:1, C22:1, and C24:1-CE, while saturated CE produced a more complex pattern – the smaller fraction was, apparently, comprised of straight chain CE, as it coeluted with straight chain CE standards, while the major fraction was, apparently, formed of branched-chain CE, which invariably had retention times by about 0.5 min shorter than their straight-chain counterparts.
Exact quantitation of individual species of CE on the basis of their proton (or other types of) adducts is difficult because CE simultaneously form a range of various adducts. Importantly, the makeup of adducts varied from CE to CE, which is even more difficult to account for because many chemical standards of CE (such as branched chain ones, or those with FA moieties longer than C24) are currently unavailable. Thus, a hybrid APCI MS approach based on detection of the common ion m/z 369 in PIM, and FA moieties of CE in NIM, was used. When this approach was applied to MTP extracts, the following pattern emerged: saturated CE dominated the pool. For example, the apparent ratio of C22:0-CE to C24:1-CE was found to be approximately 2.2:1. It appears that the majority of FA in CE are saturated and, most likely, branched, as their retention times were different from those of available straight chain standards.
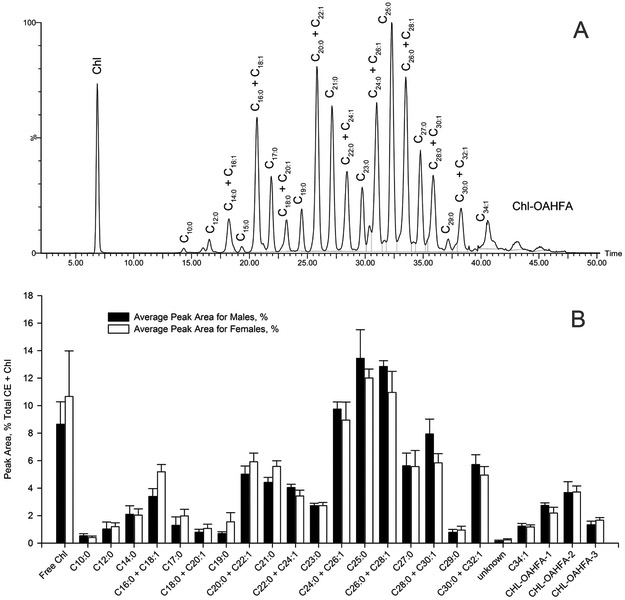
Free Chl and CE elution profiles of male and female samples were found to be very similar (Figure 9). The differences, however, were rather minimal and apparently random, with the only observable trend being a minor increase in shorter chain CE in females compared with males.
Figure 9. Comparison of cholesteryl esters observed in tarsal plates of male and female mice.
Panel A. Extracted ion chromatogram of ion m/z 369.3521 of a representative sample of a female mouse tarsal plate extract and the peak assignments.
Panel B. Distribution of major CE species in tarsal plate extracts of female and male mice (n=10, each group). The chemical nature of the last three compounds (Chl-OAHFA-1 – m/z 1104.0411; Chl-OAHFA-2 - m/z 1128.0721; Chl-OAHFA-3 – m/z 1156.1010) is described in Figure 10. Chl-OAHFA were quantitated as (M + H)+.
Cholesteryl Esters of OAHFA.
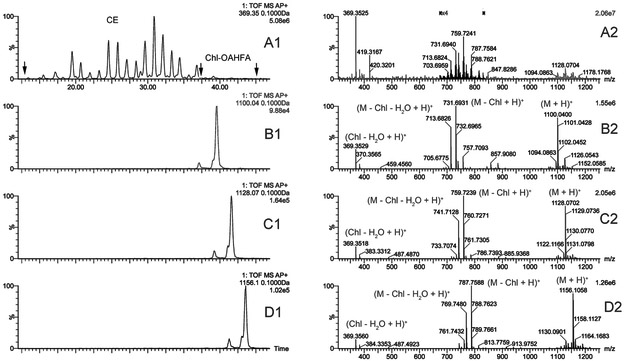
Regular CE described above are not the only form of esterified cholesterol in mouse meibum. Another form of esters (or "diesters" using the terminology proposed by Nicolaides et al. [1, 22]) is cholesterol esterified to a range of (O)-acylated ω-hydroxy FA (OAHFA). Under the conditions of reverse phase liquid chromatography, Chl-OAHFA eluted considerably later than the longest regular CE (Figure 10), clearly because of their increased hydrophobicity. Three major lipids from this group were detected in the APCI-MS experiments in PIM as (M + H)+ adducts with m/z values of 1100.0427, 1128.0791, and 1156.1090. Characteristically, these complex lipids spontaneously fragmented to produce a common ion m/z 369.3556 (dehydrated cholesterol; theoretical m/z 369.3520) and several fragments of protonated OAHFA: ion m/z 1100.0427 produced fragments with m/z values of 783.7167, 757.7093, and 731.6931, ion m/z 1128.0791 led to ions m/z 785.7485, 759.7239, and 733.7074, while fragmentation of the parent ion with m/z 1156.1090 resulted in product ions 813.7759, 787.7588, and 761.7432, and their dehydration products (M − H2O). These products of fragmentation were consistent with saturated and various unsaturated OAHFA. As no chemical standards of individual Chl-OAHFA are currently available, their exact quantitation was not possible. Notably, there were no statistically significant differences in the production of Chl-OAHFA between males and females (Figure 9, Panel B), except for the compound with m/z 1100.0427, which was expressed at a slightly higher level in males (p<0.05).
Figure 10. Reverse-phase chromatograms and high-resolution mass spectra of CHL-OAHFA detected in tarsal plate extract of a male mouse using C18-UPLC/APCI-HRMS in positive ion mode.
Panels A1 and A2. Extracted ion chromatogram of ion m/z 369 (Panel A1) and an observation spectrum of the region of Chl-OAHFA (Panel A2, RT 35 to 45 min, marked with black arrows).
Panels B1 and B2. Extracted ion chromatogram of ion m/z 1100.04 (Panel B1) and its spontaneously formed fragments (Panel B2). Molecular formula C75H134O4; detected as (M + H)+ adduct.
Panels C1 and C2. Extracted ion chromatogram of ion m/z 1128.07 (Panel C1) and its spontaneously formed fragments (Panel C2). Molecular formula C77H138O4; detected as (M + H)+ adduct.
Panels D1 and D2. Extracted ion chromatogram of ion m/z 1156.11 (Panel D1) and its spontaneously formed fragments (Panel D2). Molecular formula C79H142O4; detected as (M + H)+ adduct.
Acylglycerols.
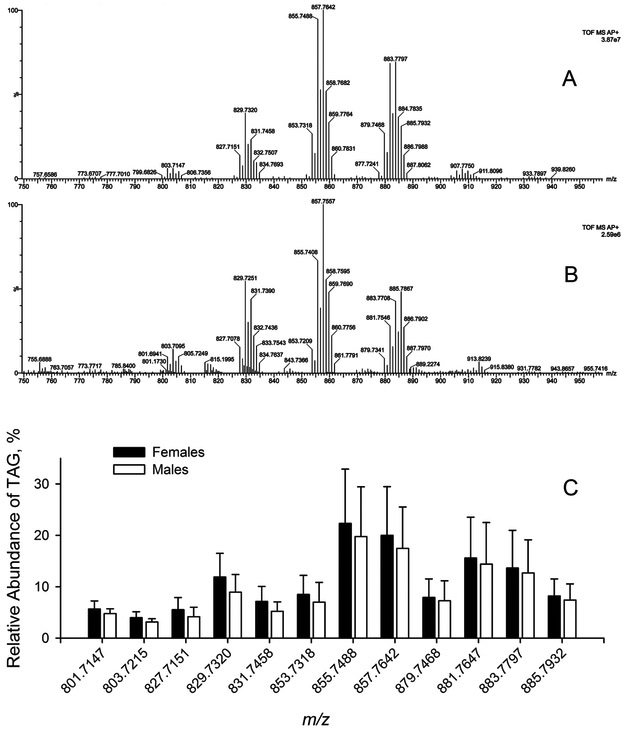
In C18-UPLC experiments, TAG of meibum always eluted between the fraction of free cholesterol and those of WE and CE. Representative high-resolution mass spectra of TAG fractions of a mouse TP extract and that of expressed meibum are shown in Figure 11. TAG were observed as (M+H)+ adducts and their DAG fragments (M − FA + H)+ that were formed in-source due to spontaneous neutral loss of acyls because of the inherent instability of complex lipid molecules (including TAG) in MS experiments. These are not to be confused with DAG that could have been present in tarsal lipid samples as actual analytes. However, the chromatographic retention times of DAG would have been much shorter than those of TAG, thus making them easily detectable as actual components of lipid extracts, had they been present in the samples, which, in fact, were not. The (M+H)+ signals of unsaturated TAG were always much stronger than those of saturated compounds. Most of the TAG species were in the C49 to C59 range, meaning that their most abundant FA residues varied from C16 to C22. The overall degree of unsaturation of detected TAG did not exceed 7 double bonds per one molecule of TAG (or two to three double bonds per FA chain). One of the most abundant species of TAG that was consistently observed in both TP and expressed meibum was a TAG with m/z 857.7642 (55 carbons total, 3 double bonds per molecule, molecular formula C55H100O6; theoretical m/z 857.7593 Da; detected as M+H+ adduct). Its structure was verified in MS/MS and MSE experiments which demonstrated that it was a mixture of isobaric isomers based on a combination of saturated and unsaturated C16, C18, and C20 FA residues. The following trend was observed: the overall number of double bonds in TAG tended to increase with their molecular weight, though no TAG species with more than 7 double bonds were detected. Importantly, the overall molecular fraction of the TAG pool in the TP extracts was at least an order of magnitude higher than that in the expressed meibum samples. A more detailed characterization of isomeric TAG is underway and will be published separately. However, the TAG profiles in TP of male and female mice were almost the same (Figure 11).
Figure 11. Triacylglycerols detected in mouse meibum and tarsal plate extracts.
Panel A. Observation mass spectrum of a triacylglycerol pool of a mouse tarsal plate extract
Panel B. Observation mass spectrum of a triacylglycerol pool in an expressed mouse meibum sample.
Panel C. Comparison of triacylglycerol pools of male and females mouse tarsal plate extracts (n=10, each group).
All data were obtained in positive ion mode as (M + H)+ adducts.
Amphiphilic Lipids.
PL [mostly, phosphatidylcholines (PC) and phosphatidylethanolamines (PE)] and SM were analyzed as described before [16]. The compounds were routinely observed in the TP extracts, and, to a much lesser extent, in expressed meibum. The overall PL and SM composition of these two types of samples was found to be the same, with random and insignificant variability in individual lipid species (not shown). Although we did not attempt absolute quantitation of these lipids (in weight or molar units per mg of tissue), their relative presence was estimated by calculating the apparent ratio of the combined abundances of PL and SM (detected by monitoring their common characteristic ion of phosphocholine m/z 184.2) to that of a characteristic, and major, meibomian lipid – a WE with m/z 619.6. For all tested samples of TP extracts, the apparent abundance of their (PC + PE + SM) fraction was ×10 to ×17 of that in the expressed meibum samples. Consequently, these lipids were severely reduced in the samples of expressed meibum. This result implies that: 1) PC, PE, and SM are not among the major lipids of mature meibum, and 2) most of these lipid species detected in our study samples originated, in fact, from other parts of the TP, such as tissues that surround meibomian glands, the Meibomian gland epithelium, glands of Zeis, and/or undifferentiated meibocytes.
An important observation was made with regard to the chemical nature of the detected PL and SM. It became evident that PC and PE were of an ordinary type with their individual FA chains being in the normal C16 to C22 length range (with the highest m/z value of 836.8, a proton adduct), while SM maxed out at C24:0 and C24:1 (species with m/z 815.7 and 813.7). Thus, these lipids did not follow the universal trend of meibomian lipids to be of extremely long nature, and, if detected in meibum, should be considered as either remnants of various membranes of ruptured meibocytes, or unused sources of carbon and energy for meibogenesis. Because of these facts, no further attempts to characterize PL and SM in our study samples were made at this time.
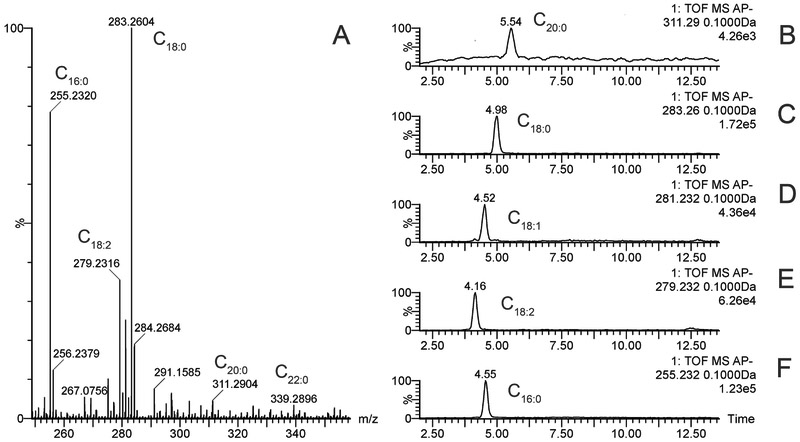
Another type of amphiphilic lipids that were present in mouse samples were free FA (FFA). These lipid species included the following major FFA: C16:1, C16:0, C18:2, C18:1, and C18:0-C22:0 (Figure 12). Other species of FFA were also detected, but their abundances were too low for reliable identification. Also, it was noted that the balance of these FFA in the mouse TP was quite variable and changing from sample to sample. A male vs. female comparison of the FFA composition of TP extracts did not reveal any trend.
Figure 12. Free fatty acids of mouse meibum.
Panel A. Observation mass spectrum of a free fatty acid fraction of mouse meibum.
Panel B-F. Extracted ion chromatograms of ions m/z 269 (C17:0-FA), 253 (C16:1-FA), 279 (C18:2-FA), 281 (C18:1-FA), and 283 (C18:0-FA).
All data were obtained in negative ion mode as (M − H) ions.
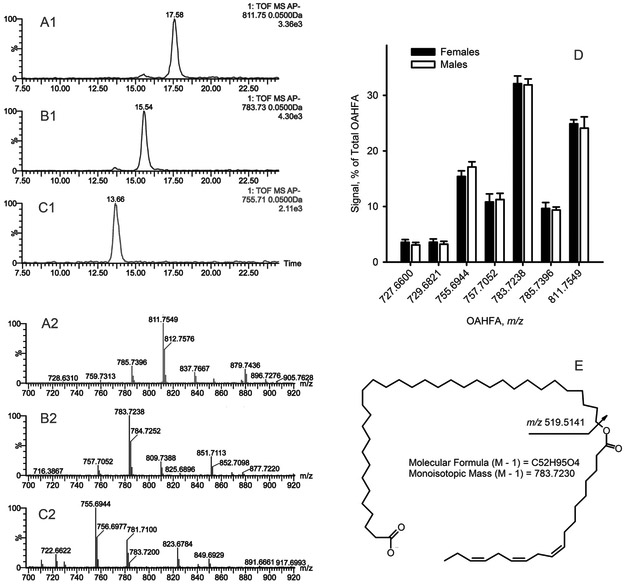
Several main species of OAHFA found in mouse samples are shown in Figure 13 and Table S4. The overall makeup of the OAHFA fraction was very repeatable from animal to animal within their respective sex groups. No meaningful statistically significant differences in the makeup of the OAHFA families of lipids between males and females were found, either (Figure 13, Panel D).
Figure 13. Major species of OAHFA detected in mouse female and male tarsal plate extracts.
All experiments were conducted in negative ion mode. Analytes were detected as (M − H) ions.
Panels A1 and A2. The extracted ion chromatogram and the mass spectrum of OAHFA with m/z 811.7549 (molecular formula C54H100O4). Note the presence of coeluting homologous ions 785.7396 and 837.7667.
Panels B1 and B2. The extracted ion chromatogram and negative ion mode mass spectrum of OAHFA with m/z 783.7238 (molecular formula C52H96O4). Note the presence of coeluting homologous ions 757.7052 and 809.7388.
Panels C1 and C2. The extracted ion chromatogram and negative ion mode mass spectrum of OAHFA with m/z 755.6944 (molecular formula C50H92O4). Note the presence of a coeluting homologous ion 781.7200.
Panel D. Profiles of OAHFA in female and male mouse tarsal plate samples (n=10, each group).
Panel E. The fragmentation pattern of the OAHFA C52H96O4. The major isoforms is shown.
Quantitation of meibomian lipids.
Conveniently, by grouping most of the meibomian lipids in a few well-defined NP-HPLC elution peaks with very consistent retention times, it became possible to evaluate the overall meibomian lipid content of TP. For the purpose of this study, it is important to differentiate between lipids that represent the true meibomian lipidome (i.e. those that are found in expressed meibum), and lipids that originate from non-differentiated meibocytes and connective and other tissues that form the TP per se. This can easily be achieved by comparing the lipidomes of expressed meibum with the lipidome of the whole TP. In this respect, NP-HPLC on a Diol column with APCI detection of the analytes in PIM proved to be the most convenient approach because of rather short RT of 3-5 min for the vast majority of meibomian lipids and good ionizability of the major analytes (Figure 2): the main HPLC peak was composed of all WE, CE, Chl-OAHFA, and TAG, while free Chl formed a minor peak with a longer RT of 6 to 8 min. Importantly, the free Chl content of expressed mouse meibum was quite low at ≤1 % (w/w). The relative amounts of various Cer, PL, and SM, being almost nonexistent in meibum and originating mainly from the surrounding tissues and non-differentiated meibocytes, varied somewhat from sample to sample, primarily because of the differences in sizes of whole TP specimens. Their lipid content was evaluated, but was deemed to be of marginal interest for this study because those lipids were not true representatives of mature meibum, and resembled the lipidome of an average cell which is dominated by PL, SM, TAG, Cer and free Chl. Also, their much longer retention times under the conditions of Diol HPLC, automatically excluded them from being a part of the main HPLC peaks shown in Figure 2 and S1. Thus, the average total meibomian lipid content of TP was estimated by comparing their TIC with chromatograms of a standard lipid mixture (Figure 2 and S1). Importantly, the overall lipid content of a female TP was found to be ~53% of that of a male one, with a standard deviation of ±19% for females and ±17% for males (p < 0.001). On average, a female mouse TP produced about 12 μg of meibomian-type lipids, while the male one – about 23 μg. The data suggest that the apparent differences in the physical sizes of male and female mouse TP (the male ones are noticeably larger) correlated with the overall amount of extractable meibomian lipid material.
Gene expression patterns in tarsal plates of male and female mice.
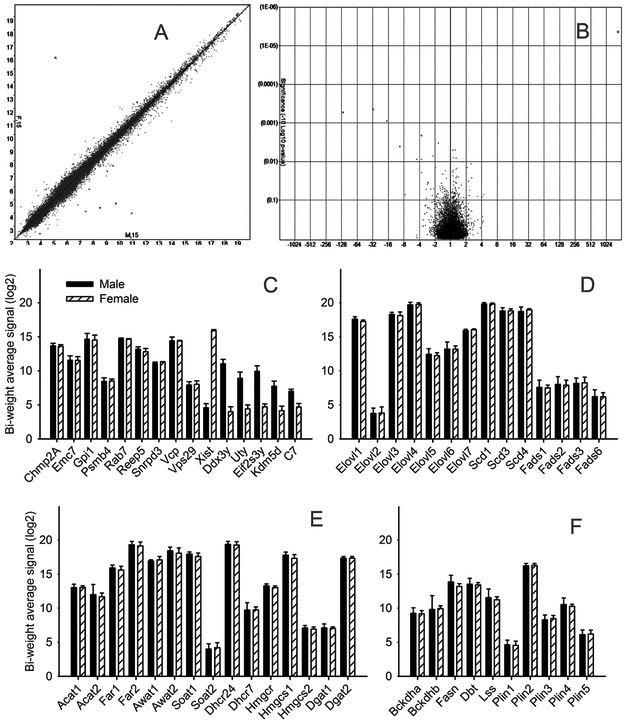
Microarray expression analyses of male and female mouse samples, performed using the Transcriptome Analysis Console (v.3.1.0.5), demonstrated that, generally, there were no discernible sex-specific variations in the expression levels of the vast majority of the genes. When default settings (ANOVA p-value <0.05; linear fold change ≥2) were applied to female and male datasets, only a handful of genes were found to be differentially expressed, namely C7, Ccl17, Ear12, Kdm6a, Krtap19-2, Serpina3n, Tcrg-C3, Trgj3, Trgj1, and Tcrg-C1 (Figure 14, Panels A and B). None of these genes is known to be directly linked to lipogenesis in general and meibogenesis specifically. The rest of the almost 66,000 transcripts in male and female samples were deemed to be expressed at the same levels, pair-wise.
Figure 14. Gene expression patterns in meibomian glands of male and female mice (n=15 each group).
Panel A. Correlation analysis of mRNA female (F, 15) and male (M, 15) tarsal plates.
Panel B. The Volcano plot
Panel C. The expression patterns of the main house-keeping and reference genes.
Panel D. Genes related to fatty acid elongation and desaturation.
Panel E. Genes related to biosynthesis of wax esters and cholesteryl esters.
Panel F. Genes related to biosynthesis of branched chain lipids and lipid storage.
Common reference genes – Chmp2A, Emc7, Gpi1, Psmb4, Rab7, Reep5, Snrpd3, Vcp, and Vps29 [23] – were expressed in both male and female TP specimens at the same levels (Figure 14, Panel C). On the contrary, known sex-specific genes – Xist, Ddx3y, Uty, Eif2s3y, and Kdm5d – showed expectedly large differences in their expression levels, with a female-specific non-protein coding Xist (X-inactive specific transcript) showing the widest split (4.6 for males, and 15.9 for females, on a Log2 scale). Note that all genes showed extremely tight levels of expression, within their respective sex groups.
When a more stringent criterion of a linear fold change of ≥1 was applied, the list of differentially expressed genes was amended by the following new entries: Ccl9, Ddx21, Dse, Eif2s3x, Fam136a, Gk, Gm11995, Gm12372, Gm12551, Gm13178, Gm22009, Gm26180, Gm6304, Hsd3b6, Kansl2-ps, Krtap14, Lipm, LOC100862325, Lonp2, Ms4a6c, Pea15a, Pex19, Plet1, Ptgs2, Sap30, Tmem171, and Traj55. Several genes from these lists are related to lipid metabolism in general, including Gk (glycerol kinase; expression levels as Females (Log2)/Males (Log2) = 12.5/13.0), Hsd3b6 (hydroxy-Δ5-steroid dehydrogenase or steroid Δ-isomerase 6; 15.9-15.4), Lipm (lipase, family member 5; 15.9/15.6), and Ptgs2 (prostaglandin-endoperoxide synthase 2; 6.1/6.6).
Next, we performed a more targeted analysis of GEP focusing on proteins that are expected be linked to meibogenesis [9, 10]. Several hundred genes of interest were selected for the analyses, the full description of which will be published elsewhere. In this study, we focused on the main protein-coding families of genes that have been implicated in various aspects of meibogenesis, all of which were highly expressed in the mouse tarsal plates, but demonstrated no significant differences in their expression levels in male and female specimens (0.1<<p≤1). As an example, a list of the top 25 meibogenesis-related genes are presented next. The list includes the following genes and their expression levels expressed as Females (Log2)/Males (Log2): Elovl4 (19.93/19.93), Scd1 (19.93/19.93), Dhcr24 (19.71/19.70), Far2 (19.47/19.47), Scd4 (19.08/18.88), Scd3 (19.03/19.03), Awat2 (18.73/18.73), Elovl3 (18.53/18.50), Soat1 (18.01/17.96), Hmgcs1 (17.58/17.46), Scd2 (17.56/17.53), Dgat2 (17.36/17.2), Elovl1 (17.33/17.17), Awat1 (17.19/16.95), Plin2 (16.41/16.09), Far1 (16.07/16.04), Elovl7 (15.94/15.75), Dbt (13.72/13.3), Fasn (13.38/12.91), Hmgcr (13.15/13.16), Acat1 (12.95/12.66), Elovl6 (12.78/12.92), Elovl5 (11.90/12.22), Acat2 (11.22/10.97), and Lss (11.02/10.43). A side-by-side comparison of several groups of genes implicated in meibogenesis is illustrated in Figure 14, Panels D, E and F).
DISCUSSION
In this study, our goal was to conduct the first in depth comparison of male and female meibum samples collected from age- and diet-matched wild-type mice with matched genetic background. However, this task could not have been accomplished without proper characterization of the mouse meibomian lipidome in general.
The age of study mice was intentionally chosen to be 2–2.5 months as this is an age when the Meibomian glands are already fully developed [24] and mice are mature and sexually active (per "Guidelines for the Establishment and Use of Mouse Breeding Groups", Animal Research Advisory Committee, Office of Animal Care and Use, NIH;https://oacu.oir.nih.gov/sites/default/files/uploads/arac-guidelines/breeding_groups.pdf). Moreover, this is the recommended age for breeding purposes (six to eight weeks old, according to the recommendations of The Jackson Laboratory; https://www.jax.org). Mice of this age are considered to be "adults" [24]. Thus, these mice were a logical starting point for establishing baselines for metabolomic and other types of studies, which will later be used to evaluate the effects of other factors such as aging, hormones, etc., as young mice are less likely to develop any kinds of metabolic abnormalities and skew the results of experimental observations.
Until recently, the actual lipid composition of mouse meibum was not characterized in detail. However, fast advances in mass spectrometry of lipids in general, and meibum of humans and animals specifically, made it possible to reveal the major components of mouse meibomian gland secretions and conclude that they are quite similar to those of humans [8, 9, 10]. One of the reported noticeable differences between mice and humans is the fact that the predominant unsaturated FA in mouse meibomian WE is a C16:1 FA (palmitoleic and/or, possibly, sapienic acids) [8, 9], while in humans it is a C18:1 oleic acid [15, 18]. The former observation was re-confirmed in the current study for all tested animals by using LC-MS and GC-MS. This is in contrast to the results of Sassa et al. [20], who stated that oleic acid was the major unsaturated FA in the WE fraction of mouse meibomian gland secretions. However, the apparent discrepancy between the study of Sassa et al. and our findings can easily be explained if one considers that Sassa et al. designed their mass spectrometric experiments assuming that oleic acid was the major unsaturated FA in mouse meibum, which adversely affected the outcomes of their study. Specifically, the ESI MS protocol implemented by Sassa et al. was designed to detect an ion m/z 264.9, apparently a product of the following sequential MS/MS fragmentation reactions: Lipid Precursor → m/z 283.3 (oleic acid + H+) → m/z 265.3 (oleic acid − H2O + H+). Regardless of the discrepancy between the theoretical m/z value (265.2531) and the reported one (264.9) of the latter ion, the implemented protocol left undetected all C16:1-FA-based members of the meibomian WE family, such as those that are described in this paper (Figures 3-6), and which were reported in our earlier publications as well [8, 9, 10, 15, 18]. In fact, the overall ratio of C16:1-FA- to C18:1-FA-based WE was found to be about 4 to 1, in our experiments.
Moreover, Sassa et al. reported no fully saturated WE in mouse meibum. Our data (Figures 3-6), on the contrary, demonstrate that a large portion of mouse meibum is formed of fully saturated WE with straight chain and branched C15:0-C20:0 FA residues. Most likely, poor ionizability of saturated WE in the C18-UPLC/ESI-MS experiments of Sassa et al. left saturated lipids virtually undetectable. Also, mouse meibum has a pool of WE that is based on saturated FA and unsaturated fatty alcohols, also unreported by Sassa et al. Finally, cholesteryl esters of OAHFA were not detected, characterized, or quantitated in that paper either, in part because of the current lack of proper chemical standards of those compounds. Thus, the overall list and balance of lipids of mouse meibum are currently not complete, and the secretion needs to be re-characterized and re-quantitated in future studies.
A group of medium to moderately long chain FFA was consistently observed in both TP extracts and expressed meibum of experimental animals (Figure 12). The nature of these FFA – C16:1, C16:0, C18:2, C18:1, C18:0, C19:0, C20:0, C21:0, and C22:0 FA – implied that they might be either precursors of meibomian lipids, or products of degradation of PL, TAG, CE, and other complex lipids of meibum that contain these moieties. However, from the lack of evidence of the presence of longer FFA (e.g. C24 to C34) one can infer that these FFA might be either involved in earlier stages of meibogenesis (such as FA elongation), or be the products of degradation of PL and TAG. It remains unknown whether these compounds play any noticeable role in the physiology of the ocular surface, but if they do, it is most likely related to their surfactant properties [25].
We did not find any indication of the presence of abnormally long PL and SM in the tested specimens: SM had a normal distribution of their FA moieties (ranging from C16 to C24), while PC and PE had C14 to C22-long FA in their structures. Importantly, the PL/SM fraction in expressed meibum samples was always several orders of magnitude smaller than that of TP extracts. Because of the variability in the weight ratio of the connective tissue in the specimens to Meibomian glands per se, exact quantitation of these lipids was not performed.
Similar conclusions were made when we compared the chemical nature and molar ratios of TAG in expressed meibum and TP extracts. Again, it was found that the relative abundance of TAG in the TP extracts was considerably higher than that in expressed meibum, but their chemical makeup in both types of samples remained the same. These observations can be an evidence of the origin of TAG in meibum: normal-length TAG with C16-C22-FA residues are present in the connective tissue as typical lipids responsible for storing carbon and energy for cell metabolism. As with PL and SM, the overall makeup of TAG (Figure 11) varied from sample to sample considerably more than the makeup of true meibomian-type lipids, such as WE, CE, Chl-OAHFA, and others. This variability was expected because of the impact of the lipids of the connective tissues, secretions of the glands of Zeis, epithelial cells, undifferentiated meibocytes, and possible differences in the rates of metabolism of TAG in the tarsal plates of individual animals.
Yet another group of amphiphilic lipids – a family of OAHFA – was observed in every analyzed mouse sample. The compounds were mostly based on C34 and C36 ω-hydroxylated FA, that were (O)-acylated with either C16 or C18 FA. Typical representatives of the OAHFA fraction are shown in Figure 13 and Table S4. As with other meibomian lipids, the profiles and expression levels of OAHFA were found to be sex-independent indicating a tight control over their biosynthesis in the Meibomian glands regardless of sex.
Chl-OAHFA are closely related to OAHFA and are, most likely, produced by esterification of the latter in the same way normal CE are biosynthesized. An alternative mechanism where an ultra-long chain CE is ω-hydroxylated and then esterified with a C16-C20 FA seems to be less probable as we have seen no evidence of the presence of ω-hydroxylated ultra-long chain CE in meibum in our current experiments.
Overall, our untargeted (Figure S2) and targeted lipidomic experiments with meibum samples of female and male mice demonstrated no major differences between the sexes, except for the overall lipid content per TP, which was higher in males. The overall meibomian lipid profiles of female and male mice were virtually indistinguishable from each other on the level of major lipid species that were described above. Minor differences between the sexes were of the same magnitude as the interdonor differences within the two sex groups, and can hardly be attributed to the effects of sex itself.
Notably, transcriptomic analyses of male and female mouse tarsal plates demonstrated no differences in the expression patterns of genes implicated in meibogenesis beyond the limits of probable natural variability of their levels of expression (−1 < log(2) > 1). This observation corroborated our lipidomic data. Indeed, major genes related to meibogenesis (such as Elovl, Scd, Fads, Soat, Far, Awat, Acat, Lss, Dhcr, Hmgcr, Hmgcs, Dgat, Bckdh, Dbt, Fasn, and Plin, among others) were almost equally expressed in TP of male and female mice (Figure 14).
Though GEP of female and male TP did demonstrate minor preferences for certain genes (see Results), none of those differentially expressed genes (except for Hsd3b6) is clearly linked to meibogenesis as the enzymes and proteins they encode seem to be unrelated to making meibum-like compounds [9, 10]. We are not aware of any possible physiological roles of predicted genes Gm11995, Gm12372, Gm12551, Gm13178, Gm22009, Gm26180, and Gm6304, and a predicted, uncharacterized transcript LOC100862325. Yet, one cannot exclude a possibility of their involvement in meibogenesis via unidentified regulatory, signaling, or biosynthetic mechanisms and pathways.
Thus, one can conclude that the major biosynthetic pathways in the Meibomian glands of young adult age and diet-matched male and female mice function in a similar fashion and produce secretions of the same overall chemical composition. The effects of aging (another poorly characterized factor) on the same parameters will be evaluated and reported separately.
Supplementary Material
Figure S1. Quantitation of individual lipids using NP-HPLC on a Diol column and APCI-MS in the positive ion mode. Tested lipid analytes were detected as (M + H)+ adducts of wax esters (such as palmityl oleate, m/z 507.4; stearyl oleate, m/z 535.4; arachidyl oleate, m/z 563.5; behenyl oleate, m/z 591.5; and tetracosanyl oleate, m/z 619.5), squalene (m/z 411.5) and triacylglycerol triolein (m/z 885.7); (M − H2O + H)+ adducts of Chl, m/z 369.4; and (M − FA + H)+ adducts of CE, m/z 369.4. The latter two had HPLC retention times that differed by almost 4 minutes, that clearly separated one from the other. Palmityl palmitate was undetectable in these experiments due to poor ionizability.
Panel A. Repetitive injections of 2 × 5, 1, 10, and 15 μL of the 10uM standard lipid mixture recorded as TIC.
Panel B. Extracted ion chromatograms of tetracosanyl oleate, m/z 619.5
Panel C. Extracted ion chromatograms of triolein, m/z 885.7
Panel D. A typical observation spectrum of the standard lipid mixture.
Panels E- J. Standard curves for various injections of 10 μM lipid standards: TIC (E), free cholesterol (F), cholesteryl oleate (G), squalene (H), triolein (I), and tetracosanyl oleate (J), respectively. Open circles – experimental data; solid lines – linear regression lines with r2 > 0.996 for each graph, except squalene, for which the correlation coefficient was 0.933.
Figure S2. Initial comparison of expressed meibum of female and male wild-type C57Bl/6J mice using NP-HPLC/APCI-MS in positive ion mode.
Averaged mass spectra of 5 female and 5 male samples are shown.
Figure S3. Verification of the nature of the analytical ion m/z 369 detected in the mouse tarsal plate extracts using NP HPLC/APCI-MS/MS in positive ion mode.
Panel A. A fragmentation spectrum of ion m/z 369 detected in mouse samples.
Panel B. A fragmentation spectrum of ion m/z 369 produced by authentic cholesterol oleate.
ACKNOWLEDGEMENTS
The project has been supported in part by an NIH grant R01EY024324 (to IAB) and an unrestricted grant from Research to Prevent Blindness (New York, NY).
Footnotes
THE AUTHORS HAVE NO CONFLICTS OF INTEREST TO DISCLOSE
Publisher's Disclaimer: This is a PDF file of an unedited manuscript that has been accepted for publication. As a service to our customers we are providing this early version of the manuscript. The manuscript will undergo copyediting, typesetting, and review of the resulting proof before it is published in its final citable form. Please note that during the production process errors may be discovered which could affect the content, and all legal disclaimers that apply to the journal pertain.
References
- 1.Nicolaides N, Kaitaranta JK, Rawdah TN, Macy JI, Boswell FM 3rd, Smith RE. Meibomian gland studies: comparison of steer and human lipids. Invest Ophthalmol Vis Sci 1981;20:522–536. [PubMed] [Google Scholar]
- 2.Nelson JD, Shimazaki J, Benitez-del-Castillo JM, et al. The international workshop on meibomian gland dysfunction: report of the definition and classification subcommittee. Invest Ophthalmol Vis Sci 2011;52:1930–1937. [DOI] [PMC free article] [PubMed] [Google Scholar]
- 3.Souchier M, Joffre C, Gregoire S, et al. Changes in meibomian fatty acids and clinical signs in patients with meibomian gland dysfunction after minocycline treatment. Br J Ophthalmol 2008;92:819–822. [DOI] [PubMed] [Google Scholar]
- 4.Butovich IA, Lu H, McMahon A, et al. Biophysical and morphological evaluation of human normal and dry eye meibum using hot stage polarized light microscopy. Invest Ophthalmol Vis Sci 2014;55:87–101. [DOI] [PMC free article] [PubMed] [Google Scholar]
- 5.Arita R, Mori N, Shirakawa R, et al. Linoleic acid content of human meibum is associated with telangiectasia and plugging of gland orifices in meibomian gland dysfunction. Exp Eye Res 2016;145:359–362. [DOI] [PubMed] [Google Scholar]
- 6.Tomlinson A, Bron AJ, Korb DR, et al. The international workshop on meibomian gland dysfunction: report of the diagnosis subcommittee. Invest Ophthalmol Vis Sci 2011;52:2006–2049. [DOI] [PMC free article] [PubMed] [Google Scholar]
- 7.Shimazaki J Definition and Diagnostic Criteria of Dry Eye Disease: Historical Overview and Future Directions. Invest Ophthalmol Vis Sci 2018;59:DES7–DES12. [DOI] [PubMed] [Google Scholar]
- 8.Butovich IA, Lu H, McMahon A, Eule JC. Toward an animal model of the human tear film: biochemical comparison of the mouse, canine, rabbit, and human meibomian lipidomes. Invest Ophthalmol Vis Sci 2012;53:6881–6896. [DOI] [PMC free article] [PubMed] [Google Scholar]
- 9.Butovich IA, McMahon A, Wojtowicz JC, Lin F, Mancini R, Itani K. Dissecting lipid metabolism in meibomian glands of humans and mice: An integrative study reveals a network of metabolic reactions not duplicated in other tissues. Biochim Biophys Acta 2016;1861:538–553. [DOI] [PMC free article] [PubMed] [Google Scholar]
- 10.Butovich IA. Meibomian glands, meibum, and meibogenesis. Exp Eye Res 2017;163:2–16. [DOI] [PMC free article] [PubMed] [Google Scholar]
- 11.Stapleton F, Alves M, Bunya VY, et al. TFOS DEWS II Epidemiology Report. Ocul Surf 2017;15:334–365. [DOI] [PubMed] [Google Scholar]
- 12.Viso E, Rodriguez-Ares MT, Abelenda D, Oubina B, Gude F. Prevalence of asymptomatic and symptomatic meibomian gland dysfunction in the general population of Spain. Invest Ophthalmol Vis Sci 2012;53:2601–2606. [DOI] [PubMed] [Google Scholar]
- 13.Sriprasert I, Warren DW, Mircheff AK, Stanczyk FZ. Dry eye in postmenopausal women: a hormonal disorder. Menopause 2016;23:343–351. [DOI] [PubMed] [Google Scholar]
- 14.Versura P, Campos EC. Menopause and dry eye. A possible relationship. Gynecol Endocrinol 2005;20:289–298. [DOI] [PubMed] [Google Scholar]
- 15.Butovich IA, Uchiyama E, McCulley JP. Lipids of human meibum: mass-spectrometric analysis and structural elucidation. J Lipid Res 2007;48:2220–2235. [DOI] [PubMed] [Google Scholar]
- 16.Butovich IA. Lipidomic analysis of human meibum using HPLC-MSn. Methods Mol Biol 2009;579:221–246. [DOI] [PubMed] [Google Scholar]
- 17.Butovich IA. Cholesteryl esters as a depot for very long chain fatty acids in human meibum. J Lipid Res 2009;50:501–513. [DOI] [PMC free article] [PubMed] [Google Scholar]
- 18.Butovich IA, Wojtowicz JC, Molai M. Human tear film and meibum. Very long chain wax esters and (O-acyl)-omega-hydroxy fatty acids of meibum. J Lipid Res 2009;50:2471–2485. [DOI] [PMC free article] [PubMed] [Google Scholar]
- 19.Butovich IA, Arciniega JC, Lu H, Molai M. Evaluation and quantitation of intact wax esters of human meibum by gas-liquid chromatography-ion trap mass spectrometry. Invest Ophthalmol Vis Sci 2012;53:3766–3781. [DOI] [PMC free article] [PubMed] [Google Scholar]
- 20.Sassa T, Tadaki M, Kiyonari H, Kihara A. Very long-chain tear film lipids produced by fatty acid elongase ELOVL1 prevent dry eye disease in mice. Faseb J 2018;32:2966–2978. [DOI] [PubMed] [Google Scholar]
- 21.Butovich IA. Fatty acid composition of cholesteryl esters of human meibomian gland secretions. Steroids 2010;75:726–733. [DOI] [PMC free article] [PubMed] [Google Scholar]
- 22.Nicolaides N, Santos EC. The di- and triesters of the lipids of steer and human meibomian glands. Lipids 1985;20:454–467.3333 [DOI] [PubMed] [Google Scholar]
- 23.Eisenberg E, Levanon EY. Human housekeeping genes, revisited. Trends Genet 2013;29:569–574. [DOI] [PubMed] [Google Scholar]
- 24.Nien CJ, Massei S, Lin G, Liu H, Paugh JR, Liu CY, Kao WW, Brown DJ, Jester JV. The development of meibomian glands in mice. Mol Vis 2010;16:1132–1140 [PMC free article] [PubMed] [Google Scholar]
- 25.Arciniega JC, Nadji EJ, Butovich IA. Effects of free fatty acids on meibomian lipid films. Exp Eye Res 2011;93:452–459. [DOI] [PMC free article] [PubMed] [Google Scholar]
Associated Data
This section collects any data citations, data availability statements, or supplementary materials included in this article.
Supplementary Materials
Figure S1. Quantitation of individual lipids using NP-HPLC on a Diol column and APCI-MS in the positive ion mode. Tested lipid analytes were detected as (M + H)+ adducts of wax esters (such as palmityl oleate, m/z 507.4; stearyl oleate, m/z 535.4; arachidyl oleate, m/z 563.5; behenyl oleate, m/z 591.5; and tetracosanyl oleate, m/z 619.5), squalene (m/z 411.5) and triacylglycerol triolein (m/z 885.7); (M − H2O + H)+ adducts of Chl, m/z 369.4; and (M − FA + H)+ adducts of CE, m/z 369.4. The latter two had HPLC retention times that differed by almost 4 minutes, that clearly separated one from the other. Palmityl palmitate was undetectable in these experiments due to poor ionizability.
Panel A. Repetitive injections of 2 × 5, 1, 10, and 15 μL of the 10uM standard lipid mixture recorded as TIC.
Panel B. Extracted ion chromatograms of tetracosanyl oleate, m/z 619.5
Panel C. Extracted ion chromatograms of triolein, m/z 885.7
Panel D. A typical observation spectrum of the standard lipid mixture.
Panels E- J. Standard curves for various injections of 10 μM lipid standards: TIC (E), free cholesterol (F), cholesteryl oleate (G), squalene (H), triolein (I), and tetracosanyl oleate (J), respectively. Open circles – experimental data; solid lines – linear regression lines with r2 > 0.996 for each graph, except squalene, for which the correlation coefficient was 0.933.
Figure S2. Initial comparison of expressed meibum of female and male wild-type C57Bl/6J mice using NP-HPLC/APCI-MS in positive ion mode.
Averaged mass spectra of 5 female and 5 male samples are shown.
Figure S3. Verification of the nature of the analytical ion m/z 369 detected in the mouse tarsal plate extracts using NP HPLC/APCI-MS/MS in positive ion mode.
Panel A. A fragmentation spectrum of ion m/z 369 detected in mouse samples.
Panel B. A fragmentation spectrum of ion m/z 369 produced by authentic cholesterol oleate.


