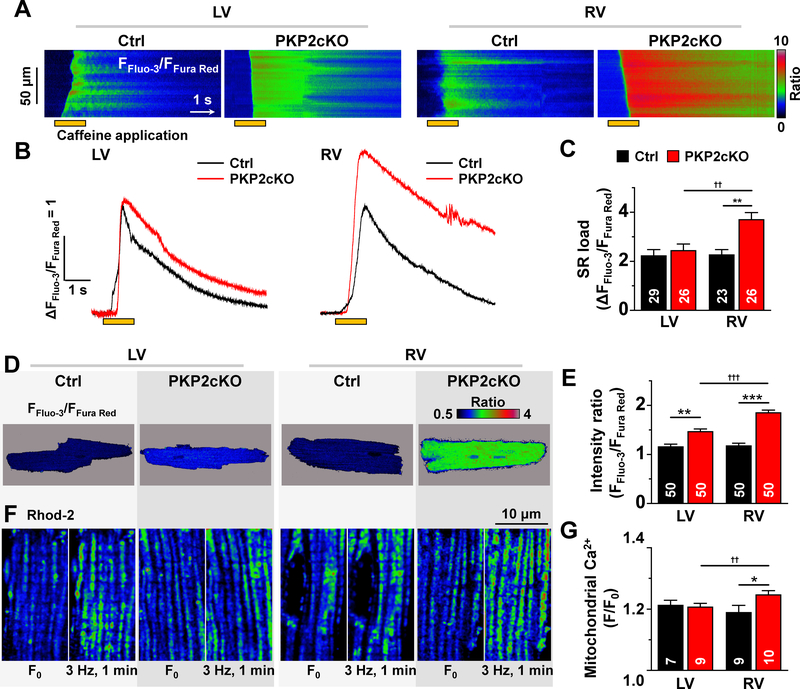
Figure 5. Ca2+ content in the intracellular compartments.
A: Confocal line-scan images (1.43 ms/line) recorded from non-permeabilized myocytes isolated from the free walls of the left ventricle (LV) or the right ventricle (RV) of either control (Ctrl) or plakophilin-2 conditional knockout (PKP2cKO) mice 14 days post-tamoxifen (post-TAM). In this and other panels, the pulse of caffeine (10 mM) is indicated by the orange bar at the bottom of the image. Intracellular calcium changes were detected by a ratiometric method (FFluo-3/FFura Red; see also “Methods”). B: Time course and amplitude of the change in fluorescence during and immediately following the caffeine pulse. Notice the larger amplitude of the transient recorded from PKP2cKO RV myocytes. Cumulative data are shown in C. Number of experiments noted in the bar graphs. Cells originated from 5 different mice in each group (Ctrl or PKP2cKO). Statistical test: Two-way repeated measures analysis of variance (ANOVA)-Bonferroni. Control: n=29 LV cells, 23 RV cells. PKP2cKO: n=26 LV cells, 26 RV cells. **p<0.01 vs. control, ††p<0.01 vs. LV. D: Pseudo-colored confocal 2D images of the ratio of emission intensities (FFluo-3/FFura Red; see also “Methods”). The average of the calculated intensity ratios are shown in panel E. Statistical test: Hierarchical analysis. Control: n=50 LV cells, 50 RV cells from 5 mice. PKP2cKO n=50 LV cells, 50 RV cells from 5 mice. **p<0.01 vs. control ***p<0.001 vs. control, †††p<0.001 vs. LV. F: Confocal 2-D images of cardiomyocytes loaded with 2 μM Rhod 2-AM at low termperature (4°C) and then incubated at 37°C for 4 hours (see also “Methods”). For each group, two images from the same cell are shown: at rest (F0; left), and after one minute stimulation at 3 Hz (right). Notice the increased number of fluorescence emission units (mitochondria) after stimulation, particularly in the cell from the PKP2cKO RV. G: Average of the ratio of Rhod-2 fluorescence intensities acquired before (F0) and after (F) the period of pacing. Control (Ctrl): n=7 LV cells, 9 RV cells from 2 mice. PKP2cKO: n=9 LV cells, 10 RV cells from 2 mice. Statistical test: Two-way repeated measures ANOVA-Bonferroni. *p<0.05 vs. control, ††p<0.01 vs. LV.

