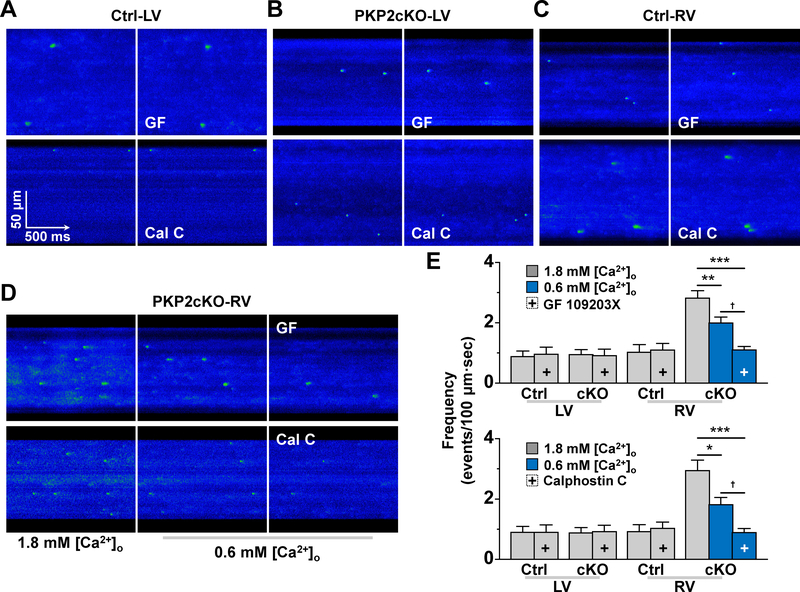
Figure 6. Spark frequency at equal sarcoplasmic reticulum (SR) load and effect of PKC inhibition.
A-D: confocal line-scan images of Ca2+ sparks (green) in Control (Ctrl; A and C) or plakophilin-2 conditional knockout (PKP2cKO) samples (B and D) obtained from the left ventricle (LV; A and B) or the right ventricle (RV; C and D). Panel D shows sparks obtained when cells were maintained in either 1.8 mM [Ca2+]o (left) or in 0.6 mM [Ca2+]o (middle and right panels). In panels A-D, right-most panel corresponds to data obtained in the presence of protein kinase C (PKC) inhibitors bisindolylmaleimide I (GF 109203X; labelled GF; top) or Calphostin C (labelled Cal C; bottom). Panel E: Spark (spontaneous calcium release or SCR) events measured under the various conditions. + indicates in the presence of the PKC inhibitor (GF 109203X in top panel; Calphostin C in bottom panel). Blue bars: data obtained at 0.6 mM [Ca2+]o. All experiments were carried out in sequence on the same cell: recordings at [Ca2+]o 1.8 mM, then switched to 0.6 mM [Ca2+]o (for PKP2cKO RV) and then addition of PKC inhibitor. Each group was treated separately and only one variable (SCR frequency) was measured. cKO means plakophilin-2 conditional knockout. Paired sample t-test for Control LV, Ctrl RV, PKP2cKO–LV (same cell compared before and after treatment). One-way repeated measures analysis of variance (ANOVA)-Bonferroni for PKP2cKO-RV (same cell compared at [Ca2+]o 1.8 mM, then at 0.6 mM [Ca2+]o and then treatment). For experiments with GF 109203X: Control n=8 LV cells, 9 RV cells from 3 mice. PKP2cKO n=6 LV cells, 15 RV cells from 3 mice. **p<0.01. ***p<0.001 vs. 1.8 mM [Ca2+]o, †p<0.05 vs. 0.6 mM [Ca2+]o For experiments with Calphostin C: Control n=9 LV cells, 7 RV cells from 3 mice. PKP2cKO n=11 LV cells, 13 RV cells from 3 mice. *p<0.05, ***p<0.001 vs. 1.8 mM [Ca2+]o, †p<0.05 vs. 0.6 mM [Ca2+]o.

