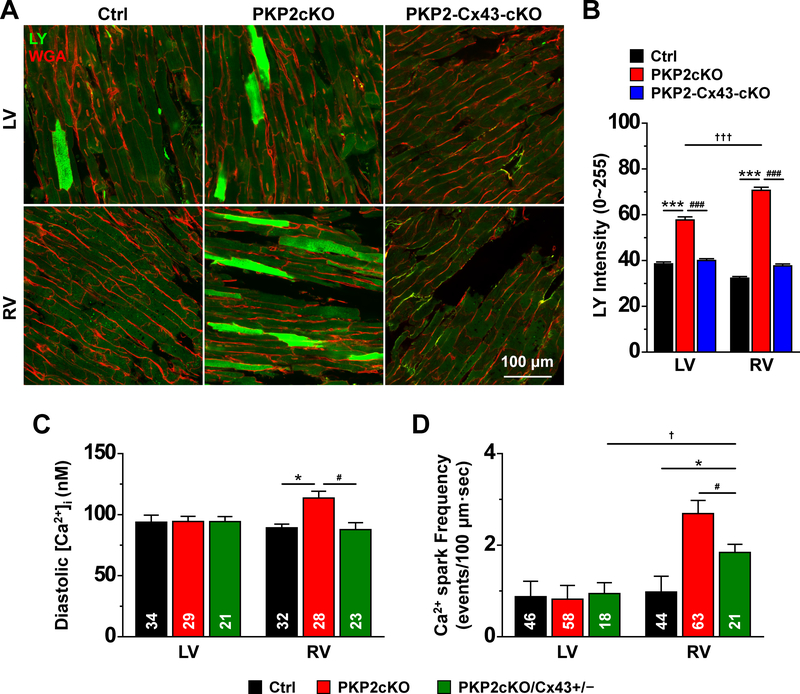
Figure 7. Membrane permeability to Lucifer Yellow and Cx43 expression.
A: Confocal images collected from the epicardial phase of either the free walls of the left ventricle (LV) or the right ventricle (RV) of hearts harvested from control (Ctrl), plakophilin-2 conditional knockout (PKP2cKO) mice 14 days post-tamoxifen (post-TAM) or a double knockout of PKP2 and Cx43, also at 14 days post-TAM (PKP2-Cx43-cKO). Images were obtained after a 30-min perfusion with 1 mg/mL Lucifer Yellow (LY; molecular weight 457; green), 1 mg/mL Rhodamine Dextran (molecular weight ~10,000) and 0.04 mg/mL Wheat Germ Agglutinin (WGA; red) in 10 nM free [Ca2+] solution (see “Methods” for further details). Image fields were chosen at random and the intensity of the LY fluorescence (in a scale 0–225) was measured within regions of interest (ROIs) that excluded areas void of cells. B: Average LY intensity measured from cells in the following groups: Control (Ctrl; black bars; n=512 LV cells, 774 RV cells from 3 mice), PKP2cKO (red bars; n=763 LV cells, 812 RV cells from 3 mice) and PKP2-Cx43-cKO (blue bars; n=617 LV cells, 729 RV cells from 2 mice). Statistical test: Two-way repeated measures analysis of variance (ANOVA)-Bonferroni ***p<0.001 vs. control; †††p<0.001 vs. LV; ###p<0.001 vs. PKP2cKO. C: Mean of the calculated values of [Ca2+]i after calibration of intensity ratios (see “Methods” for details). Control: n=34 LV cells, 32 RV cells from 4 mice. PKP2cKO n=29 LV cells, 28 RV cells from 4 mice. PKP2cKO/Cx43+/− refers to a PKP2cKO mice also heterozygous-null for Cx43 in cardiomyocytes (see also Methods). n=21 LV cells, 23 RV cells from 3 mice. Statistical test: Hierarchical analysis. *p<0.05 vs. control; #p<0.05 vs. PKP2cKO. D: Ca2+ spark frequency is significantly dampened by reduced Cx43 expression (green bar). Note that data for RV and LV Ctrl and PKP2cKO is reproduced from previous figures and presented here for comparison against PKP2cKO/Cx43+/−. Hierarchical analysis: PKP2cKOCx43+/−: n=18 LV cells, 21 RV cells from 3 mice. *p<0.05 vs. control; †p<0.05 vs. LV; #p<0.05 vs. PKP2cKO.

