

Abstract
Oxidized phospholipids play essential roles in execution of mitochondrial stage of apoptosis and clearance of apoptotic cells. The identification and quantification of oxidized phospholipids generated during apoptosis can be successfully achieved by oxidative lipidomics. With this approach, diverse molecular species of phospholipids and their hydroperoxides are identified and characterized by soft-ionization mass-spectrometry techniques such as electrospray ionization (ESI). Quantitative assessment of lipid hydroperoxides is performed by fluorescence HPLC-based protocol. The protocol is based on separation of phospholipids using two-dimensional-high-performance thin-layer chromatography (2-D-HPTLC). Phospholipids are hydrolyzed using phospholipase A2. The fatty acid hydroperoxides (FA-OOH) released is quantified by a fluorometric assay using Amplex red reagent and microperoxidase-11 (MP-11). Detection limit of this protocol is 1–2 pmol of lipid hydroperoxides. Lipid arrays vs. oxidized lipid arrays can be performed by comparing the abundance of phospholipids with the abundance of oxidized phospholipids. Using oxidative lipidomics approach we show that the pattern of phospholipid oxidation during apoptosis is nonrandom and does not follow their abundance in several types of cells undergoing apoptosis and a variety of disease states. This has important implications for evaluation of apoptosis in vivo. The anionic phospholipids, cardiolipin (CL) and phosphatidylserine (PS), are the preferred peroxidation substrates.
Keywords: Phospholipid hydroperoxides, cardiolipin, phosphatidylserine, ESI-MS, fluorescence HPLC, apoptosis, cytochrome c, controlled cortical impact, gamma-irradiation, Alzheimer’s disease
1. Introduction
While lipids are relatively small biomolecules, their amphipathic nature makes them essential for compartmentalization and heterogeneous catalysis of life reactions in cells, tissues, and biofluids. The large diversity and metabolic conversions of lipids form the basis of biomembranes with their unique features of structural and functional flexibility and fluidity resulting in a broad range of adaptive mechanisms (including generation of a host of signaling molecules). These important features of lipids are largely due to the presence of double bonds in their hydrophobic moieties. This, in turn, makes lipids susceptible to oxidative modifications by molecular oxygen. Effective control of oxidative stress is one of the adaptive evolutionary achievements of aerobic life essential for the prevention and protection against toxicity of environmental chemical and biological hazards, degenerative diseases, and even aging (1). During oxidative stress, different types of molecules in cells and biofluids undergo peroxidation. One of the most common manifestations of oxidative stress is peroxidation of lipids in biomembranes and lipoproteins. Lipid peroxidation is considered as a deleterious process resulting in disruption of well-coordinated structural and functional organization of biomembranes. However, there is emerging understanding of new signaling roles that oxidized lipids may play in cell physiology.
Until recently, comprehensive analysis of different classes of lipids and their molecular species in cells, tissues, and biofluids was cumbersome and difficult if not impossible. However, with the advent of contemporary mass spectrometry and development of new soft-ionization techniques, identification and structural characterization of individual phospholipid molecules in complex mixtures became possible (2). These technological advancements designated the emergence of a new field of research and knowledge – lipidomics. The latter can be defined as “a branch of metabolomics that includes a systems-based study of all lipids, the molecules with which they interact, and their function within the cell” (2). Thus, lipidomics approach consists of analysis of the entire lipidome and lipid related metabolites, as well as characterization, and quantification of changes in the lipidome in response to internal and external stimuli such as alteration in nutritional status or under disease conditions (3). Application of principles and approaches of lipidomics to studies of oxidatively modified lipids yielded the area of oxidative lipidomics. Similar to lipidomics, the oxidative lipidomics includes identification and characterization of oxidatively modified lipids by MS, quantitative analysis of their content in cells, tissues, and biofluids as well as discovery of mechanisms and pathways through which they interact with other molecules and contribute to metabolism and physiological functions.
Soft-ionization techniques such as electrospray ionization (ESI) and matrix assisted laser desorption ionization (MALDI) can be successfully utilized for this purpose. However, vast diversity and relatively low quantity of peroxidized molecular species of phospholipids make MS analysis of oxidatively modified lipids technically challenging (4). In spite if this, we and others successfully utilized different MS protocols to detect and identify the major oxidized species of phospholipids of normal and injured cells and tissues (5–9). In our experience, after identification and characterization of individual molecular species of oxidatively modified phospholipids by MS, quantification of their content can be conveniently achieved by the assessment of hydroperoxides, the primary molecular products of phospholipid peroxidation, by high-performance liquid chromatography (HPLC). Comparison of the abundance of phospholipids with their respective hydroperoxides yields phospholipid/oxidized phospholipid arrays. This paper describes application of this methodology to analysis of phospholipid oxidative signaling in apoptosis.
Programmed cell death or apoptosis is viewed as an important adaptive evolutionary mechanism that allows eukaryotic cells in a multicellular organism to prevent proliferation of their dangerously modified genomes by self-elimination program (10). Mitochondria with their tool-set of pro-apoptotic factors play a central role in the execution of this program (11). Mitochondrial stages of apoptosis include the disruption of electron transport and enhanced generation of one-electron-reduced species of molecular oxygen (also called reactive oxygen species (ROS)) culminating in the release of cytochrome c (cyt c) and other dreadful proapoptotic factors from mitochondria into the cytosol (12). This results in mobilization and activation of cell’s proteolytic enzymes ultimately leading to disassembly of essential bio-macromolecules into small fragments. Two important participants of this program are cyt c and cardiolipin (CL), specific components normally not found outside of mitochondria. Interactions between cyt c and CL within mitochondria and their role in triggering programmed cell death are not fully understood.
Recently, it has been established that binding of cyt c to anionic phospholipids – CL and PS – converts it into a peroxidase capable of utilizing these phospholipids as reaction substrates, ultimately leading to accumulation of their hydroperoxides (13, 14). Both oxidized phospholipids act as important signals in mitochondria and plasma membrane of apoptotic cells, respectively. While oxidized CL is required for the release of apoptotic factors into the cytosol, oxidized PS functions as a regulator of externalization of PS which is recognized by phagocytes as an “eat-me” signal and facilitates clearance of apoptotic cells (15–17). Not surprisingly, overexpression of mitochondrial antioxidant enzymes regulating phospholipid oxidation such as phospholipid hydroperoxide glutathione peroxidase inhibits release of cyt c from mitochondria likely by suppressing the oxidation of CL during apoptosis (18, 19). Similarly, lipid antioxidants effectively preventing PS oxidation inhibit PS externalization thus affecting phagocytosis of apoptotic cells (20). Therefore, understanding the mechanisms of CL and PS oxidation and analysis of their oxidation products is central to elucidating the events leading to execution of the mitochondria-dependent apoptosis and clearance of apoptotic cells. Recently, Girotti and coauthors (14–21) described a method for determination of phospholipid oxidation products (PL-OOH) based on separation of PL-OOH by HPTLC with their subsequent detection using staining with N, N,N′, N′-tetramethyl-p-phenylenediamine (TPD). The detection limit of PL-OOH by this method is 100–200 pmol. While the protocol may be useful for analysis of relatively high concentrations of PL-OOH, its utility for the analysis of low endogenous levels of CL and PS oxidation products accumulating during execution of apoptotic program may be limited by insufficient sensitivity.
To characterize phospholipid oxidation generated during apoptosis we applied oxidative lipidomics approach that includes identification of diverse molecular species of phospholipids by ESI-MS analysis (22, 23) followed by quantitative assessments of lipid hydroperoxides using fluorescence HPLC-based protocol. The protocol is based on separation of phospholipids using 2-D-HPTLC. Phospholipids are hydrolyzed using phospholipase A2 (PLA2). The FA-OOH released are quantified by a fluorometric assay using Amplex red reagent (10-acetyl-3,7-dihydroxyphenoxazine) and MP-11. In this system, FA-OOH react with Amplex red reagent at a stoichiometry of 1:1 to generate a fluorescent product, resorufin (ex 560 = nm, em = 590 nm), analyzed by fluorescence HPLC. Using the protocol, 1–2 pmol of lipid hydroperoxides can be reliably detected in lipid extracts from different types of cells and tissues.
2. Materials
2.1. Reagents and Solvents
All organic solvents were of HPLC grade and obtained from Sigma Chemical Co (St. Louis, MO).
Unless otherwise indicated, all reagents were purchased from Sigma Chemical Co (St. Louis, MO).
2.2. Standards
1,2-Dioleoyl-sn-glycero-3-phosphocholine (DOPC, PC), 1-palmitoyl-2-arachidonoyl-sn-glycero-3-phospho-l-serine (PAPS, PS), 1,1′,2,2′-tetraoleoylcardiolipin (TOCL), 1,1′, 2,2′-tetralinoleoyl-cardiolipin (TLCL), 1-palmitoyl-2-linoleoyl-sn-glycero-3-phosphoethanolamine (PE), 1,2-dioleoyl-sn-glycero-3-phosphoinositol (PI), N-stearoyl-d-erythro-sphingosylphosphorylcholine (Sphingomyelin, Sph) were purchased from Avanti Polar Lipids Inc (Alabaster, AL) and were of the highest purity available.
9Z-Octadecenoic acid, 9Z, 12Z-octadecadienoic acid, 5Z, 8Z, 11Z, 14Z-eicosatetraenoic acid, 15S-hydroxy-5Z, 8Z, 11Z, 13E, 17Z-eicosapentaenoic acid, (15(S)-HEPE), 9E, 11Z-octadecadienic acid, 13-oxo-, (13-Oxo-ODE), (±)8 (9)-epoxy-5Z, 11Z, 14Z-eicosatrienoic acid, (8(9)-EpTrE), 9S-hydroperoxy-10E, 12Z-octa-decadienoic acid, (9(S)-HpODE), 13S-hydroperoxy-10E, 12Z-octadecadienoic acid, (13(S)-HpODE), 15S-hydroperoxy-5Z, 8Z, 11Z, 13E-eicosatetraenoic acid, (15(S)-HpETE) were obtained from Cayman Chemical Co (Ann Arbor, MI) and were of the highest purity available.
Calibration solutions were prepared by mass, dissolved in HPLC grade ethanol, and stored under N2 at −80°C prior to HPLC analysis.
2.3. Instruments and Equipment
-
Mass spectrometry:
Mass spectrometry of phospholipids was performed by direct infusion into a high-throughput quadrupole linear ion-trap mass spectrometer Finnigan™ LXQ™ with the Xcalibur operating system (Thermo Electron, San Jose, CA).
Finnigan™ LXQ™ quadrupole linear ion-trap mass spectrometer.
Dell/Pentium®, Intel®, PC.
Xcalibur operating system.
-
HPLC System:
Analytical HPLC system from Shimadzu Scientific Instruments (Columbia, MD) was used.
Shimadzu SCL-10A vp HPLC system controller.
Shimadzu LC-10AT vp liquid chromatograph.
Shimadzu SIL-10AD vp autosampler/injector.
Shimadzu SPD M6A UV/VIS photodiode array.
Shimadzu fluorescence detector RF-10Axl.
Dell/Pentium®, Intel®, PC.
Shimadzu EZstart v. 7.2 chromatography software.
-
HPLC Columns:
Zorbax Eclipse XDB-C18, 4.6 × 150 mm, 5 μm (Agilent Technologies, Palo Alto, CA).
Zorbax cartridge quard-columnXDB-C18, 4.6 × 20 mm, 5 μm.
2.4. Determination of Inorganic Lipid Phosphorus in Specific Classes of Phospholipids
5 × 5 cm Whatman silica G HPTLC plates (Whatman, Clifton, NJ).
Chromatography chambers (e.g., 10 cm Latch-Lid Chromatotank, General Glassblowing Company, Inc., Richmond, CA).
Mobile phase solvent system 1: chloroform/methanol/28% ammonium hydroxide, 65/25/5 (v/v/v).
Mobile phase solvent system 2: chloroform/acetone/methanol/glacial acetic acid/water, 50/20/10/10/5 (v/v/v/v).
Nitrogen compressed, Grade 4.0 (Valley National Gases Inc., Wheeling, WV).
Cell culture disposable glass tubes (Fisher Scientific, Pittsburgh, PA).
Iodine crystals, chromatography chamber, and fume hood.
Vortex-2, Genie (Scientific Industries Inc., Bohemia, NY).
HClO4, 70% w/v (Aldrich, Milwaukee, WI).
Heating apparatus to achieve 170–180°C (Troemner 501 hotplate with aluminum block test tube holders, Thorofare, NJ, or equivalent) and 90–100°C (for water bath container).
Sodium molybdate, 2.5% w/v (water solution).
Ascorbic acid, 10% w/v (water solution).
NaH2PO4 (water solution).
Tabletop centrifuge.
Shimadzu UV 160 V, spectrophotometer.
2.5. Reagents for Detection of Lipid Hydroperoxides of Specific Phospholipid Classes
10-Acetyl-3, 7-dihydroxyphenoxazine, 10 mM, Amplex red reagent (Invitrogen, Carlsbad, CA).
Resorufin sodium salt, 32 μM solution in DMSO (Molecular Probes, Eugene, OR).
Phospholipase A2 (PLA2), porcine pancreas (EC 3.1.1.4).
Sodium dodecyl sulfate, ultra pure (SDS), 10 mM solution in ethanol (GibcoBRL, Grand Island, NY).
Butylated hydroxytoluene (BHT), 0.1 M.
Microperoxidase-11 (MP-11), water solution.
Hydrochloric acid, 1.0 M.
Ethanol.
3. Methods
3.1. Lipid Extraction and 2D-HPTLC Analysis
Total lipids were extracted from tissue samples by Folch procedure as described by Folch et al. (24). Methanol (4 mL) containing BHT (0.1 mg/mL) was added to the sample homogenate (1 mL) and mixed. Chloroform (8 mL) was then added and the mixture was stored for 2 h at 0°C under N2. One milliliter of 0.1 M NaCl was added to the extract which was vortex mixed under N2. After centrifugation for 5 min at 1,500×g, lower chloroform layer was collected and the upper aqueous methanol layer was mixed with equal volume of chloroform. After centrifugation for 5 min at 1,500×g, lower chloroform layer was collected and combined with chloroform phase after the first centrifugation and evaporated to dryness under a stream of N2. Phospholipid classes in the extracts were separated by 2D-HPTLC on silica G plates as described by Kagan et al. (7). To bind transition metals from silica, prior to application and separation of phospholipids by HPTLC, plates were treated with methanol containing 1 mM EDTA, 100 μM DTPA. Then the plates were first developed with a solvent system consisting of chloroform/methanol/28% ammonium hydroxide (65/25/5, v/v/v). After the plates were dried with a forced N2 blower to remove the solvent, they were developed in the second dimension with a solvent system consisting of chloroform/acetone/methanol/glacial acetic acid/water (50/20/10/10/5, v/v/v/v). The phospholipids were visualized by exposure to iodine vapors and identified by comparison with authentic phospholipid standards. For ESI-MS and Amplex red analysis the phospholipid spots on the silica plates were visualized by spraying the plates with deionized water. After this, the spots were scraped from the silica plates and phospholipids were extracted by chloroform/methanol/water (20/10/2, v/v/v). Extracted phospholipids were divided into aliquots for phosphorus, Amplex red, and ESI-MS analysis. Lipid phosphorus was determined by a micro-method (25).
3.2. Electrospray Ionization Tandem Mass Spectrometry
ESI-MS has emerged as a powerful tool for qualitative analysis of complex phospholipids (22, 23). Collision induced decomposition of both positive and negative molecular ion species yields rich information as to the polar head group of the phospholipid and the fatty acid substituents esterified to the glycerophospholipid backbone. ESI-MS analysis of phospholipids was performed by direct infusion into quadrupole linear ion-trap mass spectrometer Finnigan™ LXQ™ with the Xcalibur operating system (Thermo Electron, San Jose, CA). Samples collected after 2DHPTLC separation were evaporated under N2, resuspended in chloroform/methanol (1/2, v/v; 20 pmol/μL) and directly utilized for acquisition of negative-ion or positive-ion ESI mass spectra using a flow rate of 5 μL/min. The ESI probe was operated at a voltage differential of 5.0 kV in the negative- or positive-ion mode. Capillary temperature was maintained at 150°C. Tandem mass spectrometry (MS/MS analysis) of individual PL species was employed to determine the fatty acid composition. Using full range zoom (200–2,000 m/z) in positive- and negative-ion mode, the profile spectra were acquired. Two ion activation techniques were used for MS analysis: collision-induced dissociation (CID, Q = 0.25, low mass cut off at 28% of the precursor m/z) and pulsed-Q dissociation technique (PQD), with Q = 0.7, and no low mass cut off for analysis of low molecular weight=fragment ions (26).
3.3. Quantitation of Lipid Hydroperoxides
Lipid hydroperoxides were determined by fluorescence HPLC of resorufin formed in peroxidase-catalyzed reduction of specific PL-OOH with Amplex red. Phospholipids were hydrolyzed by porcine pancreatic PLA2 (2 U/μL) in 25 mM phosphate buffer containing 1.0 mM Ca2+, 0.5 mM EGTA, and 0.5 mM SDS (pH 8.0 at RT for 30 min), prior to exposure to reagents for the peroxidase reaction (MP-11/Amplex Red). This resulted in the production of lyso-phospholipids and release of hydroperoxide group-containing fatty acids (FA-OOH). While MP-11 can catalyze reduction of some PL-OOH without pretreatment with PLA2, non-deesterified CL-OOH did not effectively react with MP-11/Amplex Red. For the peroxidase reaction, 50 μM Amplex red and MP-11 (1.0 μg/μL) were added to hydrolyzed lipids, and the samples were incubated at 4°C for 40 min. The reaction was started by addition of 1 μL of solution MP-11(1.0 μg/μL). The reaction was terminated by addition of 100 μL of a stop reagent (solution of 10 mM HCl, 4 mM BHT in ethanol). The samples were centrifuged at 10,000×g for 5 min and the supernatant was used for HPLC analysis. Aliquots (5 μL) were injected into a C-18 reverse phase column (Eclipse XDB-C18, 5 μm, 150 × 4.6 mm). The column was eluted by mobile phase composed of 25 mM KH2PO4 (pH 7.0)/methanol (60/40, v/v) with 1 mL/min flow rate. The resorufin (an Amplex red oxidation product) fluorescence was measured at 590 nm after excitation at 560 nm. Shimadzu LC-100AT vp HPLC system equipped with fluorescence detector (model RF-10Axl) and autosampler (model SIL-10AD vp) was used.
4. Notes
MS Characterization of Molecular Species in Major Classes of Phospholipids with Emphasis on Polyunsaturated Substrates of Peroxidation
Two major tasks can be accomplished using ESI-MS analysis of phospholipids: (1) characterization of individual molecular species with particular emphasis on those that contain polyunsaturated fatty acid residues, hence represent likely substrates of lipid peroxidation and (2) identification of oxygenated molecular species that underwent oxidative modification. ESI-MS of anionic phospholipids such as PS, PI, and CL reveals molecular ion peaks readily observable in negative mode. A zwitterionic phospholipid, PC, is effectively detectable in positive mode, whereas another non-charged phospholipid, PE, could be determined equally well in either mode. Detection of phospholipids in positive ionization mode generally provides information about the phospholipid head groups, whereas tandem MS-MS analysis in negative mode is a source of structural information relevant to the identity and positional distribution at sn-1 and sn-2 of individual acyl chains.
Typical ESI mass spectra of different molecular species of several major classes of phospholipids from brain cortex are shown on Fig. 21.1. A negative-ion mode was employed for PE, PI, and CL, while spectra for PC were obtained using a positiveion regimen. The molecular species of PE (Fig. 21.1, A) are represented by deprotonated ions [M-H]− with m/z 722; 747; 750; 766; 774; and 790. After fragmentation of the major molecular ion with m/z 766, two prominent ions with m/z 283 and 303 are obtained in negative ionization mode that correspond to stearic (C18:0) and arachidonic (C20:4) fatty acids, respectively (Fig. 21.1, A, b). Typical product ions of PE with m/z 140 and 196 derived from [HPO4CH2CH2NH2]+ and [CH2C(OH)CH2PO4CH2CH2NH2]+ were observed after fragmentation of molecular species of PE in a positive mode (data not shown).
Fig. 21.1.

Typical ESI mass spectra of molecular species of PE (A), PI (B), PC (C), and CL (D) obtained from rat brain cortical P2 fraction. Phospholipids separated by 2D-HPTLC were subjected to MS analysis by direct infusion into mass spectrometer. Typical MS/MS fragmentation experiments for the major molecular species of PE, PI, PC, and CL are shown on panels Ab, Bb, Cb, and Db, respectively. Note that MS spectra for PE, PI, CL were recorded in negative mode and for PC in positive mode.
The major product ion of PI under negative ionization mode (Fig. 21.1, B, a) is apparent as a peak [M-H]− with m/z 885. The negative ionization mass spectrum after fragmentation of PI (Fig. 21.1, B, b) showed the ion fragments with m/z 283 and m/z 303 that correspond to stearic (C18:0) and arachidonic (C20:4) fatty acids, respectively. Elimination of one of the fatty acids (C18:0 or C20:4) from the parent ion with m/z 885 resulted in the product ions at m/z 581 [M-H-C20:4]− and m/z 601 [M-H-C18:0]−. Loss of the inositol group from the fragment with m/z 581 formed a product ion with m/z 419. Fragment of ion with m/z 259 corresponds to the polar head group (inositol phosphate) of PI. Loss of one and two molecules of water from this fragment yielded ions with m/z 241 and 223, respectively.
Molecular species of PC in positive-ion mode (Fig. 21.1, C, a) demonstrated the presence of the major molecular species with protonated ions [M+H]+ with m/z 734, 760, and 782 and corresponding to multiple individual species containing C16:0/C16:0, C16:0/C18:1, and C16:1/C20:3 fatty acids, respectively. Several other molecular clusters of PC with polyunsaturated acyl species were present in relatively small quantities. A typical fragmentation spectrum in positive mode of the major parent ion with m/z 760 is presented in Fig. 21.1, panel C, b. The major fragment with m/z 184 is derived from the loss of the polar head group [C5H15NPO4]+. Additional information on PC comes from the fragment ions with m/z 478 and 504 of lysoPC derived from the loss of fatty acids: oleic (C18:1) and palmitic (C16:0). In the negative ionization mode, most of the PC molecular species were observed as chloride adducts [M+Cl]− (data not shown).
Molecular species of CL were represented by at least nine different major clusters with a variety of fatty acid residues (from C14:0 to C22:6), including those containing polyunsaturated fatty acid residues, such as arachidonic (C20:4) and docosahexaenoic (C22:6) fatty acids, highly susceptible to oxidation (Fig. 21.1, D, a). MS/MS fragmentation experiments with the CL molecular cluster containing docosahexaenoic (C22:6) fatty acid with m/z 1550.2 revealed ions with m/z 279, 281, 283, 303, 305, 327, and 329 corresponding to several individual molecular CL species with the following fatty acid residues – (C18:1)1/(C18:0)1/(C22:6)2; (C18:0)1/(C20:4)2/(C22:5)1; (C18:2)1/(C20:3)2/(C22:5)1; (C18:2)1/(C18:0)1/(C22:5)1/(C22:6)1 (Fig. 21.1, D, b). Complete structural characterization of major CL clusters was performed by using MSn approach (multiple-stage fragmentation) on an ion-trap mass spectrometer. To characterize the structure of each CL species, the protocol described by Hsu and Turk was applied (27). Briefly, first, pairs of corresponding A/B or A/B+136 ions were identified in MS2 spectra and then MS3 was performed on each A or B ion to assign fatty acids and their positions. One major isomer was identified in CL molecular species of ion with m/z 1550.2 (1550.2 = [A1–H]− + [B1–H]− +58, where A1 = 745.5 corresponds to (C18:1/C22:6) and B1 = 747.8 corresponds to (C18:0/C22:6)).
In contrast to multiple molecular species of CL and PE, a single major molecular ion of PS with m/z 834 was observed under negative ionization mode (Fig. 21.2). The main peak with m/z 747 formed after fragmentation of PS originated due to loss of the serine group. This fragmentation product ion together with the deprotonated ion (m/z 834) effectively determined the molecular mass of PS. There were also ions characteristic of the head group or its fragments (Fig. 21.2, A, b), as well as common fragments for phospholipids: m/z 79 for [PO3]−, m/z 153 for [glycerophosphate – H2O-H]−. Molecular fragments with m/z 283 and 327 correspond to carboxylate anions of stearic (C18:0) and docosahexaenoic (C22:6) fatty acids, respectively.
Fig. 21.2.

Typical negative-ion ESI mass spectra of PS isolated from rat brain cortex (A – control and B – after CCI), (C) – midfrontal gyrus from human with Alzheimer’s disease patients and (D) – from mouse gut after total body irradiation. Identification of individual oxidized molecular species of PS containing C22:6+OOH. Tandem MS-MS experiments confirmed the structures of non-oxidized and oxidized PS species (panels A, b; B, b).
Based on these identification protocols, the distribution of different molecular species in major polyunsaturated phospholipid classes as well as characteristic fragments can be established (Table 21.1). Note that PE, CL, and PS contain molecular species with polyunsaturated fatty acid (PUFA) residues, particularly C20:4, C22:5, and C22:6. These PUFA are known to be most susceptible to oxidative attack that is illustrated further.
Table 21.1.
Major phospholipid oxidizible molecular species from rat brain and mouse gut identified by ESI-MS approach
| Phospholipids | m/z | Rat brain fatty acids | m/z | Mouse gut fatty acids |
|---|---|---|---|---|
| Phosphatidylethanolamine | 762.8 | C16:0/C22:6 | 714.5 | C16:0/C18:2 |
| 766.8 | C18:0/C20:4 and C16:0/C22:4 | 742.5 | C18:0/C18:2 | |
| 790.8 | C18:0/C22:6 | 766.7 | C18:0/C20:4 and C16:0/C22:4 | |
| 794.7 | C18:0/C22:4 | 768.6 | C18:0/C20:3 and C18:2/C20:1 | |
| 722.8 | C16:0p/C20:4 | 778.5 | C20:0/C20:4 | |
| 747.8 | C18:1p/C20:4 and C16:0p/C22:6 | 790.7 | C20:0/C20:4 | |
| 750.8 | C16:0p/C22:4 and C18:0p/C20:4 | 802.7 | C18:0/C22:6 | |
| 747.8 | C18:0p/C20:2 | 750.5 | C16:0p/C22:4 and C18:0p/C20:4 | |
| 774.7 | C18:0p/C22:6 | 776.5 | C18:0c/C22:6 and C20:0p/C20:4 | |
| 778.8 | Cl8:0p/C22:4 | 790.7 | C18:0p/C22:6 | |
| 802.7 | C20:0p/C22:6 | |||
| Phosphatidylinositol | 857.8 | C16:0/C20:4 | 833.7 | C16:0/Cl8:2 |
| 885.8 | C18:0/C20:4 | 857.8 | C16:0/C20:4 | |
| 887.8 | C18:0/C20:3 | 861.8 | C18:1/C18:2 | |
| 909.8 | C18:0/C22:6 | 885.7 | C18:1/C20:4 | |
| 909.7 | C18:0/C22:6 | |||
| Phosphatidylserine | 810.8 | C18:0/C20:4 and C16:0/C22:4 | 810.7 | C18:0/C20:4 |
| 834.8 | C18:0/C22:6 | 812.7 | C18:0/C20:3 and C20:1/C18:2 | |
| 836.8 | C18:0/C22:5 | 834.7 | C18:0/C22:6 | |
| 838.8 | C18:0/C22:4 | 836.7 | C18:1/C22:4 and C18:0/C22:5 | |
| Phosphatidylcholine | 784.7 | C18:1/C18:2 | 758.7 | C16:0/C18:2 |
| 806.7 | C16:0/C22:6 | 782.7 | C16:0/C20:4 | |
| 810.7 | C18:0/C20:4 | 786.7 | C18:0/C18:2 | |
| 812.7 | C18:0/C20:2 | 806.7 | C16:0/C22:6 | |
| 832.7 | C18:1/C22:6 | 810.7 | C18:0/C20:4 | |
| 838.7 | C18:0/C22:4 | |||
| 832.7 | C18:0/C22:6 | |||
| Cardiolipin | 1424.6 | (C16:0)1/(C16:1)1/(C18:1)1/(C20:4)1 | 1447.9 | (C18:2)4 |
| 1426.4 | (C16:1)1/(C18:2)1/(C18:1)2 | 1450.0 | (C18:1)1/(C18:2)3 | |
| 1448.5 | (C16:1)1/(C18:2)1/(C18:1)1/(C20:4)l | |||
| 1448.7 | (C18:2)4 | |||
| 1450.5 | (C16:1)1/(C18:2)l/(C18:1)1/(C20:3)1 | |||
| 1476.4 | (C18:1)2/(C18:2)1/(C20:4)1 | |||
| 1498.6 | (C18:2)1/(C18:1)1/(C20:4)2 | |||
| 1500.2 | (C18:1)2/(C20:4)2 | |||
| 1502.6 | (C16:0)1/(C18:1)1/(C20:4)1/(C22:4)l | |||
| 1518.9 | (C16:1)1/(C18:2)1/(C22:6)2 | |||
| 1520.0 | (C18:2)1/(C20:4)3 | |||
| 1525.2 | (C18:1)2/(C20:4)1/(C22:6)1 | |||
| 1528.6 | (C18:1)2/(C20:4)1/(C22:4)1 | |||
| 1550.2 | (C18:1)1/(C18:0)1/(C22:6)2 | |||
| 1550.2 | (C18:0)1/(C20:4)2/(C22:5)1 | |||
| 1550.2 | (C18:2)1/(C20:3)2/(C22:5)1 | |||
| 1550.2 | (C18:2)1/(C18:0)1/(C22:5)1/(C22:6)1 | |||
| 1553.0 | (Cl8:0)2/(C22:6)2 | |||
| 1570.2 | (Cl8:l)l/(C20:4)l/(C22:6)2 | |||
| 1582.7 | (C18:1)1/(C20:2)2/(C24:6)1 |
MS Identification of Oxidized Molecular Species in Major Classes of Oxidizable Phospholipids
As indicated in the Introduction, ESI- and MALDI-MS can be also utilized for the detection and molecular characterization of individual species of phospholipids. Several examples below illustrate the applicability of ESI-MS for this purpose.
Using a model of acute brain injury that is commonly associated with the triggering of cell apoptosis and enhanced production of ROS (8, 28), we employed oxidative lipidomics approach for assessment of individual lipid oxidation products. ESI-MS analysis of PS in the brain cortex samples after traumatic brain injury of rats showed the enhanced formation of PS molecular species with oxidized C22:6, PS-OOH, with m/z 866 as compared with the control rats (Fig. 21.2). Detailed analysis of this peak by MS-MS demonstrated that the [M–H]− ion at m/z 866 corresponded to PS-OOH with the dominating product of (C18:0/C22:6+OO) and produced due to peroxidation of the PS molecular species with the ion at m/z 834 (C18:0/C22:6).
Oxidative damage to the brain has been long associated with the development of Alzheimer’s disease (reviewed in (29)). Recently, it has been established that the loss of heme by the mitochondrial respiratory complex IV triggers the release of oxidants (e.g., H2O2); thus produced H2O2 may feed peroxidase activity of amyloid-β peptide–heme complexes and cause oxidative stress) in the brains of patients with Alzheimer’s disease (30). By using ESI-MS, we were able to identify that PS containing C22:6 species in brain samples from patients with Alzheimer’s disease were converted into PS-OOH (Fig. 21.2, C). Tandem MS-MS experiments confirmed the structure of PS-OOH with oxidized C22:6 (m/z 866). Additionally, other oxidized molecular products with m/z 850, 882, and 898 – formed from C22:6 fatty acid, containing PS – corresponded to molecular clusters (C18:0/C22:6+O), (C18:0/C22:6+O+OO), and (C18:0/C22:6+2OO), respectively (Table 21.2)
Table 21.2.
Major molecular species of PS in brains from patients with Alzheimer’s disease
| Molecular species | m/z [M-H]− | Acyl chain composition |
|---|---|---|
| Diacyl species | Acyl/Acyl | |
| 34:1 | 760.8 | C16:0/C18:1 |
| 36:2 | 786.8 | C18:1/C18:1 |
| 36:1 | 788.8 | C18:0/C18:1 |
| 38:4 | 810.8 | C18:0/C20:4 |
| 40:6 | 834.8 | C18:0/C22:6 |
| 40:5 | 836.8 | C18:0/C22:5 |
| 40:4 | 838.8 | C18:0/C22:4 |
| 40:3 | 840.8 | C18:0/C22:3 |
| 40:0 | 846.5 | C18:0/C22:0 |
| 40:6 | 850.8 | C18:0/C22:6+O |
| 40:6 | 866.8 | C18:0/C22:6+OO |
| 40:6 | 882.8 | C18:0/C22:6+O+OO |
| 40:6 | 898.5 | C18:0/C22:6+2OO |
| 42:7 | 860.8 | C20:1/C22:6 |
| 42:6 | 862.8 | C18:0/C24:6 |
| 42:5 | 864.8 | C18:0/C24:5 |
| 44:10 | 882.8 | C22:4/C22:6 |
Postmortem frozen tissue samples of cerebral cortex (midfrontal gyrus) from patients with Alzheimer’s disease of Pittsburgh University UPMC Hospital were studied for PL content and composition.
In cellular membranes, ROS induced by ionizing irradiation may cause lipid peroxidation and the resulting cellular and/or nuclear damage can lead to apoptosis (31). Typical oxidative modification of PS extracted from mouse gut after the total body irradiation is presented in Fig. 21.2, D. Accumulation of oxidized PS species with m/z 866 (C18:0/C22:6+OO), 868 (C18:0/C22:5+OO), and 870 (C18:0/C22:4+OO) formed from molecular clusters of PS with m/z 834 (C18:0/C22:6), 836 (C18:0/C22:5), and 838 (C18:0/C22:4), respectively, was established (Fig. 21.2, D). All these examples clearly demonstrate that MS analysis can be used for qualitative identification and structural characterization of individual molecular species of major phospholipids involved in oxidative modifications catalyzed by different enzymatic and nonenzymatic mechanisms in cells and tissues. Protocols for quantitative assessments of oxidized phospholipids by MS need further development.
Quantitative Assessments of Phospholipid Hydroperoxides in Complex Mixtures of Phospholipids and Major Classes of Phospholipids
While several techniques have been proposed to assess peroxidation of phospholipids (14, 32), their sensitivity is not always sufficient for the analyses of small amounts of these products in vivo or in cells, particularly as it relates to specific classes of phospholipids. Because PL-OOH are the primary molecular products of peroxidation, while the other numerous secondary products originate from the hydroperoxides and may be present in significantly lower concentrations (33), we reasoned that measurements of PL-OOH may be most representative of the peroxidation process as a whole. Therefore, our efforts were directed toward the development of an assay for PL-OOH. Quantitative determinations of the extent to which phospholipids undergo oxidation, can be performed by fluorescence HPLC. Our protocol is based on the use of Amplex red, a highly sensitive and chemically stable fluorogenic probe, which has been commonly utilized for the measurement of very low levels of H2O2 in peroxidase-mediated reactions (34). Here, we describe the use of Amplex red as a very sensitive and stable substrate for the peroxidase activity of MP-11 with high selectivity to FA-OOH.
Incubation of Amplex red with MP-11 in the presence of FA-OOH, 9S HpODE, reveals the formation of the oxidized Amplex red fluorescent product (Fig. 21.3, A), resorufin, with one major peak (Rf 3.5 min) after its HPLC separation (Fig. 21.3 B). The resorufin formation was not observed after incubation of Amplex red in phosphate buffer alone, or in the presence of 9S-HpODE alone or MP-11 alone (Fig. 21.3, B, insert). Fluorescence of resorufin was not changed when equimolar concentrations of resorufin and 9S-HpODE were incubated in the presence of different amounts of MP-11. Moreover, incubation of 9S-HpODE in the presence of Amplex red and different amounts of MP-11 resulted in increased formation of highly fluorescent resorufin (Fig. 21.3, B, insert). The fluorescence response was stable and no significant decrease of resorufin fluorescence was observed during prolonged incubations (Fig. 21.3, B, insert). Our results are consistent with published data that fluorescence of resorufin did not significantly change during the incubation of resorufin in the presence of H2O2 and horseradish peroxidase (34).
Fig. 21.3.

Determination of FA-OOH using Amplex red protocol. Formation of resorufin from Amplex red in the presence of MP-11 and FA-OOH (a). Typical separation of the resorufin by HPLC (b). Insert shows fluorescent response of resorufin vs concentration of MP-11 in the presence (closed circus) and in the absence (opened circus) of FA-OOH (9S HpODE). Fluorescent response of resorufin vs concentration of resorufin or 9S-HpODE (c). Typical negative-ion ESI-MS of arachidonic acid (d), after its oxidation by cyt c/H2O2 (e), and oxidized arachidonic acid after reaction catalyzed by MP-11 in the presence of Amlex red (f). Quantification of arachidonic acid hydroperoxides catalyzed by cyt c/H2O2 (g). Reaction conditions: Arachidonic acid (2 mM) was incubated with or without cyt c (40 μM), H2O2 (2 × 500 μM), 100 μM DTPA in 50 mM phosphate buffer pH 7.4 at 37°C in for 30 min. Amount of arachidonic acid hydroperoxides was determined by Amlex red/MP-11 system (68.4 ± 5.9 LOOH pmol/nmol FA).
In contrast, to other protocols of FA-OOH determination (ferrous oxidation-xylenol orange, iodometric assays (35, 36)), our Amplex Red/MP-11 assay is free from complications due to potential oxidation of PUFA during the reaction. Incubation of Amplex red and MP-11 in the presence of 1,000-fold excess of non-oxidized arachidonic acid C20:4 did not increase the resorufin fluorescence response. Amplex red, in the presence of enzyme MP-11, reacts with FA-OOH at a 1:1 stoichiometry to produce the highly fluorescent product, resorufin (Fig. 21.3, C). A linear relationship between 9S-HpODE concentration and fluorescence of oxidized Amplex red by MP-11 was consistently observed; the fluorescence response showed excellent correlation with the calibration using standard concentrations of resorufin. The limit of FA-OOH detection under conditions of our experiments was found to be 1–2 pmol. Moreover, the pool of FA-OOH was completely utilized after reaction with Amplex Red/MP-11, which was confirmed by MS (Fig. 21.3 D, E, F). Incubation of C20:4 with cyt c/H2O2 resulted in the formation of C20:4+OOH (from1.24 in control to 68.4 pmol FA-OOH per nmol fatty acid, Fig. 21.3, G). According to the ESI-MS data, non-oxidized C20:4 had one product of molecular ion with a 303.3 m/z (Fig. 21.1, D). Incubation of C20:4 with cyt c/H2O2 generated a series of C20:4 oxidation products containing mono- C20:4+OO (335.3 m/z), and di-hydroperoxides C20:4+2OO (367.3 m/z), as well as other oxygenated species (Fig. 21.3, E), which were not observed in the MS spectrum after the reaction of oxidized C20:4+OO with Amplex Red/MP-11 (Fig. 21.3, F).
Data presented in Table 21.3 illustrate the resorufin formation catalyzed by Amplex Red/MP-11 from different fatty acid derivatives. One can see that resorufin was produced only in the presence of FA-OOH. This additionally confirms specific interactions of Amplex Red/MP-11 with FA-OOH.
Table 21.3.
Resorufin formation from Amplex red catalyzed by MP-11 in the presence of different fatty acid derivatives
| Fatty acids | Resorufin pmol/nmol FA | Structures of fatty acids |
|---|---|---|
| 9Z-Octadecenoic acid, Oleic acid | 0.02 ± 0.02 | |
| 9Z, 12Z-Octadecadienoic acid, Linoleic acid | 0.52 ±0.11 | |
| 5Z, 8Z, 11Z, 14Z-Eicosatetraenoic acid, Aracidonic acid | 1.24 ± 0.12 | |
| 15S-Hydroxy-5Z, 8Z, 11Z, 13E, 17Z-eicosapentaenoic acid, 15(S)-HEPE | 5.64 ± 7.35 | 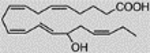 |
| 9E, 11Z-Octadecadienic acid, 13-oxo-, 13-Oxo-ODE | 16.42 ± 8.87 | 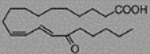 |
| (+)8(9)-Epoxy-5Z, 11Z, 14Z-eicosatrienoic acid, 8(9)-EpTrE | 1.99 ± 2.35 | 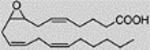 |
| 9S-Hydroperoxy-10E, 12Z-octa-decadienoic acid, 9(S)-HpODE | 993.38 ± 29.72 | |
| 13S-Hydroperoxy-10E, 12Z-octa-decadienoic acid, 13(S)-HpODE | 983.45 ± 39.74 | 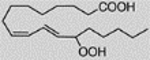 |
| 15S-Hydroperoxy-5Z, 8Z, 11Z, 13E-eicosatetraenoic acid, 15(S)-HpETE | 996.45 ± 29.74 |  |
Peroxidase activity of cyt c complexes with anionic phospholipids such as PS or CL can utilize their fatty acid residues as the reaction substrates, i.e., oxidize these phospholipids (7). Therefore, in a separate series of experiments, we employed the Amplex Red/MP-11 system to monitor cyt c-catalyzed production of PL-OOH in the presence of palmitoyl-arachidonoyl-PS (PAPS) or tetralinoleoyl-CL (TLCL) and H2O2. Incubation of cyt c/PAPS or cyt c/TLCL with H2O2 resulted in the accumulation of phospholpid oxidation products, which was also confirmed by ESI-MS-analysis (data not shown). It was important to determine whether oxidized and non-oxidized species of PAPS (PAP-Sox) and TLCL (TLCLox) co-migrated during their separation by 2D-HPTLC. We found this to be the case as evidenced by the Amplex Red/MP-11 based assay as well as by ESI-MS analysis.
Because PS and CL molecules contain two and four fatty acid residues, respectively, the availability of MP-11 to oxidized acyl moieties in the respective phospholipid molecules could be different. To evaluate this, we performed experiments in which we treated PS and CL with PLA2 and measured the formation of FA-OOH by the MP-11 catalyzed resorufin response. We found that PLA2 treatment did not affect the formation of resorufin in PAP-Sox. In contrast, pretreatment of TLCLox with PLA2 resulted in a marked additional increase of MP-11 catalyzed resorufin formation (up to 25–35%). Thus, treatment with PLA2 should be uniformly used to reliably perform quantitative analyses of peroxidation in complex mixtures of phospholipids extracted from different cells and tissues.
Validation of the Amplex Red/MP-11/PLA2 protocol confirmed its applicability for quantitative measurements of phospholipid peroxidation. Analyses of the contents of PL-OOH were performed in several cells lines exposed to oxidant and non-oxidant pro-apoptotic stimuli. In line with the MS measurements, we found that CL and PS underwent most robust oxidation, while other phospholipids such as PE, and PC were only slightly oxidized (Fig. 21.4). Comparison of the abundance of phospholipids with the abundance of oxidized phospholipids permits to present the results as lipid arrays vs. oxidized lipid arrays. Using different models of apoptosis in a variety of cell lines, we found that the pattern of phospholipid oxidation during apoptosis was nonrandom and did not follow their abundance in the analyzed samples. Considering the affinity of cyt c for anionic PS and CL and the emergence of its peroxidase activity, it was expected that cyt c/CL and cyt c/PS complexes are very effective catalysts of self-oxidation. Thus, cyt c/PS or cyt c/CL complexes may act as CL-, or PS-specific oxygenases capable of oxidizing polyun-saturated molecular species of CL and PS in mitochondria and plasma membrane, respectively (7, 8, 13). The importance of these oxidative modifications of the phospholipid signaling in the release of pro-apoptotic factors from mitochondria into the cytosol and the externalization of PS and its appearance on the surface of apoptotic cells as an “eat-me” signal are described in several recent reviews (8, 9, 13, 37–39).
Fig. 21.4.

Comparison of the abundance of major PL classes with their oxidation products. Profiles of phospholipids and PL-OOH in: (1) rat brain cortical P2 fractions after CCI, (2) human brain midfrontal gyrus with Alzheimer’s disease, and (3) mouse gut after total body irradiation. Phospholipid content is expressed as percent of total phospholipids and shown in green-blue scale. Phospholipid hydroperoxides are presented as percent of phospholipids (pmol PL-OOH per nmol of phospholipid) and shown in yellow-brown scale. In a variety of apoptotic cells and the disease processes investigated, CL and PS underwent most robust oxidation compared with other phospholipids (PE, PI, and PC). One hundred percent corresponds to 110 ± 20 pmol; 71 ± 32 pmol, and 79 ± 20 pmol of PL-OOH per nmol of phospholipid in rat brain cortex, human brain (midfrontal gyrus), and mouse gut, respectively.
Acknowledgments
Supported by grants from NIH HL70755, NIH U19 AIO68021, NIOSH OH008282, HD057587, AHA0535365N, Pennsylvania Department of Health SAP 4100027294, Human Frontier Science Program.
References
- 1.Vijg J and Suh Y (2005) Genetics of longevity and aging. Annu. Rev. Med 56, 193–212. [DOI] [PubMed] [Google Scholar]
- 2.Watson AD (2006) Thematic review series: systems biology approaches to metabolic and cardiovascular disorders. Lipidomics: a global approach to lipid analysis in biological systems. J. Lipid Res 47, 2101–2111. [DOI] [PubMed] [Google Scholar]
- 3.Gaspar ML, Aregullin MA, Jesch SA, Nunez LR, Villa-García M, and Henry SA (2007) The emergence of yeast lipidomics. Biochim. Biophys. Acta 1771, 241–254. [DOI] [PubMed] [Google Scholar]
- 4.Marathe GK, Harrison KA, Murphy RC, Prescott SM, Zimmerman GA, and McIntyre TM (2000) Bioactive phospholipid oxidation products. Free Radic. Biol. Med 28, 1762–1770. [DOI] [PubMed] [Google Scholar]
- 5.DeLong CJ, Baker PR, Samuel M, Cui Z, and Thomas MJ (2001) Molecular species composition of rat liver phospholipids by ESI-MS/MS: the effect of chromatography. J. Lipid Res 42, 1959–1968. [PubMed] [Google Scholar]
- 6.Podrez EA, Poliakov E, Shen Z, Zhang R, Deng Y, Sun M, Finton PJ, Shan L Febbraio M, Hajjar DP, Silverstein RL, Hoff HF, Salomon RG, and Hazen SL (2002) A novel family of atherogenic oxidized phospholipids promotes macrophage foam cell formation via the scavenger receptor CD36 and is enriched in atherosclerotic Lesions. J. Biol. Chem 277, 38517–38523. [DOI] [PubMed] [Google Scholar]
- 7.Kagan VE, Tyurin VA, Jiang J, Tyurina YY, Ritov VB, Amoscato AA, Osipov AN, Belikova NA, Kapralov AA, Kini V, Vlasova II, Zhao Q, Zou M, Di P, Svistunenko DA, Kurnikov IV, and Borisenko GG (2005) Cytochrome c acts as a cardiolipin oxygenase required for release of proapoptotic factors. Nature Chem. Biol 4, 223–232. [DOI] [PubMed] [Google Scholar]
- 8.Kagan VE, Tyurina YY, Bayir H, Chuh CT, Kapralov AA, Vlasova II, Belikova NA, Tyurin VA, Amoscato A, Epperly M, Greenberger J DeKosky S Shvedova AA, and Jiang J (2006) The “proapoptotic genies” get out of mitochondria: Oxidative lipidomics and redox activity of cytochrome c/cardiolipin complexes. Chem. Biol. Interact 163, 15–28. [DOI] [PubMed] [Google Scholar]
- 9.Bayir H, Fadeel B, Palladino MJ, Witasp E, Kurnikov IV, Tyurina YY, Tyurin VA, Amoscato AA, Jiang J, Kochanek PM, DeKosky ST, Greenberger JS, Shvedova AA, and Kagan VE (2006) Apoptotic interactions of cytochrome c: redox flirting with anionic phospholipids within and outside of mitochondria. Biochim. Biophys. Acta 1757, 648–659. [DOI] [PubMed] [Google Scholar]
- 10.Kujoth GC, Leeuwenburgh C, and Prolla TA (2006) Mitochondrial DNA mutations and apoptosis in mammalian aging. Cancer Res 66, 7386–7389. [DOI] [PubMed] [Google Scholar]
- 11.Green DR and Kroemer G (2004) The pathophysiology of mitochondrial cell death. Science 305, 626–629. [DOI] [PubMed] [Google Scholar]
- 12.Chandra J, Samali A, and Orrenius S (2000) Triggering and modulation of apoptosis by oxidative stress. Free Radic. Biol. Med 29, 323–333. [DOI] [PubMed] [Google Scholar]
- 13.Kagan VE, Borisenko GG, Tyurina YY, Tyurin VA, Jiang J, Potapovich AI, Kini V, Amoscato AA, and Fujii Y (2004) Oxidative lipidomics of apoptosis: Redox catalytic interactions of cytochrome c with cardiolipin and phosphatidylserine. Free Radic. Biol. Med 37, 1963–1985. [DOI] [PubMed] [Google Scholar]
- 14.Kriska T, Korytowski W, and Girotti AW (2005) Role of mitochondrial cardiolipin peroxidation in apoptotic photokilling of 5-aminolevulinate-treated tumor cells. Arch. Biochem. Biophys 433, 435–446. [DOI] [PubMed] [Google Scholar]
- 15.Kagan VE, Gleiss B, Tyurina YY, Tyurin VA, Elenström-Magnusson C, Liu S-X, Serinkan FB, Arroyo A, Chandra J, Orrenius S, and Fadeel B (2002) A role for oxidative stress in apoptosis: Oxidation and externalization of phosphatidylserine is required for macrophage clearance of cells undergoing Fas-mediated apoptosis. J. Immunol 169, 487–499. [DOI] [PubMed] [Google Scholar]
- 16.Tyurina YY, Kawai K, Tyurin VA, Liu SX, Kagan VE, and Fabisiak JP (2004a) The plasma membrane is the site of selective phosphatidylserine oxidation during apoptosis: role of cytochrome c. Antioxid. Redox Signal 6, 209–225. [DOI] [PubMed] [Google Scholar]
- 17.Wu Y, Tibrewal N, and Birge RB (2006) Phosphatidylserine recognition by phagocytes: a view to a kill. Trends Cell Biol 16, 189–190. [DOI] [PubMed] [Google Scholar]
- 18.Nomura K, Imai H, Koumura T, Kobayashi T, and Nakagawa Y (2000) Mitochondrial phospholipid hydroperoxide glutathione peroxidase inhibits the release of cytochrome c from mitochondria by suppressing the peroxidation of cardiolipin in hypoglycaemia-induced apoptosis. Biochem. J 351, 183–193. [DOI] [PMC free article] [PubMed] [Google Scholar]
- 19.Nakagawa Y (2004) Initiation of apoptotic signal by the peroxidation of cardiolipin of mitochondria. Ann. NY Acad. Sci 1011, 177–184. [DOI] [PubMed] [Google Scholar]
- 20.Tyurina YY, Serinkan FB, Tyurin VA, Kini V, Yalowich JC, Schroit AJ, Fadeel B, and Kagan VE (2004b) Lipid antioxidant, etoposide, inhibits phosphatidylserine externalization and macrophage clearance of apoptotic cells by preventing phosphatidylserine oxidation. J. Biol. Chem 279, 6056–6064. [DOI] [PubMed] [Google Scholar]
- 21.Kriska T and Girotti AW (2004) Separation and quantitation of peroxidized phospholipids using high-performance thin-layer chromatography with tetramethyl-pphenylenediamine detection. Anal. Biochem 300, 23–43. [DOI] [PubMed] [Google Scholar]
- 22.Pulfer M and Murphy RC (2003) Electrospray mass spectrometry of phospholipids. Mass Spectrom. Rev 22, 332–364. [DOI] [PubMed] [Google Scholar]
- 23.Forrester JS, Milne SB, Ivanova PT, and Brown HA (2004) Computational lipidomics: A multiplexed analysis of dynamic changes in membrane lipid composition during signal transduction. Mol. Pharmacol 65, 813–821. [DOI] [PubMed] [Google Scholar]
- 24.Folch J, Lees M, and Sloan-Stanley GH (1957) A simple method for isolation and purification of total lipids from animal tissue. J. Biol. Chem 226, 497–509. [PubMed] [Google Scholar]
- 25.Bottcher CJF, Van Gent CM, and Pries C (1961) A rapid and sensitive sub-micro phosphorus determination. Anal. Chim. Acta 24, 203–204. [Google Scholar]
- 26.Schwartz JC, Syka JEP, and Quarmby ST, (2005) Improving the fundamentals of Msn on 2D linear ion traps: new ion activation and isolation techniques Proc. Am. Soc. MS, San Antonio, Texas. [Google Scholar]
- 27.Hsu FF and Turk JJ (2006) Characterization of cardiolipin from Escherichia coli by electrospray ionization with multiple stage quadrupole ion-trap mass spectrometric analysis of [M - 2H + Na]- ions. J. Am. Soc. Mass Spectrum 17, 420–429. [DOI] [PMC free article] [PubMed] [Google Scholar]
- 28.Kochanek PM, Clark RS, Ruppel RA, Adelson PD, Bell MJ, Whalen MJ, Robertson CL, Satchell MA, Seidberg NA, Marion DW, and Jenkins LW (2000) Biochemical, cellular, and molecular mechanisms in the evolution of secondary damage after severe traumatic brain injury in infants and children: lessons learned from the bedside. Pediatr. Crit. Care Med 1, 4–19. [DOI] [PubMed] [Google Scholar]
- 29.Nunomura A, Castellani RJ, Zhu X, Moreira PI, Perry G, and Smith MA (2006) Involvement of oxidative stress in Alzheimer disease. J. Neuropathol. Exp. Neurol 65, 631–641. [DOI] [PubMed] [Google Scholar]
- 30.Atamna H and Boyle K (2006) Amyloid-beta peptide binds with heme to form a peroxidase: Relationship to the cytopathologies of Alzheimer’s disease. Proc. Natl. Acad. Sci. USA 103, 3381–3386. [DOI] [PMC free article] [PubMed] [Google Scholar]
- 31.Epperly MW, Osipov AN, Martin I, Kawai KK, Borisenko GG, Tyurina YY, Jefferson M, Bernarding M, Greenberger JS, and Kagan VE (2004) Ascorbate as a “redox senser” and protector against irradiation-induced oxidative stress in 32D CL3 hematopoietic cells and subclones over-expressing human manganese superoxide dismutase. Int. J. Rad. Oncol. Biol. Phys 58, 851–861. [DOI] [PubMed] [Google Scholar]
- 32.Mawatari S and Murakami K (1998) Analysis of membrane phospholipid peroxidation by isocratic high-performance liquid chromatography with ultraviolet detection. Anal. Biochem 264, 118–123. [DOI] [PubMed] [Google Scholar]
- 33.Kagan VE (1988) Lipid Peroxidation in Biomembranes CRC Press, Boca Raton, Florida, pp. 1–181. [Google Scholar]
- 34.Zhou M, Diwu Z, Panchuk-Voloshina N, and Haugland RP (1997) A stable nonfluorescent derivative of resorufin for the fluoro-metric determination of trace hydrogen peroxide: applications in detecting the activity of phagocyte NADPH oxidase and other oxidases. Anal. Biochem 253, 162–168. [DOI] [PubMed] [Google Scholar]
- 35.Gebicki JM, Collins J, Baoutina A, and Phair P (1996) The limitations of an iodo-metric aerobic assay for peroxides. Anal. Biochem 240, 235–241. [DOI] [PubMed] [Google Scholar]
- 36.Dobarganes MC and Velasco J (2002) Analysis of lipid hydroperoxides. Eur. J. Lipid Sci. Technol 104, 420–428. [Google Scholar]
- 37.Fadeel B (2004) Plasma membrane alterations during apoptosis: role in corpse clearance. Antioxid. Redox Signal 6, 269–275. [DOI] [PubMed] [Google Scholar]
- 38.Kadl A, Bochkov VN, Huber J, and Leitinger N (2004) Apoptotic cells as sources for biologically active oxidized phospholipids. Antioxid. Redox Signal 6, 311–320. [DOI] [PubMed] [Google Scholar]
- 39.Steinbrecher UP, Gomez-Munoz A, and Duronio V (2004) Acid sphingomyelinase in macrophage apoptosis. Curr. Opin. Lipid 15, 531–537. [DOI] [PubMed] [Google Scholar]