

Abstract
Objectives:
This study estimated the diagnostic performance of a deep learning system for detection of Sjögren's syndrome (SjS) on CT, and compared it with the performance of radiologists.
Methods:
CT images were assessed from 25 patients confirmed to have SjS based on the both Japanese criteria and American-European Consensus Group criteria and 25 control subjects with no parotid gland abnormalities who were examined for other diseases. 10 CT slices were obtained for each patient. From among the total of 500 CT images, 400 images (200 from 20 SjS patients and 200 from 20 control subjects) were employed as the training data set and 100 images (50 from 5 SjS patients and 50 from 5 control subjects) were used as the test data set. The performance of a deep learning system for diagnosing SjS from the CT images was compared with the diagnoses made by six radiologists (three experienced and three inexperienced radiologists).
Results:
The accuracy, sensitivity, and specificity of the deep learning system were 96.0%, 100% and 92.0%, respectively. The corresponding values of experienced radiologists were 98.3%, 99.3% and 97.3% being equivalent to the deep learning, while those of inexperienced radiologists were 83.5%, 77.9% and 89.2%. The area under the curve of inexperienced radiologists were significantly different from those of the deep learning system and the experienced radiologists.
Conclusions:
The deep learning system showed a high diagnostic performance for SjS, suggesting that it could possibly be used for diagnostic support when interpreting CT images.
Keywords: deep learning, Sjögren's syndrome, Tomography, X-ray computed
Introduction
Sjögren’s syndrome (SjS) is an autoimmune disease which features lymphocytic infiltration of exocrine glands, such as the salivary and lacrimal glands, resulting in specific damage of these glands. Several sets of diagnostic criteria for SjS have been published, including the Japanese criteria (JPN) (1999),1 American-European Consensus Group criteria (2002),2 Sjögren’s International Collaborative Clinical Alliance (SICCA) (2012),3 and American College of Rheumatology (ACR) and the European League Against Rheumatism (EULAR) classification criteria (2016),4 but the clinical signs and symptoms of this disease vary considerably. However, slowly progressive dry mouth (xerostomia) and dry eyes (keratoconjunctivitis sicca) are the most common symptoms. Dry mouth results from reduced secretion of saliva due to deterioration of salivary gland function, with fatty degeneration being one of the characteristic findings in the parenchyma of affected glands. Although fat deposition is not included in the diagnostic criteria mentioned above, this finding enables us to differentiate SjS from other causes of xerostomia such as medication.5,6 Fatty degeneration can be visualized by CT and MRI, and several authors have reported on the usefulness of this finding for diagnosis of SjS in patients with xerostomia.7–9 However, detection of this change is sometimes difficult for radiologists without sufficient experience in the interpretation of SjS on CT images resulting in overlooking the pathology frequently when they interpret other diseases.
In recent years, there has been increasing interest in medical uses of artificial intelligence (AI), and it has also been applied to the field of diagnostic imaging.10–14 A deep learning system is one of the AI machine learning methods that allows a computer to learn tasks like humans. It is based on a neural network, which is a system imitating the neurons in the human brain. After input of a large amount of data into a multilayered neural network, the system performs stepwise learning and extracts the characteristic features of the data set, leading to automatic creation of a learning model through computer learning.15 Many investigators have reported the high performance of deep learning systems for CT diagnosis in various fields, including liver,10 brain13 and lung11 disease. We have previously verified that a deep learning system was useful for CT evaluation of cervical lymph node metastasis in oral cancer patients.16
Taken together, our goal was planned to create an automated detection system for parotid abnormalities on CT as a diagnostic support for inexperienced radiologists. In the present study, therefore, as a part of study advancing toward the goal, the aims were to set to estimate the performance of a deep learning system for differentiation of SjS from normal glands using CT scans, and to perform comparison with experienced and inexperienced radiologists.
Methods and materials
The institutional ethics review board of our university (Aichi Gakuin University) approved this study (approval number 496).
Subjects
CT images of 25 patients (1 male and 24 females with an average age of 67.2 years) with a confirmed diagnosis of SjS according to the both Japanese criteria1 and American-European Consensus Group criteria2 were assessed in this study. All patients underwent CT to rule out neoplastic lesions or sialoliths at the initial visit. In addition, CT scans were obtained from 25 control subjects (1 male and 24 females with an average age of 66.1 years) with no parotid gland abnormalities who were examined for other diseases, such as maxillary sinusitis and temporomandibular joint disorder. The control subjects were selected from the imaging database of our hospital to match the age and gender distribution of the SjS patients. The 50 patients were randomly divided into training and test groups for the deep learning process. The training group consisted of 20 SjS patients and 20 control subjects, while the test group was 5 SjS patients and 5 control subjects.
CT protocol
CT scanning was performed by using an Asterion TSX (Canon Medical Systems, Otawara, Japan) and the following parameters: tube voltage of 120 kV, 100 mAs, slice thickness of 0.5 mm, pitch of 0.3 mm, and field of view of 20 cm. The scans were oriented parallel to the occlusal plane. When it was difficult to visualize the parotid gland due to metal artifacts, additional scans were performed with gantry inclination.
Imaging data
Five consecutive axial CT slices at 2 mm intervals were selected for each parotid gland (10 slices for both glands). The center slice was set at the mid-portion of the gland (i.e. the largest area) in the superior–inferior direction. CT images were downloaded from the hospital imaging database in JPEG format (.jpg) compressed to 150 kB. A single radiologist segmented a 30 × 30 mm square from the CT slice at the central region of the parotid gland, and this was done 10 times for each patient (Figure 1). Then a total of 400 images (200 from 20 SjS patients and 200 from 20 control subjects) were used as the training data set, and 100 images (50 from 5 SjS patients and 50 from 5 control subjects) were employed as the test data set.
Figure 1.
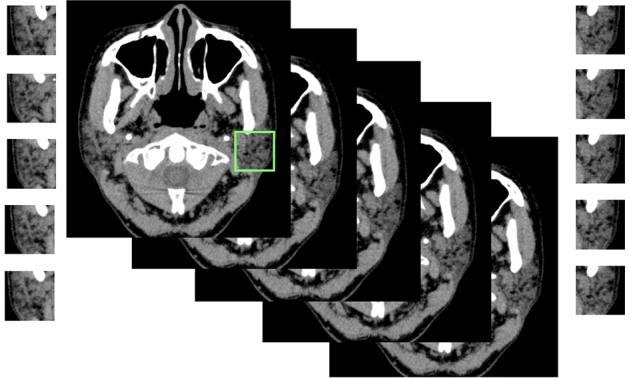
Segmentation of a parotid grand. A region of interest of size 30 × 30 mm was set, and the parotid glands were cropped out on both sides.
Diagnostic performance of the deep learning system
The deep learning system was installed in an Nvidia GeForce GTX GPU workstation (Nvidea Corp., Santa Clara, CA) with 11 GB of memory. Training, validation, and testing procedures were performed by using AlexNet architecture with the DIGITS library on the Caffe framework. Training and validation processes were conducted for 300 epochs, until sufficiently learning rates were obtained. The optimal parameters for creation of the learning model were determined on the basis of these training samples. Then test data were input into the learning model, and whether SjS was positive or negative was determined for each image with its probability (Figures 2 and 3). After this process, the accuracy, sensitivity, and specificity of the deep learning system were estimated. In addition, receiver operating characteristics (ROC) analysis was performed and the area under the curve (AUC) was calculated. The resultant evaluations were divided into four groups based on the probability of positive evaluation of SjS, including 0–25%, 26–50%, 51–75% and 76–100%. For each group, the sensitivity and specificity were calculated and plotted (Figure 3).
Figure 2.
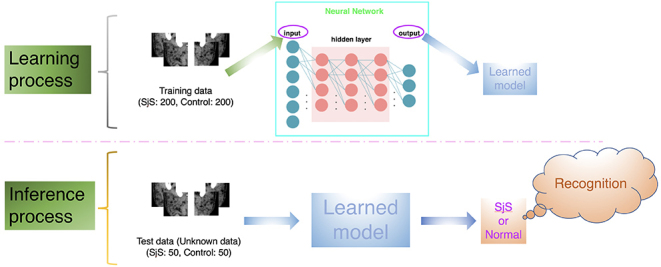
The deep learning system process. The optimal parameters for creation of the learning model were determined on the basis of these training samples. Then test data were input into the learning model, and whether SjS was positive or negative was determined for each image.
Figure 3.
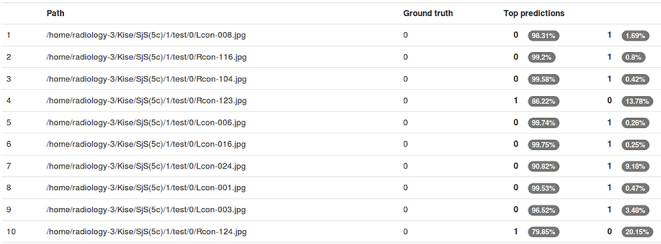
Examples of results represented on the computer display. The resultant evaluations by the application of testing data sets to the created learning model are shown for each image patch with its probability (white characters in elliptic area). “0” indicates the negative of SjS (normal) and “1” indicates the positive of SjS. SjS, Sjögren's syndrome.
Diagnostic performance of radiologists
Six radiologists (three experienced and three inexperienced radiologists) independently evaluated the test data set (50 SjS and 50 control images) after the calibration using 20 images (10 SjS and 10 control images) selected randomly from the training data sets before actual evaluations. Radiologists, who had sufficient experiences of over 30 years in the interpretation of maxillofacial diseases including SjS and other parotid pathologies on CT, were assigned as experienced radiologists. Three radiologists with experience less than 3 years, who received no training and had no experienced in the interpretation of SjS appearances of parotid gland on CT images, were assigned as inexperienced radiologists. Each image was randomly viewed on Microsoft PowerPoint, and classified the probability of SjS on a 4-point scale: 1, definitely SjS; 2, probably SjS; 3, probably normal; and 4, definitely normal. To calculate the sensitivity, specificity, and accuracy of diagnosing SjS, scores of 1 or 2 were regarded as positive and scores of 3 or 4 were negative (normal). The diagnostic performances were compared between the deep learning system and radiologists using the AUC of ROC analysis.
Statistical analysis
The differences of AUC values were tested by χ2 analysis using JMP statistical software package (v. 13.0.0; SAS Institute, Cary, NC). The level of significance was set at p < 0.05.
Results
An example of learning results obtained by deep learning after 300 epochs are shown in Figure 4. The accuracy, sensitivity, and specificity of the deep learning system were respectively 96.0%, 100% and 92.0% (Table 1). As for the experienced radiologists, the corresponding values were 98.3%, 99.3% and 97.3%, while those of inexperienced radiologists were 83.5%, 77.9% and 89.2%. The AUC of the inexperienced radiologists showed significant differences from those of deep learning system (p < 0.0001) and experienced radiologists (p < 0.0001) (Table 2 and Figure 5). No difference but borderline p value (p = 0.058) was found between the deep learning system and the experienced radiologists.
Figure 4.
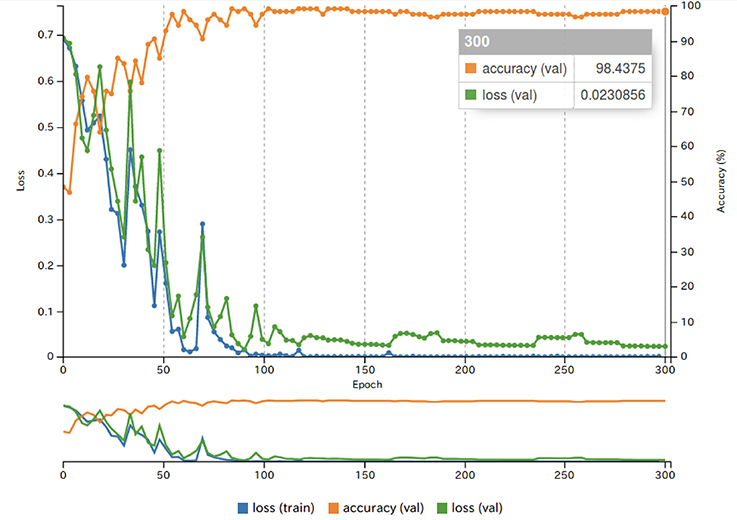
The results of learning using image patches of each ROI. The blue line shows the loss on the training data set. The green line shows the loss on the validation data set. These losses represent the fit between a prediction and the ground-truth label, and decreases over time as training improves. The orange line shows the accuracy during the training process. The accuracy increases over time, reaching a final accuracy of 98.4% at the final epoch. ROI, region of interest.
Table 1.
Diagnostic performance of deep learning and radiologists.
| Deep Learning | Experienced radiologistsa | Inexperienced radiologistsa | |
| Accuracy (%) | 96.0 | 98.3 + 0.58 | 83.5 + 2.19 |
| Sensitivity (%) | 100 | 99.3 ± 1.15 | 77.9 ± 8.32 |
| Specificity (%) | 92.0 | 97.3 ± 2.30 | 89.2 ± 7.47 |
Presented as mean ± standard deviation.
Table 2.
Comparision of diagnostic performance in AUCs with deep learning and radiologists.
| Deep Learning | Experienced radiologists | Inexperienced radiologists | |
| AUC | 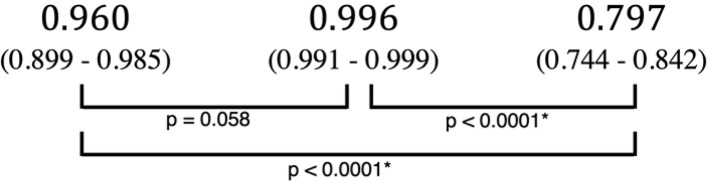 |
||
AUC, area under the curve.
The 95% confidence interval are shown in parentheses.
Figure 5.
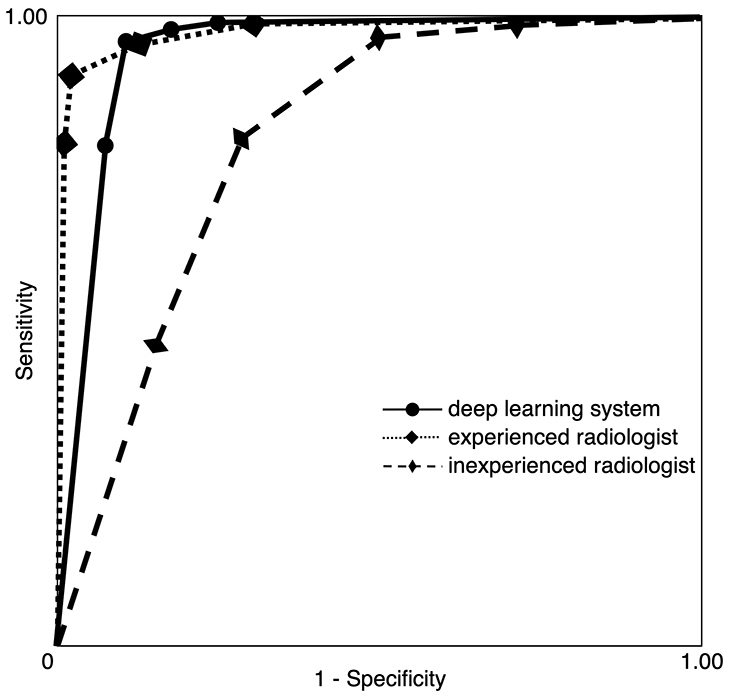
Receiver operating characteristic curves for the deep learning system and radiologists. The AUCs were 0.960, 0.996 and 0.797 for the deep learning system, experienced radiologists and inexperienced radiologists, respectively. AUC, area under the curve.
Discussion
Various methods of diagnostic imaging, including scintigraphy,17,18 have been employed for diagnosis of SjS, among which CT,7 MRI,5–9 and ultrasonography18–20 are reported to show high diagnostic performance and have tended to replace traditional sialography. As for CT, Sun et al7 reported that the sensitivity and specificity were higher than 80 and 90%, respectively, and they emphasized the finding of diffuse abnormal fat deposition in the parotid parenchyma. Although fat deposition can be evaluated quantitatively by MR spectroscopy,21,22 this feature is also useful for diagnosis of SjS by conventional MRI examination.5,6,8 While fatty change on CT is thought to be a key finding, it may be difficult to detect for inexperienced observers who had no experiences of interpretation of SjS appearance of parotid gland on CT. They likely overlook the appearance of SjS frequently when they interpret diseases in the maxillofacial region other than parotid gland. Therefore, the present study was conducted to investigate the possibility of deep learning system as a diagnostic support for inexperienced radiologists to avoid the oversight. The deep learning system appeared to have a potential of diagnostic support because it showed sufficiently high performance equivalent or just inferior to the experienced radiologists or those reported previously.10,11,14,16 SjS patients sometimes have malignant lymphoma23 or multiple sialoliths in the parotid gland,7,24 so CT may be performed to exclude such diagnoses.
In recent years, automated diagnosis using deep learning has attracted attention and usefulness of deep learning for providing diagnostic support has been reported in various CT fields. Choi et al10 develop and validated a deep learning system that could assess the stage of liver fibrosis on CT by using pathologic staging as the gold standard, and reported a relatively high accuracy of 79.4%. When limited to severe disease (significant and advanced fibrosis and cirrhosis), diagnostic performance improved further and the accuracy increased from 92.1 to 95.0%. Walsh et al11 applied a deep learning system for automated classification of fibrotic lung disease on CT and reported that its accuracy was 73.3%, equivalent to thoracic radiologists. They concluded that CT evaluation by a deep learning algorithm might provide low-cost, reproducible, and near-instantaneous classification of fibrotic lung disease with human-level accuracy, and they emphasized the possible use of diagnostic support at centers with little thoracic imaging expertise as well as for stratification of patients in clinical trials. We previously applied a deep learning system for diagnosis of cervical lymph node metastasis on contrast-enhanced CT scans of patients with oral cancer, and reported that the accuracy, sensitivity, and specificity were 78.2%, 75.4%, and 81.0%, respectively. These values and the area under the ROC curve were not different from those achieved by experienced radiologists.16
The present study had several limitations. First, although a total of 500 images were used, the number of patients was too small for final conclusions to be reached about application of deep learning to the diagnosis of SjS on CT, because the 10 images obtained from a single patient may have been similar. Further analysis will be needed in a larger number of patients and control subjects using other CT scanners at other hospitals. Second, the control subjects were all patients with normal parotid glands and none of them had pathology such as inflammation or tumors. Discrimination from inflammation may be important because sialoadenitis is the most frequent lesion in the parotid gland and SjS patients often display parotid inflammation. In this regard, the difference of CT values might contribute to discrimination between SjS and inflammation, since there is a decrease due to fat deposition in SjS vs an increase with inflammation of the parotid gland.5,25,26 Third, the images used in this study were only compressed JPEG images with 150 kB. Although the result was good for the deep learning system, future studies should be conducted to clarify the effects of other image formats and different compression degree on the diagnostic performances.
A fundamental problem to be addressed is the provision of more advanced support for inexperienced observers. Although the testing time itself was sufficiently short, manual image segmentation requires a radiologist with sufficient experience to acquire appropriate images for classification. Therefore, future studies should be conducted to develop a completely automated segmentation system.
Conclusion
This study revealed high diagnostic performance of a deep learning system for detection of SjS on CT. The AUC of deep learning system were significantly higher than those of inexperienced radiologists, with equivalent to those of experienced radiologists. Thus, the deep learning system could possibly be employed to provide diagnostic support.
REFERENCES
- 1.Fujibayashi T, Sugai S, Miyasaka N, Hayashi Y, Tsubota K. Revised Japanese criteria for Sjögren's syndrome (1999): availability and validity. Mod Rheumatol 2004; 14: 425–34. doi: 10.3109/s10165-004-0338-x [DOI] [PubMed] [Google Scholar]
- 2.Vitali C, Bombardieri S, Jonsson R, Moutsopoulos HM, Alexander EL, Carsons SE, et al. . Classification criteria for Sjögren's syndrome: a revised version of the European criteria proposed by the American-European consensus group. Ann Rheum Dis 2002; 61: 554–8. doi: 10.1136/ard.61.6.554 [DOI] [PMC free article] [PubMed] [Google Scholar]
- 3.Shiboski SC, Shiboski CH, Criswell LA, Baer AN, Challacombe S, Lanfranchi H, et al. . American College of rheumatology classification criteria for Sjögren's syndrome: a data-driven, expert consensus approach in the Sjögren's international collaborative clinical alliance cohort. Arthritis Care Res 2012; 64: 475–87. doi: 10.1002/acr.21591 [DOI] [PMC free article] [PubMed] [Google Scholar]
- 4.Shiboski CH, Shiboski SC, Seror R, Criswell LA, Labetoulle M, Lietman TM, et al. . American College of Rheumatology/European League against rheumatism classification criteria for primary Sjögren's syndrome: a consensus and data-driven methodology involving three international patient cohorts. Arthritis Rheumatol 2016; 2017: 35–45. [DOI] [PMC free article] [PubMed] [Google Scholar]
- 5.Izumi M, Eguchi K, Nakamura H, Nagataki S, Nakamura T. Premature fat deposition in the salivary glands associated with Sjögren syndrome: MR and CT evidence. AJNR Am J Neuroradiol 1997; 18: 951–8. [PMC free article] [PubMed] [Google Scholar]
- 6.Takagi Y, Sumi M, Sumi T, Ichikawa Y, Nakamura T. Mr microscopy of the parotid glands in patients with Sjogren's syndrome: quantitative MR diagnostic criteria. AJNR Am J Neuroradiol 2005; 26: 1207–14. [PMC free article] [PubMed] [Google Scholar]
- 7.Sun Z, Zhang Z, Fu K, Zhao Y, Liu D, Ma X. Diagnostic accuracy of parotid CT for identifying Sjögren's syndrome. Eur J Radiol 2012; 81: 2702–9. doi: 10.1016/j.ejrad.2011.12.034 [DOI] [PubMed] [Google Scholar]
- 8.Kojima I, Sakamoto M, Iikubo M, Kumamoto H, Muroi A, Sugawara Y, et al. . Diagnostic performance of MR imaging of three major salivary glands for Sjögren's syndrome. Oral Dis 2017; 23: 84–90. doi: 10.1111/odi.12577 [DOI] [PubMed] [Google Scholar]
- 9.Chu C, Zhang H, Zhou N, Dou X, Li M, Liu S, et al. . Diffusional kurtosis imaging of parotid glands in Sjögren's syndrome: Initial findings. J Magn Reson Imaging 2017; 46: 1409–17. doi: 10.1002/jmri.25697 [DOI] [PubMed] [Google Scholar]
- 10.Choi KJ, Jang JK, Lee SS, Sung YS, Shim WH, Kim HS, et al. . Development and validation of a deep learning system for staging liver fibrosis by using contrast Agent-enhanced CT images in the liver. Radiology 2018; 289: 688–97. doi: 10.1148/radiol.2018180763 [DOI] [PubMed] [Google Scholar]
- 11.Walsh SLF, Calandriello L, Silva M, Sverzellati N. Deep learning for classifying fibrotic lung disease on high-resolution computed tomography: a case-cohort study. Lancet Respir Med 2018; 6: 837–45. doi: 10.1016/S2213-2600(18)30286-8 [DOI] [PubMed] [Google Scholar]
- 12.Song Q, Zhao L, Luo X, Dou X. Using deep learning for classification of lung nodules on computed tomography images. Journal of Healthcare Engineering 2017; 2017: 1–7. doi: 10.1155/2017/8314740 [DOI] [PMC free article] [PubMed] [Google Scholar]
- 13.Gao XW, Hui R, Tian Z. Classification of CT brain images based on deep learning networks. Comput Methods Programs Biomed 2017; 138: 49–56. doi: 10.1016/j.cmpb.2016.10.007 [DOI] [PubMed] [Google Scholar]
- 14.Becker AS, Mueller M, Stoffel E, Marcon M, Ghafoor S, Boss A. Classification of breast cancer in ultrasound imaging using a generic deep learning analysis software: a pilot study. Br J Radiol 2018; 91: 20170576. doi: 10.1259/bjr.20170576 [DOI] [PMC free article] [PubMed] [Google Scholar]
- 15.Yamashita R, Nishio M, Do RKG, Togashi K. Convolutional neural networks: an overview and application in radiology. Insights Imaging 2018; 9: 611–29. doi: 10.1007/s13244-018-0639-9 [DOI] [PMC free article] [PubMed] [Google Scholar]
- 16.Ariji Y, Fukuda M, Kise Y, Nozawa M, Yanashita Y, Fujita H, et al. . Contrast-enhanced computed tomography image assessment of cervical lymph node metastasis in patients with oral cancer by using a deep learning system of artificial intelligence. Oral Surg Oral Med Oral Pathol Oral Radiol 2019; 127: 458–63. doi: 10.1016/j.oooo.2018.10.002 [DOI] [PubMed] [Google Scholar]
- 17.Ogura I, Sasaki Y, Oda T, Sue M, Hayama K. Magnetic resonance sialography and salivary gland scintigraphy of parotid glands in Sjögren's syndrome. Chin J Dent Res 2018; 21: 63–8. doi: 10.3290/j.cjdr.a39919 [DOI] [PubMed] [Google Scholar]
- 18.Yoshiura K, Yuasa K, Tabata O, Araki K, Yonetsu K, Nakayama E, et al. . Reliability of ultrasonography and sialography in the diagnosis of Sjögren's syndrome. Oral Surgery, Oral Medicine, Oral Pathology, Oral Radiology, and Endodontology 1997; 83: 400–7. doi: 10.1016/S1079-2104(97)90249-3 [DOI] [PubMed] [Google Scholar]
- 19.Shimizu M, Okamura K, Kise Y, Takeshita Y, Furuhashi H, Weerawanich W, et al. . Effectiveness of imaging modalities for screening IgG4-related Dacryoadenitis and sialadenitis (Mikulicz's disease) and for differentiating it from Sjögren's syndrome (SS), with an emphasis on sonography. Arthritis Res Ther 2015; 17: 223. doi: 10.1186/s13075-015-0751-x [DOI] [PMC free article] [PubMed] [Google Scholar]
- 20.Ariji Y, Ohki M, Eguchi K, Izumi M, Ariji E, Mizokami A, et al. . Texture analysis of sonographic features of the parotid gland in Sjögren's syndrome. AJR Am J Roentgenol 1996; 166: 935–41. doi: 10.2214/ajr.166.4.8610577 [DOI] [PubMed] [Google Scholar]
- 21.Kise Y, Chikui T, Yamashita Y, Kobayashi K, Yoshiura K. Clinical usefulness of the mDIXON Quant the method for estimation of the salivary gland fat fraction: comparison with MR spectroscopy. Br J Radiol 2017; 90: 20160704. doi: 10.1259/bjr.20160704 [DOI] [PMC free article] [PubMed] [Google Scholar]
- 22.Chikui T, Yamashita Y, Kise Y, Saito T, Okamura K, Yoshiura K. Estimation of proton density fat fraction of the salivary gland. Br J Radiol 2018; 18: 20170671. doi: 10.1259/bjr.20170671 [DOI] [PMC free article] [PubMed] [Google Scholar]
- 23.Baldini C, Pepe P, Luciano N, Ferro F, Talarico R, Grossi S, et al. . A clinical prediction rule for lymphoma development in primary Sjögren's syndrome. J Rheumatol 2012; 39: 804–8. doi: 10.3899/jrheum.110754 [DOI] [PubMed] [Google Scholar]
- 24.Izumi M, Kise Y, Murata K, Murata A, Nakayama M, Ariji Y, et al. . Multiple calcifications within the parotid gland of patients with Sjögren's syndrome. Oral Science International 2013; 10: 28–32. doi: 10.1016/S1348-8643(12)00052-3 [DOI] [Google Scholar]
- 25.Cuida M, Halse AK, Johannessen AC, Tynning T, Jonsson R. Indicators of salivary gland inflammation in primary Sjogren's syndrome. Eur J Oral Sci 1997; 105: 228–33. doi: 10.1111/j.1600-0722.1997.tb00205.x [DOI] [PubMed] [Google Scholar]
- 26.Ariji E, Moriguchi S, Kuroki T, Kanda S. Computed tomography of maxillofacial infection. Dentomaxillofac Radiol 1991; 20: 147–51. doi: 10.1259/dmfr.20.3.1807998 [DOI] [PubMed] [Google Scholar]