

SUMMARY
Neurons in cortical circuits are often coactivated as ensembles, yet it is unclear whether ensembles play a functional role in behavior. Some ensemble neurons have pattern completion properties, triggering the entire ensemble when activated. Using two-photon holographic optogenetics in mouse primary visual cortex, we tested whether recalling ensembles by activating pattern completion neurons alters behavioral performance in a visual task. Disruption of behaviorally relevant ensembles by activation of non-selective neurons decreased performance, whereas activation of only two pattern completion neurons from behaviorally relevant ensembles improved performance, by reliably recalling the whole ensemble. Also, inappropriate behavioral choices were evoked by the mistaken activation of behaviorally relevant ensembles. Finally, in absence of visual stimuli, optogenetic activation of two pattern completion neurons could trigger behaviorally relevant ensembles and correct behavioral responses. Our results demonstrate a causal role of neuronal ensembles in a visually guided behavior and suggest that ensembles implement internal representations of perceptual states.
In Brief
The activation of a small set of pattern completion neurons via two-photon holographic optogenetics triggers neuronal ensembles that appear to be necessary and sufficient for behavior.
Graphical Abstract
INTRODUCTION
Cortical neurons often fire together as a group, rather than independently, and these coactive groups, also known as neuronal ensembles (or chains, assemblies, attractors, clicks, motifs, songs, bumps, etc.), could constitute emergent functional units of the brain, as modular building blocks of memories, thoughts, motor programs, computations, or perceptual or mental states (Abeles, 1991; Buzsáki, 2010; Churchland et al., 2012; Lorente de No, 1938; Hebb, 1949; Hopfield, 1982; Villette et al., 2015; Yuste, 2015; Cossart et al., 2003; Ikegaya et al., 2004). Using two-photon calcium imaging, neuronal ensembles can be found in mouse visual cortex within time windows of 200–500 ms (Carrillo-Reid et al., 2015b; Cossart et al., 2003; Miller et al., 2014). These ensembles are activated by visual stimuli but are also present in spontaneous activity, indicating that they can be stored and replayed by cortical circuits (Carrillo-Reid et al., 2016; MacLean et al., 2005; Miller et al., 2014). Using two-photon optogenetics in awake mice, the co-activation of a group of neurons creates artificial ensembles that are stably imprinted (Carrillo-Reid et al., 2016). Such imprinted ensembles can also be re-activated as a whole by stimulating individual neurons, demonstrating pattern completion capabilities. However, it remains unclear if cortical ensembles have a role in behavior.
To explore this, we combined calcium imaging of neuronal populations (Yuste and Katz, 1991), two-photon microscopy (Denk et al., 1990; Yuste and Denk, 1995), and population analysis (Carrillo-Reid et al., 2017a; Carrillo-Reid et al., 2015a) to identify neuronal ensembles in primary visual cortex from awake mice performing a visually guided Go/No-Go behavioral task. Then, using two-photon holographic optogenetics (Nikolenko et al., 2008; Packer et al., 2015; Rickgauer et al., 2014; Yang et al., 2018), we activated specific sets of neurons during the presentation of visual stimuli to disrupt or recall cortical ensembles while measuring behavioral performance at different contrast levels of visual stimuli. Whereas optogenetic activation of a random set of cells during high-contrast visual stimuli disrupted ensembles and deteriorated behavior, activation of neurons with pattern completion capability reliably recalled behaviorally relevant ensembles and improved task performance to low-contrast visual stimuli. Moreover, we found that the Go ensemble was also activated when the animal incorrectly responded to the No-Go stimulus, Finally, optogenetic targeting of only two behaviorally relevant pattern completion neurons could trigger behavior, even in the absence of visual stimulus, as long as the behaviorally relevant ensemble was successfully recalled. Our results demonstrate causal links between the selective activation or disruption of neuronal ensembles and a behavioral task.
RESULTS
Head-Fixed Mice Reliably Perform Go/No-Go Visual Task
We carried out simultaneous two-photon imaging (GCaMP6s, syn promoter, targeting all neurons) and two-photon holographic optogenetics (C1V1, CaMKII promoter, targeting excitatory cells) (Packer et al., 2015; Rickgauer et al., 2014; Yang et al., 2018) in layer 2/3 of primary visual cortex. Chronic imaging and optogenetics were performed in awake, head-fixed mice through a reinforced thinned-skull window (Drew et al., 2010). Mice were trained in a Go/No-Go visually guided task with orthogonal drifting-gratings as stimuli (Figures 1A and 1B). Mice underwent a regime of habituation to a treadmill and water restriction for 2 days until they reached 85% of their original weight. After this period, mice were subjected to 3 days of continuous reinforcement where water reward was delivered after the Go signal (at 100% contrast). After this reinforcement period, we reduced contrast to 50%. During this training, mice gradually learned to lick correctly when Go and No-Go visual stimuli were randomly presented. After 7 days of performing the visually guided behavioral task (at 50% contrast), mice reached a performance level above 75% that remained stable. We considered expert mice those with a behavioral performance above 75% from day 10 on (Figure 1C) (Performance = hits/ [hits+miss] – false choices/[false choices+correct rejects]). Improvement in behavioral performance (Figure 1D, left) (day 1: 31% ± 5%; expert: 97% ± 1%; **p < 0.005) was due to increased hits (Figure 1D, middle) (day 1: 83% ± 7%; expert: 99% ± 1%; **p < 0.005), reduced false choices (f.c.) (Figure 1D, right) (day 1: 52% ± 8%; expert: 3% ± 1%; **p < 0.005), and was accompanied by faster licking onset (Figure 1E) (day 1:1.711 s ± 84 s; expert: 0.988 s ± 146 s; **p < 0.005). To titrate behavioral performance, we reduced stimulus contrast (10%– 40%), depending on the animal (Figure 1F) (normal contrast: 82% ± 4%; low contrast: 54% ± 4%; **p < 0.005). These experiments demonstrated that head-fixed mice can perform precisely and consistently a visually guided Go/No-Go task.
Figure 1. Visually Guided Go/No-Go Task.

(A) Experimental design: simultaneous two-photon calcium imaging and two-photon holographic optogenetic manipulation of targeted neurons in visually guided Go/No-Go task.
(B) Performance assessment.
(C) Improvement in performance as a function of training session (n = 9 mice).
(D) Performance increased in expert mice because of increased hits and reduced false choices (**p < 0.005; n = 9 mice; Wilcoxon matched-pairs signed rank test).
(E) Licking behavior of a representative mouse showing that enhancement of behavioral performance was reflected as shorter licking delays. Colored bars: visual stimuli (Go: green; No-Go: blue; expert: day 10). Dark markers represent licks.
(F) Tuning of behavioral performance by lowering the contrast of visual stimuli in expert animals (**p < 0.005; n = 7 mice; Mann-Whitney test).
Identification of Neuronal Ensembles and Pattern Completion Neurons
To identify ensembles, we first turned the changes in fluorescence into a digital raster plot of activity (see STAR Methods). We then measured the population activity as multidimensional vectors where each vector captures neuronal co-activation at a given frame (~200 ms) (Figure 2A). The dimensionality of the vector corresponds to the total number of active neurons during the recording session. We then searched this multidimensional vector space to identify neuronal ensembles, mathematically defined as vector clusters, i.e., similar groups of co-active neurons, that could be detected using principal component analysis (PCA) (Carrillo-Reid et al., 2016) (Figure 2B). To measure these clusters, we quantified the normalized inner product between vectors and used factorization of similarity matrices of the normalized inner product of all possible vector pairs (see STAR Methods). We then used singular value decomposition (SVD) to identify neuronal ensembles, statistically defined as significant vectors clusters (Carrillo-Reid et al., 2015a; Carrillo-Reid et al., 2015b). After the identification of the ensembles, we used a conditional random field (CRF) model (Figure 2C) to find neurons that were most representative for each ensemble, on the basis of their predictability and the node strength of functional connections between neurons (Figure 2D) (Carrillo-Reid et al., 2017a). These neurons, which have pattern completion capabilities, could be then targeted for two-photon optogenetic stimulation (Figure 2E) by using holographic spatial light modulator (SLM) microscopy (Nikolenko et al., 2008) for recalling of ensembles (Carrillo-Reid et al., 2017a).
Figure 2. Identification of Neuronal Ensembles and Pattern Completion Neurons.

(A) Population vectors representing neuronal activity at different time points.
(B) Cartoon of population vectors in a multidimensional space. Each dot represents one population vector and clusters of population vectors define a neuronal ensemble. The normalized inner product compares population vectors by the cosine of the angle between any pair of vectors in a multidimensional space.
(C) Graphical representation of CRF models. Circles represent neurons. Visual stimulus is represented by an added node (square). Shaded nodes (x) represent observed data. White nodes (y) represent neurons from the graphical model. Edges indicate the mutual probabilistic dependencies between neurons. Node potentials indicate whether a neuron is active or inactive. Edge potentials represent states of adjacent neurons.
(D) Identification of pattern completion neurons defined by predictability values computed as the area under the curve (AUC) from the ROC curve and node strengths (top right neurons). Red indicates neurons with pattern completion capability. Dotted lines indicate cutoff values from random models.
(E) Neurons with pattern completion capability that co-express GCaMP6s and C1V1 were simultaneously photo-stimulated using an SLM.
Reliable Activation of Go-signal Ensembles after Training
We then characterized neuronal ensembles evoked by Go and No-Go trials by performing PCA of population vectors (Carrillo-Reid et al., 2016), finding a clear separation between Go and No-Go population vectors (Figure 3A). SVD factorization (Carrillo-Reid et al., 2015b; Carrillo-Reid et al., 2016) showed that a single ensemble was reliably activated during the Go signal, whereas No-Go visual stimuli recruited different sets of population vectors, visualized in similarity maps as different blocks of activity (Figure 3B). To quantify the similarity between Go and No-Go ensembles, we computed the normalized inner product between all population vectors that belong to the Go ensemble and compared them with all population vectors evoked by No-Go visual stimuli, and found that population vectors from the Go ensemble significantly differed from No-Go ensembles (Figure 3C) (similarity index Go: 0.35 ± 0.0271; similarity index Go versus No-Go: 0.041 ± 0.0049; p < 0.001). Inspection of the temporal course of ensemble activation computed by SVD factorization confirmed that neurons belonging to the Go ensemble reliably responded to Go stimuli, whereas variable sets of neurons responded to No-Go stimuli, and that population vectors evoked by No-Go stimuli fluctuated at different time points (Figure 3D). The spatial analysis of activated neurons revealed that Go and No-Go ensembles constituted independent yet spatially intermixed neuronal subgroups (Figure 3E). Calcium transients from neurons belonging to the Go ensemble showed reliable responses (Figure 3F) and ensemble activation onsets, defined by calcium transients 2.5 SD above basal fluorescence of neurons of the ensemble, which occurred always within 500 ms of the initiation of visual stimuli (Figure 3G). Given that licking onset occurred 1.2 s ± 0.1938 s after the visual stimuli initiation, Go ensembles were always activated before the licking behavior. A small number of Go ensemble neurons (8% ± 3%) showed activation onsets > 500 ms, but such delayed calcium transients always overlapped with the rising phase of calcium transients from neurons activated during visual stimuli (Figure 3G). Expert animals increased their movement speed after the onset of Go stimulus (day 1: 0.64 ± 0.12 rad/s; expert: 1.6 ± 0.32 rad/s; *p < 0.05) but remained without movement changes in No-Go trials (day 1:0.78 ± 0.21 rad/s; expert: 0.77 ± 0.27 rad/s; p > 0.05 n.s.). Increases in speed related to Go stimuli always followed the onset of the Go ensemble and always preceded licking onset in hit trials (onset of speed increase < 1 s). To quantify neuronal ensemble reliability, we computed the percentage of times that a given visual stimuli activated a group of neurons above chance levels by using the total number of Go or No-Go presentations. The Go ensemble was reliably activated when the Go signal was presented, whereas No-Go visual stimulus poorly recalled its associated neuronal ensembles (Figure 3H) (reliability Go: 88% ± 4%; reliability No-Go: 38% ± 4%; **p < 0.005). Fewer neurons were active during No-Go stimuli, as compared with Go stimuli (Figure 3I) (active neurons Go: 6.5 ± 0.3; co-active neurons No-Go: 2.3 ± 0.2; ***p < 0.0006). This suggests that, as mice learn the task, Go ensembles become more reliable and less variable, whereas No-Go ensembles become less reliable and more variable, as if the response of cortical neurons to non-relevant stimuli was suppressed (Figure 3J) (Go neurons F/Fo change: 38.1% ± 1.4%; No-Go neurons F/Fo change:25.6% ± 1.96%; **p < 0.005). At the same time, the number of neurons in Go ensembles, albeit higher, was not significantly different from that of No-Go ensembles (Figure 3K) (Go ensemble neurons: 14.1 ± 1.5; No-Go ensemble neurons: 12.3 ± 1.1; p > 0.05 n.s.), Thus, in trained mice, neuronal ensembles are specifically activated by Go and No-Go stimuli, and Go ensembles are activated more reliably than No-Go ensembles.
Figure 3. Reliable Activation of Neuronal Ensembles by Go Stimulus.

(A) PCA of population vectors from a representative mouse evoked by visual stimuli show that co-active groups of neurons responding to the “Go” signal (green) define a cluster of vectors that differs from those activated by the “No-Go” signal (No-Go: blue). Each dot represents a population vector (n = 463 population vectors).
(B) Sorted similarity map from a representative mouse showing lack of overlap between population vectors from Go and No-Go ensembles.
(C) Cosine similarity between population vectors related to Go and No-Go visual stimuli from different mice. Population vectors from Go and No-Go ensembles are different (p < 0.001; n = 7 mice).
(D) Top: time course of ensembles identified with SVD (green: Go; blue: No-Go). Shown in the middle are raster plot of neurons belonging to No-Go ensembles (blue) and Go ensemble (green). Note variability in individual responses. Shown at the bottom is a histogram of activity from all recorded neurons. No-Go trials have reduced network activity. (“x” denotes missed trials for Go stimuli; “o” denotes false choice trials for No-Go stimuli).
(E) Spatial maps of same data showing subsets of neurons belong to Go and No-Go ensembles. Scale bar, 50 μm.
(F) Calcium transients from neurons belonging to Go ensemble. Shown on the right are calcium transients of Go ensemble cells aligned to the Go visual stimuli (black line represents the mean value from trials shown on the left). Scale bars, 10%; 1 s.
(G) Mean value of calcium transients from neurons belonging to the Go ensemble from the representative mouse depicted in the figure (onset is defined by first time derivative > 2.5 SD of noise level; mean onset ± SEM: 461 ± 121 ms; black line represents the mean value from all neurons). Scale bars, 10%; 1 s.
(H) Reliability of Go ensembles is higher than that of No-Go ensembles (p < 0.005; n = 7 mice).
(I) Number of co-active neurons in different mice is reduced during No-Go stimuli (p < 0.001; n = 7 mice).
(J) Higher fluorescence responses to visual stimuli from neurons that belong to the Go ensemble compared with neurons that belong to No-Go ensembles in expert mice (p < 0.005; n = 7 mice).
(K) Number of neurons from Go and No-Go ensembles is similar (p > 0.05; n = 7 mice). Mann-Whitney test.
Two-Photon Holographic Activation of Targeted Neurons
After finding that specific groups of neurons were reliably activated by behaviorally relevant stimuli, we wondered whether the activation of selective neurons could alter behavioral performance. To test this, given that the Go and No-Go ensembles are intermixed, we used two-photon holographic patterns to optogenetically activate selective sets of neurons simultaneously without affecting neighboring ones (Packer et al., 2015; Rickgauer et al., 2014; Yang et al., 2018). To perform simultaneous two-photon imaging and two-photon optogenetics, we used a holographic microscope with two lasers, one to image GCaMP6s (940 nm) and another to activate the red shifted opsin C1V1 (1,040 nm) (Yang et al., 2018). To test whether the photo-stimulation was spatially precise, we targeted different combinations of pyramidal neurons in layer 2/3 of primary visual cortex and monitored the calcium transients in them and in neighboring neurons (Figures 4A and 4B). Compared with non-targeted cells, targeted neurons showed clear changes in fluorescence evoked by photo-stimulation, (Figure 4D) (fluorescence targeted: 34% ± 3%; fluorescence non-targeted: 4% ± 0.1%; ****p < 0.0001). To deliver similar laser power to each photo-stimulated neuron (~5 mW per cell), we adjusted the photo-stimulation laser power, generating similar fluorescence responses, independently of the number of targeted neurons (Figure 4C). Finally, to explore whether the simultaneous photo-stimulation of multiple neurons affected network excitability, we measured the rate of spontaneous events from non-targeted neurons as a function of the number of photo- stimulated cells (1–9) without noticing any significant difference (Figure 4D). This demonstrated that holographic optogenetics can be used to selectively activate specific neuronal populations in awake behaving mice.
Figure 4. Holographic Two-Photon Optogenetics of Cortical Neurons.

(A) Calcium transients from neurons co-expressing C1V1 and GCaMP6s. Red shadows show reliably responsive neurons when one or multiple cells were targeted using an SLM. Note complete lack of cross activation. Scale bars, 10 s and 50% change in fluorescence.
(B) Spatial map of targeted neurons co-expressing C1V1 and GCaMP6s (red dots). Scale bar, 50 μm.
(C) Changes in fluorescence evoked in targeted neurons as a function of the number of simultaneously photo-stimulated neurons showing that there are not significant changes in calcium transients as a function of photo-stimulated neurons (p > 0.1; ANOVA test; n = 14 targeted neurons).
(D) Overall spontaneous activity of non-targeted neurons as a function of the number of simultaneously photo-stimulated neurons showing that spontaneous events in non-targeted neurons are not affected by photo-stimulation of targeted neurons (p > 0.1; ANOVA test; n = 16 non-targeted neurons).
Holographic Activation of Neurons Not Part of Go Ensembles Disrupts Ensemble Identity and Behavioral Performance
To test the causal link between neuronal ensembles and behavior, we proceeded in three steps. First, we activated, during the Go signal, randomly chosen neurons that did not belong to the Go ensemble (Figure 5A) (“Disrupt” condition = Visual stimulus + SLM stimulation of unspecific cells; 6–13 photo-stimulated neurons). The number of photo-stimulated neurons was chosen so visually evoked and disrupted ensembles had similar sizes. This manipulation degraded the identity of the Go ensemble, creating a mixed response, visualized as population vectors that clearly differed from visually evoked neuronal ensembles (Figure 5B). Accordingly, the similarity map of population vectors evoked by Go stimuli or by the Disrupt condition revealed two different clusters (Figure 5C). Population analysis demonstrated that population vectors evoked by Go stimuli were significantly different from those population vectors during the Disrupt condition (Figures 5D) (similarity index Go versus Disrupt: 0.031 ± 0.0026; similarity index Disrupt: 0.43 ± 0.0204; **p < 0.005), confirming that the Go ensembles were indeed disrupted by optogenetic stimulation of unspecific neurons. SVD vector factorization showed different neuronal ensembles reflecting Go, No-Go, and Disrupt conditions. Interestingly, the activity from both Go and No-Go ensemble neurons was significantly reduced during the Disrupt condition (Figure 5E). Neurons belonging to the Go or Disrupt ensembles had a widespread spatial distribution (Figure 5F). Calcium transients from neurons belonging to Go ensembles during the combined visual and optogenetic stimulation showed that the responsiveness of Go neurons was reduced by the activation of unspecific neurons (Figure 5G) (Go neurons visual stimuli:6.3 ± 0.3; Go neurons Disrupt conditions: 1.3 ± 0.3; **p < 0.005). Disrupt ensembles (whose targeted neurons were randomly chosen) were mostly composed of neurons not belonging to either Go or No-Go ensembles (Figure 5H) (not belonging neurons: 9.50 ± 1.1; Go neurons: 2.5 ± 0.4; No-Go neurons: 2.2 ± 0.3; **p < 0.005). Further analysis showed that the Disrupt protocol led to a reduced reliability of Go ensemble activation (Figure 5I) (Go ensemble reliability in Disrupt conditions: 4.3% ± 1%; **p < 0.005) and reduced the cross-correlation between neurons belonging to Go ensembles (Figure 5J) (cross-correlation go: 0.27 ± 0.0149; cross-correlation disrupt: 0.02 ± 0.0053; **p < 0.005). Together with these changes in the Go ensemble, the Disrupt condition also led to significant decreases in task performance (Figure 5K) (performance Go: 81.5% ± 4%; performance Disrupt: 66.8% ± 6%; *p < 0.05) because of increased missed trials and increased licking onsets (Figure 5K) (lick onset Go: 1.2 s ± 0.1938 s; lick onset Disrupt: 1.6 s ± 0.2558 s; *p < 0.05). These experiments demonstrate that the disruption of the Go ensemble by the optogenetic activation of non-specific neurons degraded behavioral performance. Thus, the targeted activation of only a few selective neurons can influence behavioral performance in an animal.
Figure 5. Unspecific Neuronal Activation Degrades Ensemble Identity and Visual Performance.

(A) Experimental protocol. Go ensemble (green); No-Go ensemble (blue). During the Disrupt condition, unspecific sets of neurons (red) (including some neurons from No-Go ensemble) are simultaneously photo-stimulated during Go stimulus presentation.
(B) Disruption of Go ensemble identity by stimulation of Disrupt neurons. PCA of population vectors evoked by “Go” stimulus alone and with concomitant photo-activation of disrupt neurons, which generates a different cortical response (red). Each dot represents a population vector.
(C) Similarity maps of population vectors. Go (green line) versus Disrupt (red line).
(D) Similarity between population vectors showing that Go and Disrupt ensembles are significantly different (p < 0.005; n = 6 mice).
(E) Top: Neuronal ensemble analysis shows an artificial neuronal ensemble (red) evoked by targeted activation of Disrupt neurons. Shown in the middle are raster plots of neurons belonging to Go and Disrupt ensembles. Shown on the bottom is a histogram of network activity from all the neurons (“x” denotes miss trials for Go visual stimuli).
(F) Spatial map of neurons from Go (green) and Disrupt ensembles (red). Optogenetic targeting included neurons belonging to No-Go ensemble (blue). Scale bar, 50 μm.
(G) Calcium transients from neurons belonging to the Go ensemble during visual stimuli and Disrupt stimuli (left). Responses of Go ensemble neurons evoked by visual stimuli decreased (right) (p < 0.005; n = 6 mice).
(H) Disrupt ensemble is composed mainly of optogenetically targeted neurons (p < 0.005; n = 6 mice).
(I) Reliability of Go ensemble during disruption is significantly decreased during disrupt protocol (p < 0.005; n = 6 mice). Green dotted line: Go ensemble reliability in control.
(J) Cross-correlation of Go ensemble neurons is significantly reduced by Disrupt protocol (p < 0.005; n = 6 mice). Mann-Whitney test.
(K) Behavioral performance is significantly decreased during Disrupt protocol (p < 0.05; n = 6 mice).
(L) Licking onset is significantly increased by Disrupt protocol (p < 0.05; n = 6 mice). Wilcoxon matched-pairs signed rank test.
Activation of Go Ensembles by Holographic Optogenetics of Pattern Completion Neurons Improves Behavioral Performance
In a second step, we investigated whether the targeted recalling of the Go ensemble by holographic activation of its pattern completion neurons could improve behavioral performance (Figure 6A). To do so, we first decreased the contrast of visual stimuli in trained mice in order to reduce task performance (Glickfeld et al., 2013), thereby increasing our sensitivity to detect behavioral changes (Figure 1F). Given that stimulation of one or a few pattern completion neurons can recall an entire ensemble (Carrillo-Reid et al., 2016), we selectively targeted pattern completion neurons from the Go ensembles. To identify these neurons, we used probabilistic graphical models that detect neurons that have a stronger functional influence in the circuit (Figure 2D) (Carrillo-Reid et al., 2017a).
Figure 6. Activation of Pattern Completion Neurons Reliably Enhances Go Ensemble and Task Performance.

(A) Experimental protocol. Go stimulus neurons (green) in low contrast conditions and simultaneously targeted pattern completion neurons (red) that belonged to the Go ensemble, with same low contrast stimulus (Recall condition).
(B) PCA of population vectors evoked by the low contrast Go stimulus (green) and concomitant low contrast Go visual stimulation and activation of pattern completion neurons (red). Each dot represents a population vector.
(C) Similarity maps of population vectors representing the Go ensemble in low contrast condition alone and with simultaneous holographic photo-stimulation.
(D) Recall condition increases Go ensemble reliability (p < 0.005; n = 6 mice).
(E) Raster plot from neurons belonging to the Go ensemble shows change in overall activity evoked by the simultaneous activation of two neurons with pattern completion capability (neurons 5 and 21; red bars). Note that the reliability of individual neuronal responses is increased (“x” denotes missed trials for the Go stimuli; “o” denotes false choice trials for the No-Go stimuli).
(F) Spatial map of layer 2/3 neurons highlighting neurons belonging to the Go ensemble (green). SLM photo-stimulated pattern completion neurons in red. Scale bar, 50 μm.
(G) Number of active neurons evoked by visual stimuli in low contrast and during concomitant photo-stimulation of pattern completion neurons (p.c. cells) and non-pattern completion neurons (non-p.c. cells) in hit and miss trials. Red shadow indicates photo-stimulation epochs (Hit trials: Go low versus Go p.c. cells: p < 0.005; Go low versus Go non-p.c. cells: p > 0.05; Miss trials: Go low versus Go p.c. cells: p < 0.0001; Go low versus Go non-p.c. cells: p > 0.05; n = 6 mice).
(H) Behavioral response to low contrast Go-Signal is significantly enhanced by the targeted activation of pattern completion neurons (p < 0.05; n = 6 mice).
(I) Increased behavioral performance is due to increased hits and reduced false choices (p < 0.05; n = 6 mice).
(J) Reliability of Go and No-Go ensembles during visual stimulation and SLM photostimulation of pattern completion neurons and non-pattern completion neurons belonging to the Go ensemble. Left: reliability of recalled Go ensemble is significantly increased from Go ensemble in low contrast conditions (p < 0.005; n = 6 mice). Right: the reliability of No-Go ensemble remains unaltered (p > 0.05; n = 6 mice). Green and blue dotted lines represent the mean values from Go and No-Go ensemble reliability in control conditions respectively.
(K) Cross-correlation of neurons belonging to the Go ensemble increased by SLM targeting of neurons with pattern completion capability but not by the targeting of non-pattern completion neurons (p < 0.005; n = 6 mice).
(L) The mean value of the licking onset was not significantly reduced under Recall conditions (p > 0.05; n = 6 mice). Mann-Whitney test (D, G, J, and K). Wilcoxon matched-pairs signed rank test (H, I, and L).
Holographic activation of at least two pattern completion neurons from the Go ensemble evoked population vectors that overlapped with population vectors evoked by Go visual stimuli in the absence of photo-stimulation, demonstrating that optogenetically recalled ensembles and visually evoked ensembles are similar (Figure 6B). Similarity maps of Go Control and Go Recall ensembles indicated that both ensembles were indistinguishable (Figure 6C). Consistent with this, the similarity between population vectors was significantly increased by photo-stimulation (Figure 6D) (similarity index Go control: 0.26 ± 0.0194; similarity index Go Recall: 0.46 ± 0.0145; **p < 0.005), demonstrating that optogenetic targeting of pattern completion neurons could reliably activate a neuronal ensemble previously activated by a behaviorally relevant stimulus. The similarity between Go Recall and Go Control ensembles was above 0.35, indicating that recalled ensembles represent the same ensembles that are linked to the correct behavioral performance. The raster plot of neurons during the Recall condition showed that Go ensemble neurons were more reliably activated during optogenetic targeting of pattern completion neurons (Figure 6E). Interestingly, during false choices, i.e., incorrect licking in the presence of No-Go visual stimuli, neuronal ensembles similar to the Go ensemble were activated (similarity index false choice: 0.23 ± 0.0139; low versus f.c.: p > 0.05 n.s.). This is consistent with the possibility that false choices were triggered by the inappropriate activation of the Go ensemble. Go Recall ensembles had a widespread spatial distribution and their neurons were not spatially clustered (Figure 6F). As demonstrated by the similarity map (Figure 6C) and raster plots (Figure 6E), the number of active neurons that belong to the Go Control ensemble was significantly increased by the targeting of pattern completion (p.c.) neurons, but not by other cells (Figure 6G) (left: active Go neurons hit trials: Go [low]: 4.2 ± 0.3; Go [p.c. cells]: 9.7 ± 0.8; Go [non-p.c. cells]: 4.7 ± 0.3; low versus p.c.: **p < 0.005; low versus non-p.c.: p > 0.05 n.s; right: active Go neurons miss trials: Go [low]: 0.9 ± 0.2; Go [p.c. cells]: 4.4 ± 0.2; Go [non p.c. cells]: 1.1 ± 0.2; low versus p.c.: ****p < 0.0001; low versus non-p.c.: p > 0.05 n.s.). The number of active neurons belonging to the Go ensemble in false choice trials was not significantly different from the number of active neurons evoked by visual stimuli with low contrast (active Go neurons false choice trials: 3.5 ± 0.3; low versus f.c.: p > 0.05 n.s.) but differed from the number of Go neurons active in miss trials (miss versus f.c.: **p <0.005). Consistent with all of this, the targeted optogenetic manipulation of pattern completion neurons significantly improved behavioral performance (Figure 6H) (performance Go [low]: 58.3% ± 4%; performance Go [Recall]: 82.6% ± 3.6%; *p < 0.05). The enhancement in behavioral performance was due to increased hits and decreased false choices (Figure 6I) (hit Go [low]: 76% ± 3.4%; hit Go [Recall]: 89.5% ± 3.3%; *p < 0.05; false choice Go [low]: 17.7% ± 4.4%; false choice Go [Recall]: 7.5% ± 3.1%; *p < 0.05). The reliability of Go Control ensembles was significantly lower than that of Go Recall ensembles but not significantly different from Go ensembles during stimulation of non-pattern completion neurons (Figure 6J) (left; reliability Go [low contrast]: 46.7% ± 5%; reliability Go [p.c. cells]: 91.5% ± 2%; Go [non-p.c. cells]: 47.5% ± 4.6%; low versus p.c. cells: **p < 0.005; low versus non-p.c. cells: p > 0.05 n.s.). No-Go ensemble reliability remained unaltered by holographic stimulation of pattern completion neurons from No-Go ensembles (Figure 6J) (right; reliability No-Go [low contrast; no optogenetics]: 40% ± 5%; reliability No-Go [low contrast with optogenetics]: 23% ± 4%; p > 0.05 n.s). The increase in Go ensemble reliability during the Recall condition was reflected as enhanced cross-correlation of Go neurons (Figure 6K) (cross-correlation Go [low contrast]: 0.22 ± 0.0089; cross-correlation Go [Recall]: 0.34 ±0.0155; **p < 0.005). Even though there was a shortening of the licking onset, this was not significant (Figure 6L) (lick onset Go [low]: 1.37 s ± 0.2623 s; lick onset go [Recall]: 1.22 s ± 0.1949 s; p > 0.05 n.s). These results demonstrate a correlation between increases in reliability of the Go ensemble by stimulation of pattern completion neurons and enhancements of behavioral performance, as evident by increased hits and decreased false choices. Thus, activating only two neurons during the stimulus presentation can increase task performance.
Behavioral Responses Elicited by Recalling of Go Ensembles by Pattern Completion Neurons in Absence of Visual Stimuli
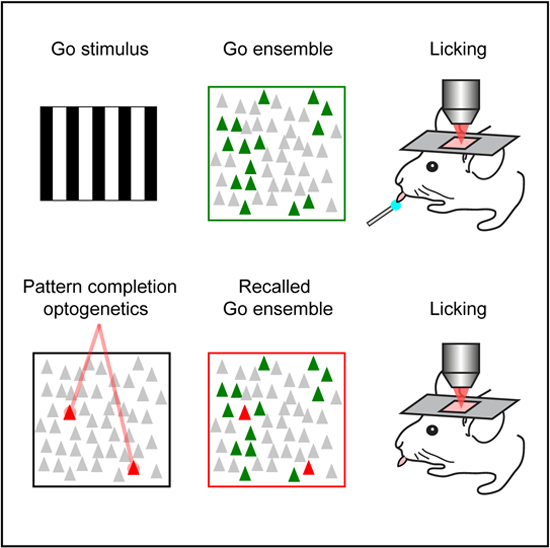
Finally, to further examine the behavioral role of ensembles, in a third step, we optogenetically recalled Go ensembles by stimulating pattern completion neurons in the absence of any visual stimulation or behavioral cues (Figure 7A). In a few instances (~5% of photo-stimulation trials), the stimulation of two neurons led to the successful recalling of the Go ensemble, and this was accompanied by a significant increase in behavioral performance compared with trials when the Go ensemble was only partially recalled (Figure 7B) (performance partial recall: 18.3% ± 2.8%; performance successful recall: 70.8% ± 3.5%; **p < 0.005). This suggests that optogenetic activation of pattern completion neurons triggered the Go ensemble, which substituted for the Go stimulus. Consistent with this, the licking onset evoked by optogenetic recalling of the Go ensemble in the absence of visual stimuli was not significantly different from that evoked by Go visual stimuli under control conditions (50% contrast), even in the absence of reward (Figure 7C) (licking onset visual stimulus: 1.2 s ± 0.1938 s; licking onset no stimulus:1.6 s ± 0.1608 s; p > 0.05 n.s.). The cross-correlation of neurons belonging to the Go ensemble was also significantly higher during successful recalling than in non-recalling trials (Figure 7D) (cross-correlation no recall: 0.12 ± 0.0064; cross-correlation recall: 0.26 ± 0.0144; **p < 0.005), indicating that Go ensemble neurons were activated together during the recalling epochs, as can be appreciated from raster plots (Figure 7E). Recalled Go ensembles in the absence of visual stimuli also had a widespread spatial distribution (Figure 7F) and similar number of recalled neurons (Figure 7G) (recalled neurons multiple: 6.5 ±1.1; p > 0.05 n.s.). These experiments demonstrate that, in the absence of visual stimuli and behavioral cues, the successful recall of the Go ensemble by stimulation of pattern completion neurons can trigger behavioral responses.
Figure 7. Behavior Induced by Recalling Go Ensemble in Absence of Visual Stimuli.

(A) Experimental conditions. Simultaneous optogenetic stimulation of pattern completion neurons in the absence of visual stimuli (animals viewed a gray screen) and behavioral cues.
(B) Behavioral performance evoked by recalling the Go ensemble by optogenetic stimulation in the absence of visual stimuli was significantly higher than performance in partially recalled trials (p < 0.005; n = 6 mice).
(C) Licking onset from successfully driven optogenetic behavioral events was not significantly different from licking onset in visual evoked behavior (p > 0.05; n = 6 mice).
(D) Paired cross-correlation of Go ensemble neurons was enhanced during successful recall, compared with partial recall trials (p < 0.005; n = 6 mice).
(E) Raster plot of most representative neurons from Go ensemble during holographic stimulation of two pattern completion neurons. Vertical red lines indicate photo-stimulation. Horizontal lines highlight targeted neurons. Red marker shows successful recalling of Go ensemble and licking behavior. Black marker shows an example of partial recall.
(F) Spatial map of E showing stimulated and recalled neurons during successful licking trial.
(G) Number of recalled neurons after optogenetic activation in the absence of visual stimuli and behavioral cues was not significantly different from active neurons evoked by visual stimuli (dotted line; p > 0.05; n = 6 mice). Mann-Whitney test. See also Figure S1.
DISCUSSION
Here, we report that recalling of behaviorally relevant cortical ensembles in layer 2/3 of mouse primary visual cortex by holographic activation of pattern completion neurons can bidirectionally alter behavioral performance and even substitute for the visual stimulus altogether, demonstrating that neuronal ensembles can control a learned behavior. These effects can be generated with as little as two pattern completion neurons, demonstrating the importance of pattern completion in cortical and brain function. Manipulation of ensemble identity by two-photon optogenetics altered behavioral performance in predictable ways: whereas activation of neurons unrelated to the perceptual task degraded behavior (Figure 5), recalling of behaviorally meaningful ensembles enhanced responses to low-contrast visual stimuli (Figure 6E). Moreover, recalling of Go ensembles by stimulation of pattern completion neurons could trigger licking in the absence of visual stimulation (Figure 7). Also, inappropriate licking during false choice trials was accompanied by activation of Go ensembles (Figure 6). Finally, we noticed, in one case, that the spontaneous activation of a Go ensemble was followed by licking (Figure S1). Albeit just a single experiment, it is consistent with a causal link between the Go ensemble and the learned behavior, even in the absence of any optogenetic stimulation. These different lines of evidence demonstrate that the activation of cortical ensembles can be necessary and sufficient for a visually guided behavior.
Pattern Completion in Neocortical Circuits
Pattern completion, defined as the ability to recall a complex pattern of information from a small part of it, is a cornerstone of human memory and of fixed action patterns and other sequential behaviors. In a neural circuit, pattern completion could occur when an activity pattern is imprinted in a set of neurons via the strengthening of its connections (Seung and Yuste, 2010). After this stage, the activation of one or a few neurons can set off the entire group. This intrinsic ability of neural circuits to generate pattern completion has been highlighted by theorists (Hebb, 1949; Marr, 1971; Hopfield, 1982; Hopfield and Tank, 1986) and experimental evidence consistent with pattern completion that has been found in hippocampus (Mizumori et al., 1989; Gold and Kesner, 2005), and has been linked to visual discrimination (Hindy et al., 2016). In addition, optogenetic stimulation of an individual neuron triggers the activation of an imprinted ensemble, a direct demonstration of pattern completion in a neural circuit (Carrillo-Reid et al., 2016). This implies that cortical circuits can function by the recalling of modules composed by groups of neurons and that these modules can be controlled by a few selected cells that can trigger them. Because of this, and regardless of its exact cellular mechanisms, in this study we used pattern completion as a tool to effectively activate neuronal ensembles and alter behavior, remarkably even if only few neurons are activated. Pattern completion might also be a key mechanism used internally by neural circuits. Chains of synchronous ensembles (Abeles, 1991) could be sequentially triggered in an all-or-none fashion through the sequential activation of pattern completion neurons and cascade through the brain, generating behavior. The demonstration that the recalling of ensembles by targeting pattern completion neurons has a behavioral outcome opens the possibility to explore pattern completion properties of different brain areas.
Comparison with Previous Findings
Previous studies have used electrical stimulation (e.g., Afraz et al., 2006; Bartlett and Doty, 1980; Brecht et al., 2004; DeAngelis et al., 1998; Doty, 1965; Gu et al., 2012; Romo et al., 1998; Salzman et al., 1990) or one-photon optogenetics (e.g., Huber et al., 2008) and reported behavioral correlates of cortical activation. Our results, activating individual neurons belonging to specific ensembles, suggest that such observed effects, including the surprising reports of individual neurons triggering motor responses (Brecht et al., 2004), could be explained by the recalling of neuronal ensembles by pattern completion neurons (Carrillo-Reid et al., 2016). In our experiments, recalling of Go ensembles only produced an enhancement of behavioral performance when at least two pattern completion neurons were activated; we were not able to recall Go ensembles by activating only one neuron (Carrillo-Reid and Yuste, unpublished data). Moreover, the fact that we can enhance or deteriorate behavioral performance depending on the exact neuron targeted indicates that animal responses after electrical microstimulation (Bartlett and Doty, 1980; Salzman et al., 1990) might critically depend on accurate recalling of appropriate ensembles. Consistent with this, during miss trials (Figures 3, 5, and 6) the co-activation of Go ensemble neurons was decreased, supporting the idea that partial recalling of ensembles, also seen by single-cell stimulation (Carrillo-Reid and Yuste, unpublished data), is not enough to produce a detectable change in behavior.
Perceptual Relevance of Recalled Ensembles
One possible interpretation of our results is that neuronal ensembles are just mirroring the sensory stimulus at the cortical level. But these same sensory-evoked ensembles can also become active spontaneously, in the absence of sensory stimuli (Carrillo-Reid et al., 2016; MacLean et al., 2005; Miller et al., 2014), even evoking behavior when activated spontaneously (Figure S1). Indeed, the optogenetic activation of Go ensembles can trigger licking in the absence of visual stimuli (Figures 7). Because of this we hypothesize that, rather than sensory, ensembles are internal representations of a stimulus, i.e., perceptual states. Thus, the perception of a visual stimulus could be internally driven, using already existing cortical states. Supporting this idea, false choices were driven by the activation of Go ensembles (Figure 6E). In this scenario, ensembles could be viewed as dynamical attractors that implement internal, perceptual, or memory states (Hopfield, 1982), rather than mere sensory responses. The ability to generate internal states of activity that exist independently of the sensory realm and that can be used to symbolize or mentally manipulate the world has been long suspected to be the purpose behind the design of recurrent neural circuits (Lorente de No, 1938; Hebb, 1949; Hopfield, 1982). Finally, our results, together with the recent demonstration that optogenetic manipulation of neurons in deep brain areas can alter social or feeding behaviors (Jennings et al., 2019) opens the possibility to study the physiological role of neuronal ensembles in other brain areas and behavioral tasks and also, potentially, to use pattern completion to manipulate neuronal ensembles and correct the pathophysiology of mental or neurological diseases (Carrillo-Reid et al., 2017b).
STAR★METHODS
LEAD CONTACT AND MATERIALS AVAILABILITY
Further information and requests for resources and reagents should be directed to and will be fulfilled by the Lead Contact: carrillo. reid@comunidad.unam.mx.
EXPERIMENTAL MODEL AND SUBJECT DETAILS
Mice
Experiments were performed on C57BL/6J male mice (JAX Laboratory) that were ~28 g, 60–90 days of age before head-plate implantation. Before behavioral experiments animals were housed on a 12 h light-dark cycle with food and water ad libitum. Mice health was checked daily. Before head-plate implantation mice were housed with littermates. After head-plate implantation each mouse was housed independently.
All experimental procedures were carried out in accordance with the US National Institutes of Health and Columbia University Institutional Animal Care and Use Committee.
METHOD DETAILS
Viral injections
Virus AAV1-syn-GCaMP6s-WPRE-SV40 (400nl; 2e13 vg/mL) and AVVdj-CaMKIIa-C1V1(E162T)-TS-P2A-mCherry-WPRE (200nl; titer 2.7e13 vg/mL) were injected simultaneously into layer 2/3 of left primary visual cortex (2.5 mm lateral and 0.3 mm anterior from the lambda, 200 μm from pia) using borosilicate pulled pipettes (tip diameter 2 μm). 40%–60% of the cells co-expressed both viruses. Virus mixture was injected at a rate of 80 nL/min, after all the volume was injected the pipette was hold for 5 min in the injection site to avoid flow back of the viruses due to pipette removal.
Headplate procedure
3 weeks after virus injection mice were anesthetized with isoflurane (1%–2%) and a custom designed titanium head plate was attached to the skull using dental cement in sterile conditions. Body temperature was maintained at 37°C with an electric heater and monitored using a rectal probe. Dexamethasone sodium phosphate (2 mg/kg) and enrofloxacin (4.47 mg/kg) were administered subcutaneously. Carprofen (5 mg/kg) was administered intraperitoneally. A reinforced thinned skull window for chronic imaging (3 mm in diameter) was made above the injection site using a dental drill. A 3-mm circular glass coverslip was placed and sealed using a cyanoacrylate adhesive (Drew et al., 2010). During the surgery eyes were moisturized with eye ointment. After surgery animals received carprofen injections for 2 days as post-operative pain medication. Mice were allowed to recover for 5 days with food and water ad libitum.
Behavioral system
We used a custom-made treadmill designed by L.C.-R. (Columbia Machine Shop) attached to an angular position magnetic sensor. The water is delivered using a solenoid valve attached to a gravity water system. The waterspout was located at 1.5 mm from the animal’s mouth. The volume delivered for each correct trial was 4 mL determined by the opening duration of the solenoid valve. Licking was monitoring with a commercial capacitive touch sensor attached to the waterspout. All signals were recorded to a host computer using a Digital Acquisition Board using MATLAB. An Arduino Uno connected via an USB interface to the host computer controlled visual stimulation and water delivery based on an open source design (OpenMaze.org).
Visual stimulation
Visual stimuli were generated using MATLAB Psychophysics Toolbox and displayed on an LCD monitor positioned 15 cm from the right eye at 45°to the long axis of the animal. Visual stimuli consisted of full-field sine wave drifting-gratings (contrasts: 100%, 50% and < 40%, 0.035 cycles/°, 2 cycles/sec) drifting in two orthogonal directions (0°and 90°) presented for 2 s, followed by 6 s of mean luminescence. Experiments in the absence of visual stimuli were recorded with the monitor displaying a gray screen with mean luminescence similar to drifting-gratings.
Behavioral training
After recovery from head-plate implantation mice were weighted and handled for 2 days under water restriction until they reach 85% of their original weight, during this time mice underwent a habituation training to lick the waterspout and maneuver on the treadmill for 15–30 min daily. One hour before behavioral training food was removed. After the habituation period mice underwent a training phase for 3 days consisting in one session of 200 trials where water reward was automatically delivered following the Go signal (contrast 100%). Licking during the No-Go signal was punished with high-frequency noise (200Hz). Following the training phase mice licked preferentially in water reward periods and avoided licking in No-Go periods. After the training phase the task phase began (day 1) where Go and No-Go visual stimuli (contrast 50%) were presented randomly using a MATLAB random number generator in two sessions of 150 trials, each session was separated by 10 min. Each stimulus was presented 50% of the time, avoiding presentation of the same stimulus more than two times in a row. After 7 days of the task phase mice reached a performance level above 75% that plateau for at least 8 days. Daily water supplementation was done to keep weight at 85% of the original value before animals were kept in their home cages overnight where food was available ad libitum.
Performance was calculated during the task phase as p = hits/(hits+miss) – false choices/(false choices+correct rejects).
Simultaneous two-photon calcium imaging and photostimulation
Imaging experiments were preformed 7–28 days after head plate fixation. During recording sessions mouse is awake (head fixed) and can move freely on a treadmill. The imaging setup and the objective were completely enclosed with blackout fabric and a black electrical tape to avoid light contamination leaking into the PMTs. We used calcium imaging to monitor the activity of neuronal populations (Yuste and Katz, 1991). Two-photon imaging and optogenetic photostimulation were performed with two different femtosecond-pulsed lasers attached to a commercial microscope. An imaging laser (Ti:sapphire; λ = 940 nm) was used to excite a genetically encoded calcium indicator (GCaMP6s) while a photostimulation laser (low repetition rate pulse-amplified laser; λ = 1040 nm) was used to excite a red shifted opsin (C1V1) that preferentially responds to longer wavelengths (Packer et al., 2012). The power of both lasers was controlled by two independent pockels cells.
The two laser beams on the sample are individually controlled by two independent sets of galvanometric scanning mirrors. The imaged field of view was ~240×240 mm (25X NA 1.05 XLPlan N objective), comprising 50–120 neurons. Short movies (~ 720 s) with a sample rate of 200–250 ms/frame were collected at time intervals of 5–10 min for up to 2 h (Imaging laser power < 50 mW; dwell time 2 μs/pixel; 256 3 256 pixels in the whole field of view).
Population photostimulation was performed splitting the laser beam into multiple foci using holographic stimulation through a Spatial Light Modulator (SLM). We adjusted the power of photostimulation in each neuron (Photostimulation laser power ~5 mW) such that the amplitude of calcium transients evoked by C1V1 activation was not significantly different to the amplitude of calcium transients evoked by visual stimulation with drifting-gratings as previously shown (Carrillo-Reid et al., 2016). Single-cell photostimulation was performed with a spiral pattern scanned by a pair of post-SLM galvanometric mirrors delivered from the center of the cell to the boundaries of the soma at 0.001 pix/μs (12 μm diameter; 20 Hz) for one second. Photostimulation began 50 ms after the onset of visual stimuli. The pulse repetition rate for photostimulation laser was 1MHz.
Simultaneous imaging and photostimulation was controlled by Prairie View and custom-made software running in MATLAB.
For imaging experiments during behavioral task (identification of ensembles, recalling, and disrupt experiments) we performed 250 trials divided in 10 sessions (25 trials each) separated by 5 min. Each group of experiments was performed on a separate day. For all experimental conditions the first 3 sessions and the last 3 sessions were discarded from the analysis to avoid underestimation of behavioral performance due to motivation factors.
Image processing and data visualization
Image processing was performed with ImageJ (v.1.42q, National Institutes of Health) and custom-made programs written in MATLAB as previously described (Carrillo-Reid et al., 2008; Carrillo-Reid et al., 2016; Cossart et al., 2003). Acquired images were processed to correct motion artifacts using TurboReg. Regions of interest (ROIs) representing neurons were automatically identified using principal component analysis (PCA) and independent component analysis (ICA) algorithms written in MATLAB (Mukamel et al., 2009). After the identification of individual neurons spatial maps were constructed to visualize the location of each neuron. Each spatial map depicted in the figures corresponds to a representative mouse accordingly. Calcium transients were computed as changes in fluorescence: (Fi – Fo)/Fo, where Fi denotes the fluorescence intensity at any frame and Fo denotes the basal fluorescence of each neuron (Miller et al., 2014). Spikes were inferred from the gradient (first time derivative) of filtered calcium signals using a threshold of 3 standard deviations (SD) above noise. We constructed an N × T binary matrix, where N denotes the number of active neurons and T represents the total number of frames for each movie. Each row in the binary matrix represents the activity of one neuron. To visualize neuronal activity the binary matrix was plotted as a raster plot where ones are represented by dots. Each raster plot used in the figures represents the population activity of a representative mouse respectively.
Population vectors representing neuronal ensembles
The definition of neuronal population vectors is crucial for identifying neuronal ensembles. We defined a neuronal ensemble as a group of neurons with coordinated activity in a ~200 ms time window. Such time window is defined by the frame rate of our two-photon imaging system (~5Hz). Neuronal population recordings can be analyzed as multidimensional arrays in N dimensions, where each dimension at a given time T corresponds to a recorded neuron. Thus, for a field of view of 100 active neurons, the dimensionality of the array will be 100. The representation of network activity as population vectors allows the rigorous measurement of the similarity of population vectors under different experimental conditions.
To visualize multidimensional population vectors in a reduced dimensional space we performed PCA taking population vectors as the variable to measure (Carrillo-Reid et al., 2016). It is important to emphasize that for our population analysis each dot in the reduced dimensional space represents a population vector different from time-varying trajectories that are represented in reduced dimensional spaces when the changes in activity of each neuron are taken as the variable to measure. Based on our population analysis each dot in the reduced dimensional space represents a population vector and clusters of vectors therefore define a given neuronal ensemble. Because the identity of population vectors is unique for each mouse each plot representing population vectors in a reduced dimensional space showed here corresponds to a representative mouse respectively.
Identification of neuronal ensembles
To identify neuronal ensembles from population calcium imaging recordings we constructed multidimensional population vectors that contain the information of the simultaneous activity of recorded neurons. The method is based on vectorial analysis (Carrillo-Reid et al., 2015a; Carrillo-Reid et al., 2017b). Only population vectors with more active neurons in a given time than the ones expected by chance (p < 0.01) were considered for analysis. We tested the significance of population vectors against the null hypothesis that the synchronous firing of neuronal pools is given by a random process (Shmiel et al., 2006). Such population vectors can be used to compare the network activity as a function of time in different experimental conditions (Brown et al., 2005; Carrillo-Reid et al., 2008; Sasaki et al., 2007; Schreiber et al., 2003; Stopfer et al., 2003). The number of dimensions for each experiment is given by the total number of active cells during the recording time. The temporal vectorization of the network activity allows the discrimination of specific coactive groups that are repeated at different times. To measure the similarity between population vectors at different experimental conditions we computed the normalized inner product (Carrillo-Reid et al., 2008; Sasaki et al., 2007; Schreiber et al., 2003), which represents the cosine of the angle between two vectors. To identify neuronal ensembles, we constructed similarity maps from all the possible combinations of similarity values between vector pairs. Similarity maps allow the visualization in a reduced dimensional space of clusters of vectors with similar properties that in the case of neuronal population activity represent similar groups of neurons with coordinated activity that repeat at different times. Because the definition of population vectors depends on the identity of recorded neurons each one of the similarity maps represented in the figures correspond to each representative mouse accordingly. In similarity maps the time course of each neuronal ensemble is defined by each factor of the singular value decomposition (SVD) of the binary similarity map. The factorization is defined by a symmetric matrix M = V∑VT, where V and VT are orthonormal and the elements of ∑ denote the singular values. The factors from the SVD associated with a singular value whose magnitude was above chance level represent the population vectors when a recurrent ensemble was active as previously published (Carrillo-Reid et al., 2015a; Carrillo-Reid et al., 2015b; Carrillo-Reid et al., 2016). To determine if the representative population vectors that define cortical ensembles could appear by chance we shuffled the overall activity matrix preserving the dimensionality of population vectors and compared the probability distribution of similarity coefficients from real data and shuffled data.
Identification of neurons with pattern completion capability
To identify the neurons to be targeted by two-photon optogenetics we used conditional random fields (CRFs) to model the conditional probability distribution to see a given neuronal ensemble firing together (Carrillo-Reid et al., 2017a; Tang et al., 2016). We used CRFs to capture the contribution of specific neurons to the overall network activity defined by population vectors belonging to a given neuronal ensemble. We generated a graphical model where each node represents a neuron in a given ensemble and edges represent the dependencies between neurons. 90% of the recorded data were used for training and the remaining 10% were used for cross-validation. The model parameters were determined by the local maximum of the likelihood function in the parameter space. Based on the model the node strength between adjacent nodes is defined by the summation of the edge potentials representing concomitant activity between neurons. The defined node strength reflects the conditional probability of co-activation between neurons. To measure which neurons are the most important for a given ensemble we computed the standard receiver operating characteristic curve (ROC), taking as ground truth the timing of a particular visual stimuli. The computation of the area under the curve (AUC) from the ROC curve that represents the performance of each neuron and the node strength that represents the connectivity between adjacent nodes were used to capture in a two-dimensional space the most important neurons from each ensemble. As it has been shown recently, high ranked neurons observed in this two-dimensional space have the potential to recall a given ensemble. CRF models were trained using the Columbia University Yeti Shared HPC cluster. The code used for CRF models can be found at https://github.com/hanshuting/graph_ensemble.
QUANTIFICATION AND STATISTICAL ANALYSIS
We did not use a statistical power analysis to determine the number of animals used in each experiment beforehand. We determined the sample size based on previous publications that use in vivo calcium imaging in awake behaving mice. Male mice littermates were randomly assigned to experimental groups before surgeries. Experimental data were collected not blinded to experimental groups. MATLAB R2016a (MathWorks) were used for data analysis. Statistical tests were done in MATLAB R2016a or Graphpad Prism 5. Statistical details of each specific experiment can be found in figure legends. Data presented as whisker boxplots displaying median and interquartile ranges, for behavioral analyses n refers to the number of mice used. For analyses related to calibration of two-photon optogenetics n refers to the number of neurons.
DATA AND CODE AVAILABILITY
All computer code and all data are archived on the NeuroTechnology Center at Columbia University and will be made available upon reasonable request.
Supplementary Material
KEY RESOURCES TABLE
| REAGENT or RESOURCE | SOURCE | IDENTIFIER |
|---|---|---|
| Bacterial and Virus Strains | ||
| AAV1-syn-GCaMP6s-WPRE-SV40 | U Penn Vector Core | N/A |
| AWdj-CaMKIIa-C1V1(E162T)-TS-P2A-mCherry-WPRE | GVVC Stanford University | Cat#GVVC-AAV-48 |
| Experimental Models: Organisms/Strains | ||
| C57BL/6J mice | JAX Laboratory | Cat#000664 |
| Software and Algorithms | ||
| MATLAB R2016a | MathWorks | https://www.mathworks.com |
| CRF code | Tang et al., 2016 | https://github.com/kuitang/fwmatch-public |
| MATLAB code | This paper | https://github.com/hanshuting/graph_ensemble |
| Cell sort | Mukamel et al., 2009 | N/A |
Highlights.
Holographic optogenetics of pattern completion neurons recalls behavioral ensembles
Recalling stimulus-specific neuronal ensembles improves a learned behavior
Disrupting stimulus-specific ensembles degrades a learned behavior
Activating 2 pattern completion neurons without any visual stimulus triggers behavior
ACKNOWLEDGMENTS
Laboratory members. Stanford Neuroscience Gene Vector and Virus Core for AAVDJ virus. Clay Lacefield for advice in the behavioral setup (OpenMaze.org). Supported by the National Eye Institute (DP1EY024503, R01EY011787), National Institute of Mental Health (R01MH115900) and Defense Advanced Research Projects Agency (SIMPLEX N66001–15-C-4032). This material is based upon work supported by, or in part by, the U. S. Army Research Laboratory and the U. S. Army Research Office (Contract W911NF-12-1-0594, Multidisciplinary University Research Initiative [MURI]). W.Y. holds the Burroughs Wellcome Fund Career Award at the Scientific Interface. R.Y. acknowledges the support of Ikerbasque and the Donostia International Physics Center. This paper is dedicated to the memory of S. Brenner.
Footnotes
DECLARATION OF INTERESTS
R.Y. is listed as an inventor for the patent (USA Patent 9846313) “Devices, apparatus and method for providing photostimulation and imaging of structures.” The other authors declare no competing financial interests.
REFERENCES
- Abeles M (1991). Corticonics (Cambridge, England: Cambridge University Press; ). [Google Scholar]
- Afraz SR, Kiani R, and Esteky H (2006). Microstimulation of inferotemporal cortex influences face categorization. Nature 442, 692–695. [DOI] [PubMed] [Google Scholar]
- Bartlett JR, and Doty RW (1980). An exploration of the ability of macaques to detect microstimulation of striate cortex. Acta Neurobiol. Exp. (Warsz.) 40, 713–727. [PubMed] [Google Scholar]
- Brecht M, Schneider M, Sakmann B, and Margrie TW (2004). Whisker movements evoked by stimulation of single pyramidal cells in rat motor cortex. Nature 427, 704–710. [DOI] [PubMed] [Google Scholar]
- Brown SL, Joseph J, and Stopfer M (2005). Encoding a temporally structured stimulus with a temporally structured neural representation. Nat. Neurosci 8, 1568–1576. [DOI] [PubMed] [Google Scholar]
- Buzsáki G (2010). Neural syntax: cell assemblies, synapsembles, and readers. Neuron 68, 362–385. [DOI] [PMC free article] [PubMed] [Google Scholar]
- Carrillo-Reid L, Tecuapetla F, Tapia D, Hernández-Cruz A, Galarraga E, Drucker-Colin R, and Bargas J (2008). Encoding network states by striatal cell assemblies. J. Neurophysiol 99, 1435–1450. [DOI] [PubMed] [Google Scholar]
- Carrillo-Reid L, Lopez-Huerta VG, Garcia-Munoz M, Theiss S, and Arbuthnott GW (2015a). Cell assembly signatures defined by short-term synaptic plasticity in cortical networks. Int. J. Neural Syst 25, 1550026. [DOI] [PubMed] [Google Scholar]
- Carrillo-Reid L, Miller JE, Hamm JP, Jackson J, and Yuste R (2015b). Endogenous sequential cortical activity evoked by visual stimuli.J. Neurosci 35, 8813–8828. [DOI] [PMC free article] [PubMed] [Google Scholar]
- Carrillo-Reid L, Yang W, Bando Y, Peterka DS, and Yuste R (2016). Imprinting and recalling cortical ensembles. Science 353, 691–694. [DOI] [PMC free article] [PubMed] [Google Scholar]
- Carrillo-Reid L, Han S, Taralova E, Jebara T, and Yuste R (2017a). Identification and targeting of cortical ensembles. bioRxiv. [Google Scholar]
- Carrillo-Reid L, Yang W, Kang Miller JE, Peterka DS, and Yuste R (2017b). Imaging and optically manipulating neuronal ensembles. Annu. Rev. Biophys 46, 271–293. [DOI] [PubMed] [Google Scholar]
- Churchland MM, Cunningham JP, Kaufman MT, Foster JD, Nuyujukian P, Ryu SI, and Shenoy KV (2012). Neural population dynamics during reaching. Nature 487, 51–56. [DOI] [PMC free article] [PubMed] [Google Scholar]
- Cossart R, Aronov D, and Yuste R (2003). Attractor dynamics of network UP states in the neocortex. Nature 423, 283–288. [DOI] [PubMed] [Google Scholar]
- DeAngelis GC, Cumming BG, and Newsome WT (1998). Cortical area MT and the perception of stereoscopic depth. Nature 394, 677–680. [DOI] [PubMed] [Google Scholar]
- Denk W, Strickler JH, and Webb WW (1990). Two-photon laser scanning fluorescence microscopy. Science 248, 73–76. [DOI] [PubMed] [Google Scholar]
- Doty RW (1965). Conditioned reflexes elicited by electrical stimulation of the brain in macaques. J. Neurophysiol 28, 623–640. [DOI] [PubMed] [Google Scholar]
- Drew PJ, Shih AY, Driscoll JD, Knutsen PM, Blinder P, Davalos D, Akassoglou K, Tsai PS, and Kleinfeld D (2010). Chronic optical access through a polished and reinforced thinned skull. Nat. Methods 7, 981–984. [DOI] [PMC free article] [PubMed] [Google Scholar]
- Glickfeld LL, Histed MH, and Maunsell JH (2013). Mouse primary visual cortex is used to detect both orientation and contrast changes. J. Neurosci 33, 19416–19422. [DOI] [PMC free article] [PubMed] [Google Scholar]
- Gold AE, and Kesner RP (2005). The role of the CA3 subregion of the dorsal hippocampus in spatial pattern completion in the rat. Hippocampus 15, 808–814. [DOI] [PubMed] [Google Scholar]
- Gu Y, Deangelis GC, and Angelaki DE (2012). Causal links between dorsal medial superior temporal area neurons and multisensory heading perception.J. Neurosci 32, 2299–2313. [DOI] [PMC free article] [PubMed] [Google Scholar]
- Hebb DO (1949). The organization of behavior; a neuropsychological theory (New York: Wiley; ). [Google Scholar]
- Hindy NC, Ng FY, and Turk-Browne NB (2016). Linking pattern completion in the hippocampus to predictive coding in visual cortex. Nat. Neurosci 19, 665–667. [DOI] [PMC free article] [PubMed] [Google Scholar]
- Hopfield JJ (1982). Neural networks and physical systems with emergent collective computational abilities. Proc. Natl. Acad. Sci. USA 79, 2554–2558. [DOI] [PMC free article] [PubMed] [Google Scholar]
- Hopfield JJ, and Tank DW (1986). Computing with neural circuits: a model. Science 233, 625–633. [DOI] [PubMed] [Google Scholar]
- Huber D, Petreanu L, Ghitani N, Ranade S, Hromádka T, Mainen Z, and Svoboda K (2008). Sparse optical microstimulation in barrel cortex drives learned behaviour in freely moving mice. Nature 451, 61–64. [DOI] [PMC free article] [PubMed] [Google Scholar]
- Ikegaya Y, Aaron G, Cossart R, Aronov D, Lampl I, Ferster D, and Yuste R (2004). Synfire chains and cortical songs: temporal modules of cortical activity. Science 304, 559–564. [DOI] [PubMed] [Google Scholar]
- Jennings JH, Kim CK, Marshel JH, Raffiee M, Ye L, Quirin S, Pak S, Ramakrishnan C, and Deisseroth K (2019). Interacting neural ensembles in orbitofrontal cortex for social and feeding behaviour. Nature 565, 645–649. [DOI] [PMC free article] [PubMed] [Google Scholar]
- Lorente de No R (1938). Analysis of the activity of the chains of internuncial neurons. J. Neurophysiol 1, 207–244. [Google Scholar]
- MacLean JN, Watson BO, Aaron GB, and Yuste R (2005). Internal dynamics determine the cortical response to thalamic stimulation. Neuron 48, 811–823. [DOI] [PubMed] [Google Scholar]
- Marr D (1971). Simple memory: a theory for archicortex. Philos. Trans. R. Soc. Lond. B Biol. Sci 262, 23–81. [DOI] [PubMed] [Google Scholar]
- Miller JE, Ayzenshtat I, Carrillo-Reid L, and Yuste R (2014). Visual stimuli recruit intrinsically generated cortical ensembles. Proc. Natl. Acad. Sci. USA 111, E4053–E4061. [DOI] [PMC free article] [PubMed] [Google Scholar]
- Mizumori SJ, McNaughton BL, Barnes CA, and Fox KB (1989). Preserved spatial coding in hippocampal CA1 pyramidal cells during reversible suppression of CA3c output: evidence for pattern completion in hippocampus.J. Neurosci 9, 3915–3928. [DOI] [PMC free article] [PubMed] [Google Scholar]
- Mukamel EA, Nimmerjahn A, and Schnitzer MJ (2009). Automated analysis of cellular signals from large-scale calcium imaging data. Neuron 63, 747–760. [DOI] [PMC free article] [PubMed] [Google Scholar]
- Nikolenko V, Watson BO, Araya R, Woodruff A, Peterka DS, and Yuste R (2008). SLM microscopy: scanless two-photon imaging and photostimulation with spatial light modulators. Front. Neural Circuits 2, 5. [DOI] [PMC free article] [PubMed] [Google Scholar]
- Packer AM, Peterka DS, Hirtz JJ, Prakash R, Deisseroth K, and Yuste R (2012). Two-photon optogenetics of dendritic spines and neural circuits. Nat. Methods 9, 1202–1205. [DOI] [PMC free article] [PubMed] [Google Scholar]
- Packer AM, Russell LE, Dalgleish HW, and Häusser M (2015). Simultaneous all-optical manipulation and recording of neural circuit activity with cellular resolution in vivo. Nat. Methods 12, 140–146. [DOI] [PMC free article] [PubMed] [Google Scholar]
- Rickgauer JP, Deisseroth K, and Tank DW (2014). Simultaneous cellular-resolution optical perturbation and imaging of place cell firing fields. Nat. Neurosci 17, 1816–1824. [DOI] [PMC free article] [PubMed] [Google Scholar]
- Romo R, Hernández A, Zainos A, and Salinas E (1998). Somatosensory discrimination based on cortical microstimulation. Nature 392, 387–390. [DOI] [PubMed] [Google Scholar]
- Salzman CD, Britten KH, and Newsome WT (1990). Cortical microstimulation influences perceptual judgements of motion direction. Nature 346, 174–177. [DOI] [PubMed] [Google Scholar]
- Sasaki T, Matsuki N, and Ikegaya Y (2007). Metastability of active CA3 networks. J. Neurosci 27, 517–528. [DOI] [PMC free article] [PubMed] [Google Scholar]
- Schreiber S, Fellous JM, Whitmer D, Tiesinga P, and Sejnowski TJ (2003). A new correlation-based measure of spike timing reliability. Neurocomputing 52–54, 925–931. [DOI] [PMC free article] [PubMed] [Google Scholar]
- Seung HS, and Yuste R (2010). Neural networks In Principles of Neural Science, Kandel ER and Jessel TJ, eds. (New York: Mc Graw-Hill; ). [Google Scholar]
- Shmiel T, Drori R, Shmiel O, Ben-Shaul Y, Nadasdy Z, Shemesh M, Teicher M, and Abeles M (2006). Temporally precise cortical firing patterns are associated with distinct action segments. J. Neurophysiol 96, 2645–2652. [DOI] [PubMed] [Google Scholar]
- Stopfer M, Jayaraman V, and Laurent G (2003). Intensity versus identity coding in an olfactory system. Neuron 39, 991–1004. [DOI] [PubMed] [Google Scholar]
- Tang K, Ruozzi N, Belanger D, and Jebara T (2016). Bethe learning of graphical models via MAP decoding. artificial intelligence and statistics (AISTATS). [Google Scholar]
- Villette V, Malvache A, Tressard T, Dupuy N, and Cossart R (2015). Internally recurring hippocampal sequences as a population template of spatio-temporal information. Neuron 88, 357–366. [DOI] [PMC free article] [PubMed] [Google Scholar]
- Yang W, Carrillo-Reid L, Bando Y, Peterka DS, and Yuste R (2018). Simultaneous two-photon imaging and two-photon optogenetics of cortical circuits in three dimensions. eLife 7, e32671. [DOI] [PMC free article] [PubMed] [Google Scholar]
- Yuste R (2015). From the neuron doctrine to neural networks. Nat. Rev. Neurosci 16, 487–497. [DOI] [PubMed] [Google Scholar]
- Yuste R, and Denk W (1995). Dendritic spines as basic units of synaptic integration. Nature 375, 682–684. [DOI] [PubMed] [Google Scholar]
- Yuste R, and Katz LC (1991). Control of postsynaptic Ca2+ influx in developing neocortex by excitatory and inhibitory neurotransmitters. Neuron 6, 333–344. [DOI] [PubMed] [Google Scholar]
Associated Data
This section collects any data citations, data availability statements, or supplementary materials included in this article.
Supplementary Materials
Data Availability Statement
All computer code and all data are archived on the NeuroTechnology Center at Columbia University and will be made available upon reasonable request.