Abstract
Through adding a harmonic boost potential to smooth the system potential energy surface, Gaussian accelerated molecular dynamics (GaMD) provides enhanced sampling and free energy calculation of biomolecules without the need of predefined reaction coordinates. This work continues to improve the acceleration power and energy reweighting of the GaMD by combining the GaMD with replica exchange algorithms. Two versions of replica exchange GaMD (rex-GaMD) are presented: force constant rex-GaMD and threshold energy rex-GaMD. During simulations of force constant rex-GaMD, the boost potential can be exchanged between replicas of different harmonic force constants with fixed threshold energy. However, the algorithm of threshold energy rex-GaMD tends to switch the threshold energy between lower and upper bounds for generating different levels of boost potential. Testing simulations on three model systems, including the alanine dipeptide, chignolin and HIV protease, demonstrate that through continuous exchanges of the boost potential, the rex-GaMD simulations not only enhance the conformational transitions of the systems, but also narrow down the distribution width of the applied boost potential for accurate energetic reweighting to recover biomolecular free energy profiles.
Graphical Abstract
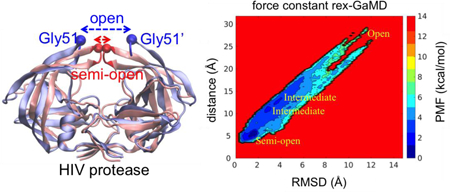
Introduction
Since the first introduction for proteins in 19771, molecular dynamics (MD) simulations have been broadly applied in diverse biological and chemical systems to study their physical movements from an atomistic view2. Through the simulations, one can gain insights into dynamic evolution of a given system, such as large-scale conformational transitions. However, the time scale of current MD simulations is typically in tens of microseconds, which may lead to insufficient sampling and limit the study of large biomolecular systems3. To overcome this, enhanced sampling methods, e.g., umbrella sampling4, metadynamics5 and targeted MD6, were developed. Prior to the simulations, pre-defined reaction coordinates or collective variables are required in order to apply a bias potential. Despite improved sampling along selected reaction coordinates using the above methods, an improper setup of the reaction coordinates will still lead to poor convergence of the simulations.
To address the challenge, unconstrained enhanced sampling methods7, such as replica exchange-MD (rexMD)8, accelerated MD (aMD)9, Gaussian aMD (GaMD)10 and Gaussian biased aMD (GbAMD)11, have been exploited. The simulations of rexMD accelerate the conformational sampling based on running multiple copies (replicas) of MD simulations and exchanging the simulations between neighboring copies. The replicas here can be defined with the temperature (parallel tempering rexMD)12 or potential energy (multicanonical rexMD) spaces13, or multidimensional extensions (Hamiltonian rexMD)14. Unlike rexMD, aMD adds a non-negative boost potential on the original energy surface to achieve enhanced sampling9. Later on, GaMD implements a modified boost potential that follows Gaussian distribution to improve the accuracy of energetic reweighting10.
GaMD is powerful in both unconstrained enhanced sampling and free energy calculations of biomolecules. The method has shown the ability to describe long timescale events, such as conformational changes in proteins and nucleic acids15, while also facilitating characterization of ligand binding quantitatively, as shown for the G-protein-coupled receptors16, T4-lysozyme10 and HIV protease17. However, the present GaMD simulations still suffer from insufficient sampling to calculate converged free energy profiles to study large complex systems or an event over hundreds of milliseconds, e.g., the substrate channeling processes of tryptophan synthase. A straightforward strategy of unraveling these problems is to increase the boost potential. However, at the same time, this will result in a wide distribution of the boost potential and imprecision of energetic reweighting.
Therefore, in the present work, we aim to improve the GaMD sampling power, while still maintaining the accuracy of free energy calculation, through combining the GaMD and replica exchange algorithms. Parallel computing of GaMD simulations at different levels of boost potential provides different acceleration states to enable the protein conformational transition crossing over a high-energy barrier and avoid being trapped in a local transient basin. Also, the distribution of the boost potential can be narrowed down by continuous exchanges of the acceleration levels.
Three model systems, alanine dipeptide, chignolin and HIV protease, were studied here to evaluate the proposed replica exchange GaMD (rex-GaMD) method. Alanine dipeptide has two rotatable backbone dihedrals, phi and psi (Figure 1A). The five minimum energy wells were identified by a 1000-ns conventional MD (cMD) simulation18. The PMF profile of the system could be recovered by three 30-ns independent GaMD simulations10. Chignolin is a fast-folding protein, including 10 amino acids (Figure 2A). The protein can fold in hundreds-of-nanoseconds19–21. Three low energy conformations, unfolded, intermediate and folded, were identified from the previous GaMD study10. HIV protease is a major target protein for drug discovery. The structure of HIV protease involves two flexible loops, called flaps, to control the access of ligands/drugs22. Both NMR and cMD simulations showed that the flaps of apo HIV protease are highly dynamic, switching between the semi-open and open states23 (Figure 3A). Thus, in this study, we will demonstrate rex-GaMD enhanced sampling and free energy calculations on the dihedral transitions of alanine dipeptide, folding of chignolin and flap motions of the HIV protease.
Figure 1:
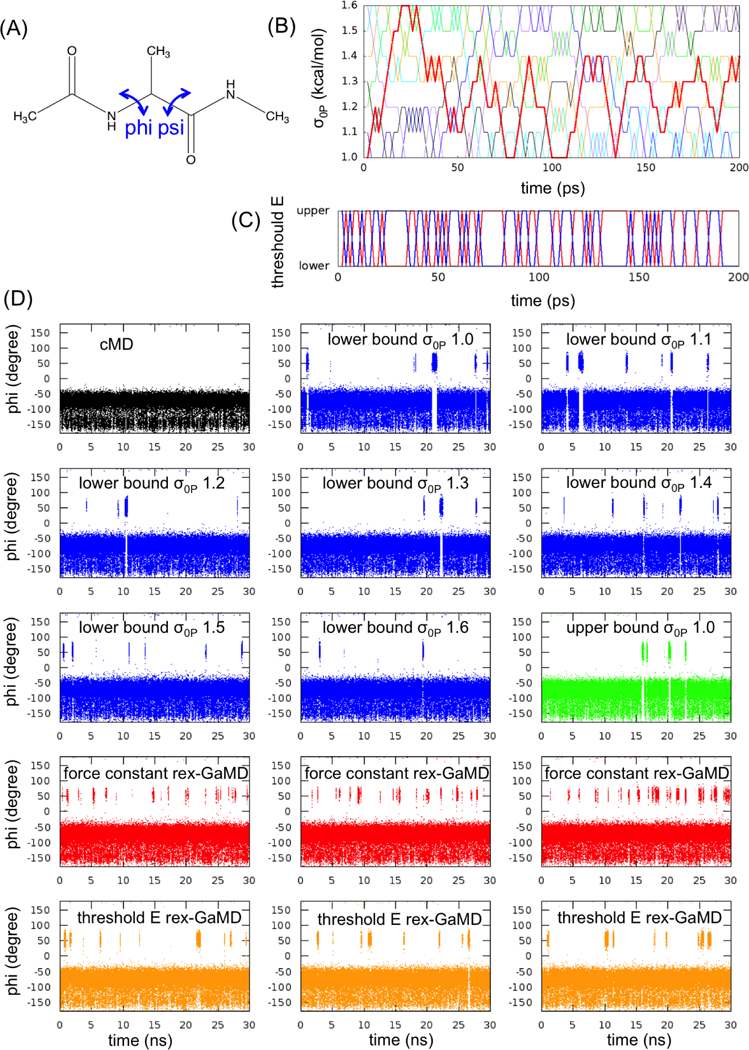
GaMD simulations of alanine dipeptide. (A) Scheme representation of backbone dihedrals, phi and psi, in alanine dipeptide. (B) The changes of σ0P value at each replica during the first 200-ps rex-GaMD simulation of alanine dipeptide. Red, blue, green, black, orange, cyan and violet indicate the replica starting from σ0P = 1.0, 1.1, 1.2, 1.3, 1.4, 1.5 and 1.6 kcal/mol, respectively. (C) The changes of threshold energy during the first 200-ps rex-GaMD simulation. Red and blue indicate the replica starting from lower and upper bound, respectively. (D) The changes of phi dihedral angle of alanine dipeptide in 30-ns GaMD simulations. Black shows the changes of phi dihedral from a cMD simulation. Blue and green show the results from conventional GaMD simulations with various σ0P values at lower and upper bound. Red and orange show the results collected from three independent rex-GaMD simulations with the replica exchange of σ0P and threshold energy. The phi values were calculated from the force constant and threshold energy rex-GaMD simulations using trajectories with σ0P = 1.0 kcal/mol and lower bound threshold energy, respectively.
Figure 2:
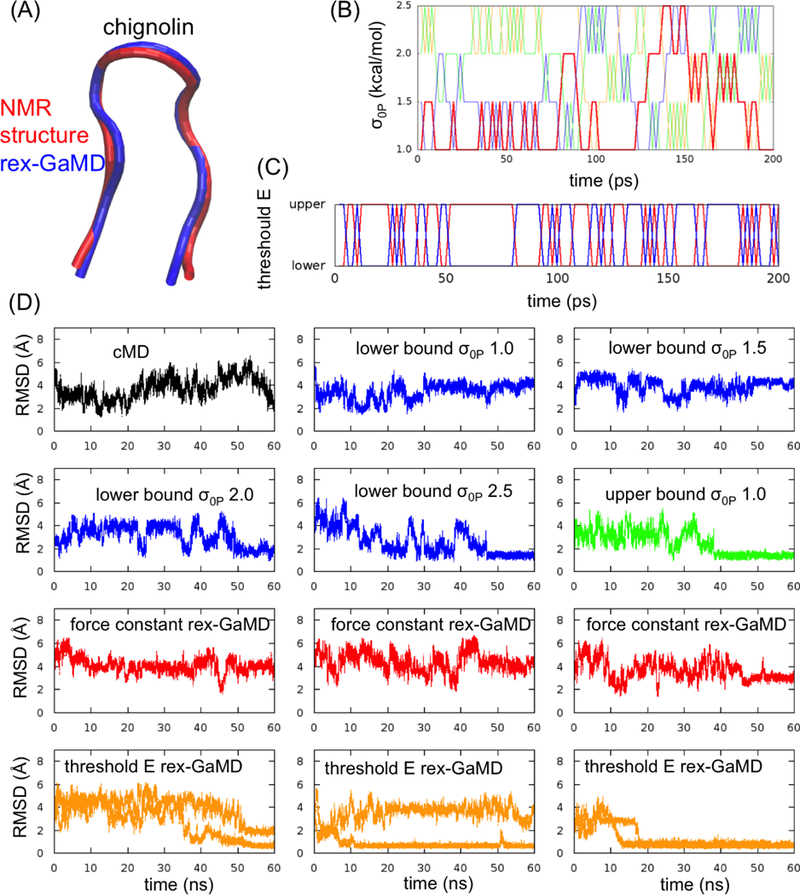
GaMD simulations of chignolin. (A) Comparison of rex-GaMD simulated-fold chignolin (blue) with the native structure from NMR (PDB ID: 1UAO) (red). (B) The changes of σ0P value at each replica during the first 200-ps rex-GaMD simulation of chignolin. Red, blue, green, and orange indicate the replica starting from σ0P = 1.0, 1.5, 2.0 and 2.5 kcal/mol, respectively. (C) The changes of threshold energy during the first 200-ps rex-GaMD simulation. Red and blue indicate the replica starting from lower and upper bound, respectively. (D) The changes of RMSD of chignolin in 60-ns GaMD simulations. Black shows the RMSD from a cMD simulation. Blue and green show the RMSD results from conventional GaMD simulations with various σ0P values at lower and upper bound. Red and orange show the results collected from three independent rex-GaMD simulations with the replica exchange of σ0P and threshold energy. The RMSD values were calculated from the force constant and threshold energy rex-GaMD simulations using trajectories with σ0P = 1.0 kcal/mol and lower bound threshold energy, respectively.
Figure 3:
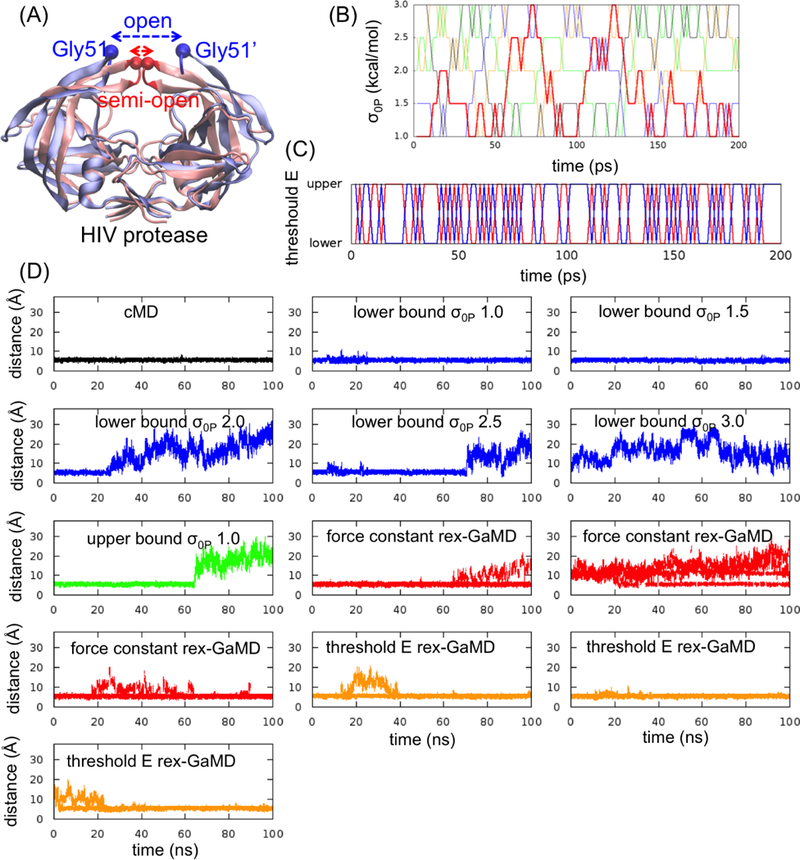
GaMD simulations of HIV protease. (A) The apo HIV protease has two major conformations, semi-open (red) and open (blue) state. To evaluate the flap opening, the atom distance between Gly51 and Gly51’ and the RMSD of flap tips (highlighted in red and blue) were computed. (B) The changes of σ0P value at each replica during the first 200-ps rex-GaMD simulation of HIV protease. Red, blue, green, orange and black indicate the replica starting from σ0P = 1.0, 1.5, 2.0, 2.5 and 3.0 kcal/mol, respectively. (C) The changes of threshold energy during the first 200-ps rex-GaMD simulation. Red and blue indicate the replica starting from lower and upper bound, respectively. (D) The changes of flap distance of HIV protease in 100-ns GaMD simulations. Black shows the flap distance from a cMD simulation. Blue and green show the distance from conventional GaMD simulations with various σ0P values at lower and upper bound. Red and orange show the results collected from three independent rex-GaMD simulations with the replica exchange of σ0P and threshold energy. The distance values were calculated from the force constant and threshold energy rex-GaMD simulations using trajectories with σ0P = 1.0 kcal/mol and lower bound threshold energy, respectively.
Theory
GaMD was developed to enhance the conformational sampling of biomolecular systems by adding a harmonic boost potential to smooth the system potential energy surface. When the system potential, , is lower than a threshold energy, E, the modified potential energy, , of the given system can be represented as a summation of the and the boost potential,
| eq.(1) |
where k is the harmonic force constant. To ensure the boost potential does not alter the overall shape of the original potential surface, the following two criteria need to be satisfied: for any two potential values, and , first, and second, . The combination of the two criteria gives
| eq.(2) |
where Vmax and Vmin are the system maximum and minimum potential energies. To ensure eq.(2) is valid, we define . By plugging into eq.(1), we then obtain
| eq.(3) |
Thus, the boost potential can be adjusted by either altering the threshold energy E or the effective force constant k0. The E can be simply controlled by setting to its lower bound, , or upper bound, , according to eq.(2). And, the k0 can be adjusted by giving different , the user-specified upper limit of standard deviation of boost potential, . To ensure accurate reweighting of free energy using cumulant expansion, the need to be small enough to satisfy . When E is set to the lower bound, k0 can be calculated as
| eq.(4) |
where Vavg and are the average and standard deviation of system potential energies. When E is set to the upper bound, k0 is set to
| eq.(5) |
if is calculated between 0 and 1. Otherwise, k0 is calculated through eq.(4). Based on eq.(4) and eq.(5), k0 is determined by assigning . Note that, according to eq.(4), a larger will give larger k0 and , which enhances the acceleration; however, it will also result in a less accuracy of reweighting. Therefore, through the exchanges within a series of , we can obtain a better acceleration power but without a loss of reweighting accuracy.
Accordingly, the current version of rex-GaMD includes two types of exchange methods. One is to switch the threshold energy E between the lower and upper bounds with a constant (termed “threshold energy” rex-GaMD). The other is to exchange the boost potentials between replicas of different user-defined with the threshold energy E fixed at its lower bound (termed “force constant” rex-GaMD). Similar to conventional GaMD, rex-GaMD allows users to access only the total potential boost , only dihedral potential boost , or the dual potential boost including both and . For the “force constant” rex-GaMD method, users can adjust and by defining different and , respectively. However, in the dual-boost rex-GaMD simulation, is automatically assigned the same value as ; in other words, is equal to at each replica.
The algorithm of rex-GaMD involves the following key steps. First, conventional MD simulations are performed to calculate potential statistics Vmax, Vmin, Vavg and . Second, carry out GaMD equilibration; at this stage, boost potential is applied and the potential statistics and GaMD acceleration parameters (the threshold energy and force constant) are updated. Third, further perform GaMD simulations at each replica. For example, if replicas are set to and , then create three sub-GaMD simulations with at 1, 2 and 3, respectively. During these simulations, boost potential is still applied, but the boost parameters are not updated. After the GaMD preparations are completed, the simulations proceed with replica exchange. The replicas are exchanged between each pair of neighboring or threshold energy at the probability that should meet the Metropolis criterion. In our system, each state x can be weighted by the Boltzmann factor,
| eq.(6) |
where kB is the Boltzmann constant, T is the system temperature and H(x) is the system Hamiltonian that is the sum of potential and kinetic energy. Because the replicas are non-interacting, the weight factor for the state X can be given by the product of the Boltzmann factor of each replica:
| eq.(7) |
where N is the number of total states. The replica exchange probability can be written as , which needs to satisfy the following equation to ensure the system reaches a detailed balance and converges toward an equilibrium distribution.
| eq.(8) |
where Xi and Xj are the states of the two nearby replicas.
This can be met when one uses the Metropolis criterion to calculate the exchange probability:
| eq.(9) |
where and V*i and V*j are the total modified system potential energies calculated from the last conformation of the above GaMD simulations at replica i and j. Based on the exchange probability calculated from eq.(9), the threshold energy or of each GaMD simulation may be altered. The simulation and exchange processes will keep repeating until the end of the simulation. Finally, the trajectories and energy information from the first replica (with the lowest boost potential) will be collected for reweighting and analysis.
Simulation protocols
System setup
The simulation systems of alanine dipeptide and chignolin were constructed as described in the previous study24. The apo structure of HIV protease was taken from the protein data bank (PDB) code 1HHP (2.70 Å resolution)22. Before starting simulations, we performed energy minimization on the alanine dipeptide. Since the chignolin and HIV protease are larger systems, the hydrogen atoms, backbone atoms and entire protein were minimized gradually. Next, we solvated the structures with TIP3P water molecules25 around 8, 11 and 11 Å of the alanine dipeptide, chignolin and HIV protease, respectively, to create a rectangular box. The counter ions, Na+ or Cl- were added to neutralize the systems. Another energy minimizations of water molecules and the entire system were further performed. The total number of atoms and number of minimization steps of each system are listed in Table 1.
Table 1:
List of steps to perform system setup and simulations. Natoms indicates total atoms of each solvated system. The minimization processes were carried out step by step including the minimization of protein hydrogen atoms (MinH), protein backbone (MinB), protein molecule (MinP), water molecules (MinW) and entire system (MinE). After executing water equilibration (EquW), the systems were gradually equilibrated at 50, 100, 150, 200, 250 and 300 K (EquS). The symbol, ntcmd, ntebprep and nteb, represent the simulation length of a cMD simulation to collect GaMD parameters, a GaMD simulation without updated boost potential and a GaMD simulation with updated boost potential, respectively.
| simulation protocol |
step | alanine dipeptide | chignolin | HIV protease |
|---|---|---|---|---|
| system information | Natoms | 1,306 | 6,251 | 25,368 |
| system minimization | MinH | N/A | 50 steps | 500 steps |
| MinB | N/A | 500 steps | 5000 steps | |
| MinP | 100 steps | 500 steps | 5000 steps | |
| Minw | 500 steps | 500 steps | 1000 steps | |
| MinE | 500 steps | 1000 steps | 5000 steps | |
| system equilibration | EquW | 10 ps | 20 ps | 100 ps |
| EquS | 1 ps | 2 ps | 10 ps | |
| cMD simulation | 1010 ps | 2050 ps | 20.4 ns | |
| GaMD preparation | ntcmd | 30 ps | 200 ps | 1.6 ns |
| ntebprep | 40 ps | 200 ps | 1.6 ns | |
| nteb | 160 ps | 2 ns | 50 ns | |
| production simulation | GaMD simulation | 30 ns | 60 ns | 100 ns |
Simulation methods
The implementation of GaMD in Amber 14 package with graphics processing unit (GPU) acceleration was applied to perform GaMD simulations10, 26–28. All systems were modeled using the Amber 14SB force field29. During both cMD and GaMD simulations, the particle mesh Ewald was turned on to consider long-range electrostatic interactions with a cutoff of 8 Å30–31. The Langevin thermostat with a damping constant of 2 ps−1 was also applied to maintain a temperature of 300 K. Bonds containing hydrogen atoms were restrained through SHAKE algorithm32. The simulations were started from water equilibration, then gradually heating the systems at 50, 100, 150, 200, 250 and 300 K. To ensure the systems reach equilibrium, an extended cMD simulation was further performed at 300 K with the isothermic-isopressure (NPT) ensemble.
Next, we executed a short cMD simulation to collect the potential statistics, such as Vmax, Vmin and Vavg, for calculating the GaMD acceleration parameters, a short GaMD simulation with applied boost potential but without updating Vmax, Vmin and Vavg values, and a long GaMD simulation with the updated boost potential. The simulation lengths of each equilibration and preparation step are shown in Table 1. From this point, we continued to perform either conventional GaMD or rex-GaMD. The rex-GaMD simulations were performed with replica exchanges attempted every 2, 2, 5 ps of the alanine dipeptide, chignolin and HIV protease systems, respectively. The simulation length of each replica for the three systems was 30, 60 and 100 ns, respectively. Three independent rex-GaMD simulations were executed for analysis to avoid a bias. In both conventional and rex-GaMD simulations, dual-boost potential was applied. The resulting trajectories were collected every 0.1 ps with a time step of 2 fs for analysis.
Simulation analysis
The CPPTRAJ33 and VMD34 tool were used to calculate time courses of dihedral angles, radius of gyration (Rg), root mean square deviation (RMSD) and atom distance. For alanine dipeptide, the backbone dihedrals, phi and psi, were calculated. For chignolin, the Rg and RMSD were measured relative to its NMR structure (PDB code: 1UAO35) with the protein Cα atoms excluding the two terminal residues, Gly1 and Gly10. In addition, we also considered the hydrogen bond distances between Ala3-Gly7 and Ala3-Thr8 to characterize the different states of chignolin. For HIV protease, we evaluated the flap opening by calculating the distance of Cα atoms between Gly51 and Gly51’ and the RMSD of flap tips (residues Ile50 to Gly52 and Ile50’ to Gly52’) relative to the 1HHP PDB structure22 (Figure 3A).
The PyReweighting18 toolkit was used to reweight the GaMD simulations to compute the two-dimensional potential of mean force (PMF) profiles. All reweighting simulations were based on cumulant expansion to the second order. A bin size of 6 degrees was applied to construct the PMF profiles of dihedrals in alanine dipeptide. For chignolin, the bin sizes of both Rg and RMSD were set to 0.2 Å. The bin size of RMSD and atom distance was 0.2 and 0.5 Å, respectively, for building the PMF profiles of HIV protease.
Results
Alanine dipeptide
The values of in range of 1.0 to 1.6 kcal/mol were selected in the rex-GaMD simulations of alanine dipeptide. A series of conventional GaMD simulations along these values were first performed. The resulting ΔVavg, σΔV and k0P are shown in Table 2A. With increase of the , boost potential energies (acceleration power) of the simulations were also enhanced from 2.20 to 3.67 kcal/mol, however, the accuracy of free energy reweighting decreased due to the escalation of σΔV. When was equal to 1.6 kcal/mol, k0P approached to 1.0, the maximum value according to eq.(4). Continuing increasing the might not further provide significantly higher boost potential; hence, we considered that the GaMD simulation achieved the highest acceleration at this condition.
Table 2:
List of ΔVavg, σΔV and k0P values obtained by GaMD simulations of alanine dipeptide. (A) The results were collected from conventional GaMD simulations with a fixed threshold energy and σ0P value. (B) The results were collected from force constant rex-GaMD simulations with the exchange of σ0P within 1.0 to 1.6 kcal/mol. Three independent simulations were performed. The ΔVavg and σΔV values were calculated at the stage of σ0P=1.0 kcal/mol. (C) The results were collected from threshold energy rex-GaMD simulations. The threshold energy was switched between lower and upper bound. The ΔVavg and σΔV values were collected when threshold energy was at the lower bound.
| (A) | ||||
|---|---|---|---|---|
| σ0P (kcal/mol) | threshold E | ΔVavg (kcal/mol) | σΔV (kcal/mol) | k0P |
| 1.0 | lower bound | 2.197 | 1.130 | 0.178 |
| 1.1 | lower bound | 2.422 | 1.129 | 0.264 |
| 1.2 | lower bound | 2.563 | 1.397 | 0.362 |
| 1.3 | lower bound | 3.126 | 1.583 | 0.434 |
| 1.4 | lower bound | 3.332 | 1.679 | 0.542 |
| 1.5 | lower bound | 3.410 | 1.771 | 0.789 |
| 1.6 | lower bound | 3.672 | 1.841 | 1.000 |
| 1.0 | upper bound | 2.570 | 1.132 | 0.130 |
| (B) | ||||
| σ0P (kcal/mol) | threshold E | ΔVavg (kcal/mol) | σΔV (kcal/mol) | k0P |
| rex-GaMD | lower bound | 2.487 | 1.144 | vary |
| rex-GaMD | lower bound | 2.396 | 1.162 | vary |
| rex-GaMD | lower bound | 2.647 | 1.139 | vary |
| (C) | ||||
| σ0P (kcal/mol) | threshold E | ΔVavg (kcal/mol) | σΔV (kcal/mol) | k0P |
| 1.0 | rex-GaMD | 2.501 | 1.124 | vary |
| 1.0 | rex-GaMD | 2.690 | 1.097 | vary |
| 1.0 | rex-GaMD | 2.556 | 1.206 | vary |
Force constant rex-GaMD simulations of alanine dipeptide were executed to adjust boost potential energies by changing the values from 1.0 to 1.6 kcal/mol. Figure 1B shows that the simulations could successfully explore all values during the fist 200 ps. Three independent rex-GaMD simulations were performed; and Figure 4A shows the 2D PMF profile of backbone dihedrals (phi and psi in Figure 1A), by reweighting the collected trajectories at =1.0 kcal/mol of the three 30-ns rex-GaMD simulations. The reweighted PMF plot could successfully recover the five minimum free energy wells, which was in agreement of the earlier conventional GaMD study10. Moreover, the backbone phi dihedral of the system has three major conformations, around −150, −75 and 50 degrees. During the 30-ns simulations, we could observe only the first two conformations in the cMD simulation (Figure 1D (black)). The conventional GaMD simulations enhanced the sampling of all three conformations the same simulation length (Figure 1D (blue)). The rex-GaMD simulations further accelerated the conformational changes, thus the increased frequency of phi dihedral rotations could be observed in Figure 1D (red). For example, the phi dihedral had 8 rotations in the conventional GaMD simulation at =1.4 kcal/mol, however, more than 20 rotations of phi dihedral could be detected in each rex-GaMD simulation. In addition to improved acceleration of the rex-GaMD, the average σΔV of the three simulations was 1.15 kcal/mol, which is close to the value when was equal to 1.0 or 1.1 kcal/mol, small enough to provide an accurate reweighting.
Figure 4:
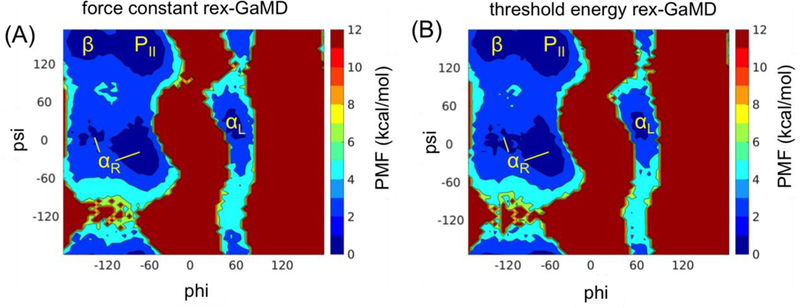
The 2D PMF plot of phi and psi backbone dihedrals of alanine dipeptide. The trajectories at σ0P = 1.0 kcal/mol of three 30-ns rex-GaMD simulations were collected to calculate the PMF using cumulant expansion to the second order. (A) and (B) indicate the results from σ0P and threshold energy rex-GaMD simulations, respectively.
Threshold energy rex-GaMD simulations were also performed at alanine dipeptide by switching the threshold energy for applying the boost potential level between the lower and upper bounds. Even during the first 200-ps, the simulation could efficiently swap the replica between the two acceleration levels (Figure 1C). The PMF profile computed from the threshold energy rex-GaMD simulations also showed the five low energy wells (Figure 4B), similar as those obtained from the force constant rex-GaMD simulations. The enhanced phi dihedral rotations are shown in Figure 1D (orange). However, compared to the force constant rex-GaMD, lower frequency of the dihedral conformational changes was detected in the threshold energy rex-GaMD. The average σΔV of the three simulations was 1.14 kcal/mol, which is similar as the value calculated from the force constant rex-GaMD. But, the σΔV of the conventional GaMD simulation at upper bound was about 1.13 kcal/mol. This value is pretty close to the σΔV value (σΔV = 1.13 kcal/mol) while the simulation was at the lower bound. Therefore, from the study of alanine dipeptide, the threshold energy rex-GaMD appeared to provide similar reweighting accuracy as the conventional GaMD.
Chignolin
In the study of chignolin, starting from an extended conformation, we first performed a cMD simulation and multiple 60-ns conventional GaMD simulations at the lower bound by gradually increasing values from 1.0 kcal/mol. All cMD and conventional GaMD simulations were not able to fold the chignolin within 60 ns except when the was set to 2.5 kcal/mol in GaMD (Figure 2D (blue)). Thus, the values between 1.0 to 2.5 kcal/mol were selected to perform force constant rex-GaMD simulations. Although the values exchanged during the simulations (Figure 2B) and the boost potential could reach 5.21 kcal/mol when = 2.5 kcal/mol (Table 3A), no folded chignolin could be identified from the three force constant rex-GaMD simulations (Figure 2D (red)). Also, no clear intermediate states could be identified from the PMF profile (Figure 5A and C).
Table 3:
List of ΔVavg, σΔV and k0P values obtained by GaMD simulations of chignolin. (A) The results were collected from conventional GaMD simulations with a fixed threshold energy and σ0P value. (B) The results were collected from force constant rex-GAMD simulations with the exchange of σ0P within 1.0 to 2.5 kcal/mol. Three independent simulations were performed. The ΔVavg and σΔV values were calculated at the stage of σ0P=1.0 kcal/mol. (C) The results were collected from threshold energy rex-GaMD simulations. The threshold energy was switched between lower and upper bound. The ΔVavg and σΔV values were collected when threshold energy was at the lower bound.
| (A) | ||||
|---|---|---|---|---|
| σ0P (kcal/mol) | threshold E | ΔVavg (kcal/mol) | σΔV (kcal/mol) | k0P |
| 1.0 | lower bound | 2.644 | 1.078 | 0.056 |
| 1.5 | lower bound | 3.976 | 1.584 | 0.120 |
| 2.0 | lower bound | 4.630 | 2.190 | 1.000 |
| 2.5 | lower bound | 5.211 | 2.323 | 1.000 |
| 1.0 | upper bound | 2.737 | 1.037 | 0.047 |
| (B) | ||||
| σ0P (kcal/mol) | threshold E | ΔVavg (kcal/mol) | σΔV (kcal/mol) | k0P |
| rex-GaMD | lower bound | 2.679 | 1.259 | vary |
| rex-GaMD | lower bound | 2.583 | 1.201 | vary |
| rex-GaMD | lower bound | 2.439 | 1.202 | vary |
| (C) | ||||
| σ0P (kcal/mol) | threshold E | ΔVavg (kcal/mol) | σΔV (kcal/mol) | k0P |
| 1.0 | rex-GaMD | 2.722 | 1.095 | vary |
| 1.0 | rex-GaMD | 2.661 | 1.037 | vary |
| 1.0 | rex-GaMD | 2.587 | 1.066 | vary |
Figure 5:
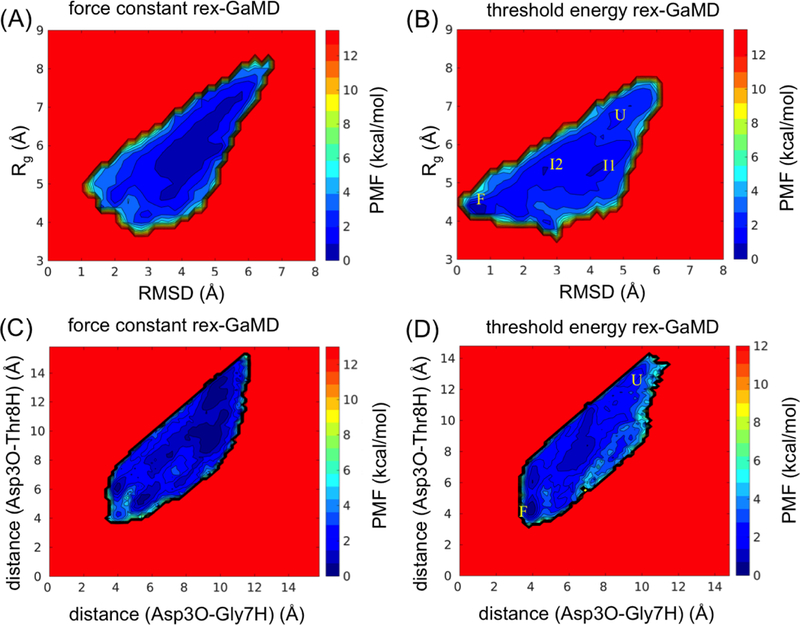
The 2D PMF plot of chignolin. The trajectories at σ0P = 1.0 kcal/mol of three 60-ns rex-GaMD simulations were collected to calculate the PMF using cumulant expansion to the second order. (A-B) reweighted PMF profiles based on RMSD and Rg of chignolin using (A) force constant and (B) threshold energy rex-GaMD simulations. The letters ‘U’, ‘F’, ‘I1’ and ‘I2’ indicate the unfolded, folded and intermediate 1 and intermediate 2 states of chignolin. (C) and (D) display the reweighted PMF profiles based on the hydrogen-bond distances between Asp3-Gly7 and Asp3-Thr8 of chignolin. The letters ‘U’ and ‘F’ indicate the unfolded and folded states of chignolin, respectively.
In comparison, the threshold energy rex-GaMD simulations were able to fold the chignolin. Two of the simulations even folded the chignolin within 15 ns (Figure 2D (orange)). The RMSD between the simulated-folded chignolin and NMR conformation (PDB code: 1UAO35) reached a minimum of 0.29 Å (Figure 2A). Moreover, the threshold energy rex-GaMD simulations allowed us to capture the chignolin in unfolded, folded and intermediate states simultaneously (Figure 2D (orange)). The four low-energy states: unfolded (U), folded (F), intermediate 1 (I1) and intermediate 2 (I2) could be identified from the reweighted PMF profile based on the RMSD and Rg of chignolin (Figure 5B). In addition, the hydrogen bond distances between Ala3-Gly7 and Ala3-Thr8 were also used to calculate the PMF. Results showed that the two hydrogen bonds were formed with ~4 Å distances when chignolin was folded in threshold energy rex-GaMD simulations (Figure 5D). The average σΔV value of the three threshold energy rex-GaMD simulations was 1.07 kcal/mol (Table 3C), being similar to the conventional GaMD.
HIV protease
Started from a semi-open form, the HIV protease system was first studied by a cMD simulation and multiple conventional GaMD simulations with the set to 1.0 to 3.0 kcal/mol. Similar to simulations of the alanine dipeptide and chignolin systems, with the increase of the values, both ΔVavg and σΔV increase (Table 4A). When the was 2.5 kcal/mol, k0P reached to the maximum 1.0 value. The flap conformation of HIV protease remained in a semi-open form during the 100-ns simulations without boost potential in cMD and with set to 1.0 and 1.5 kcal/mol in GaMD (Figure 3D (black and blue)). However, the flaps opened while was increased to 2.0 kcal/mol or the threshold energy changed from the lower to upper bound (Figure 3D (blue and green)).
Table 4:
List of ΔVavg, σΔV and k0P values obtained by GaMD simulations of HIV protease. (A) The results were collected from conventional GaMD simulations with a fixed threshold energy and σ0P value. (B) The results were collected from threshold energy rex-GAMD simulations with the exchange of σ0P within 1.0 to 3.0 kcal/mol. Three independent simulations were performed. The ΔVavg and σΔV values were calculated at the stage of σ0P=1.0 kcal/mol. (C) the results were collected from threshold energy rex-GaMD simulations. The threshold energy was switched between lower and upper bound. The ΔVavg and σΔV values were collected when threshold energy was at the lower bound.
| (A) | ||||
|---|---|---|---|---|
| σ0P (kcal/mol) | threshold E | ΔVavg (kcal/mol) | σΔV (kcal/mol) | k0P |
| 1.0 | lower bound | 2.717 | 1.019 | 0.0233 |
| 1.5 | lower bound | 4.433 | 1.564 | 0.0481 |
| 2.0 | lower bound | 6.751 | 2.094 | 0.0791 |
| 2.5 | lower bound | 6.727 | 2.768 | 1.0000 |
| 3.0 | lower bound | 7.781 | 2.969 | 1.0000 |
| 1.0 | upper bound | 2.860 | 1.016 | 0.0220 |
| (B) | ||||
| σ0P (kcal/mol) | threshold E | ΔVavg (kcal/mol) | σΔV (kcal/mol) | k0P |
| rex-GaMD | lower bound | 2.836 | 1.037 | vary |
| rex-GaMD | lower bound | 2.778 | 1.039 | vary |
| rex-GaMD | lower bound | 2.963 | 1.077 | vary |
| (C) | ||||
| σ0P (kcal/mol) | threshold E | ΔVavg (kcal/mol) | σΔV (kcal/mol) | k0P |
| 1.0 | rex-GaMD | 2.987 | 1.065 | vary |
| 1.0 | rex-GaMD | 2.800 | 1.059 | vary |
| 1.0 | rex-GaMD | 2.831 | 1.050 | vary |
Force constant rex-GaMD simulations of HIV protease accelerated the conformational transitions and allowed us to capture multiple states of HIV flaps from semi-open to fully open conformations (Figure 3D (red)). Through combining the three simulations when = 1.0 kcal/mol, the reweighted PMF profile successfully recovered the semi-open, open and two intermediate states (Figure 6A). Two of three threshold energy rex-GaMD simulations were able to capture opening of the flaps, however, the protease kept in a semi-open form most time (Figure 3D (orange)). Due to insufficient sampling in the threshold energy rex-GaMD simulations, the PMF profile did not show all the flap conformational states (Figure 6B). In addition, the average σΔV value of the three force constant and threshold energy rex-GaMD simulations was 1.05 and 1.06 kcal/mol, respectively. Both σΔV values kept the distribution of boost potential narrow enough to compute accurate free profiles.
Figure 6:
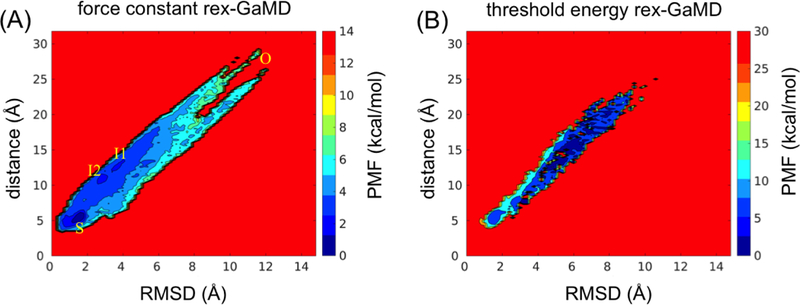
The 2D PMF plot of flap RMSD and distance of HIV protease. The trajectories at σ0P = 1.0 kcal/mol of three 100-ns rex-GaMD simulations were collected to calculate the PMF using cumulant expansion to the second order. (A) and (B) indicate the results from σ0P and threshold energy rex-GaMD simulations, respectively. The letter ‘O’ and ‘S’ indicate the flaps at open and semi-open state. The two intermediate states are labeled as ‘I1’ and ‘I2’.
Discussion
Conventional GaMD simulations provide both unconstrained enhanced sampling and free energy calculation of biomolecules through constructing a boost potential that follows Gaussian distribution. We further improved the acceleration power and accuracy of energetic reweighting of conventional GaMD by developing the two versions of rex-GaMD, force constant and threshold energy rex-GaMD. The rex-GaMD simulations allow users to provide different levels of boost potential by defining differentiated or threshold energy values. During the simulations, the boost potentials were exchanged between different levels to achieve the optimal acceleration. The accurate reweighted PMF can be obtained by collecting the information at the lowest boost energy.
The test systems in this study included alanine dipeptide, a small fast-folding protein (chignolin) and a typical protein (HIV protease). Our results showed that both force constant and threshold energy rex-GaMD simulations were able to enhance the conformational sampling for all the three systems, thus different conformational states can be captured more efficiently. However, the performance of force constant versus threshold energy rex-GaMD appeared to be system dependent. In this regard, we can first perform conventional GaMD simulations to help choosing the more efficient version of rex-GaMD. The efficiency of rex-GaMD simulation is highly related to that of conventional GaMD. For example, in case of alanine dipeptide, since the system is small, we were able to capture 3~7 phi dihedral transitions at all force constants (from σ0P = 1.0 kcal/mol to σ0P = 1.6 kcal/mol) and threshold energy levels (the lower and upper bounds) (Figure 1D (blue and green)). The rex-GaMD simulations provided further enhanced sampling, especially in the force-constant version with more than 20 phi transitions during each simulation. In the current replica exchange schemes, we have multiple acceleration levels in the force constant rex-GaMD, but only two levels (i.e., the lower and upper bounds) in the threshold energy rex-GaMD. Hence, we may expect a better performance in the version of force constant rex-GaMD, which often provides higher exchange probabilities between the replicas. With significantly more replicas, the force constant rex-GaMD also appeared to perform better for the HIV protease system than the threshold energy rex-GaMD. Particularly, in three of five conventional GaMD simulations with σ0P set to 2.0, 2.5 and 3.0 kcal/mol (Figure 3D (blue)), the HIV protease could sample the open conformation. However, in case of chignolin, the peptides remained unfolded until the end of simulations when the threshold energy was set to lower bound and force constants were small (σ0P = 1.0 kcal/mol to σ0P = 2.0 kcal/mol), which reduced the possibility to capture a folded chignolin in the force constant rex-GaMD simulations. In comparison, all systems of chignolin were able to fold in the 6 independent conventional GaMD simulations at upper bound threshold energy. Therefore, the threshold energy rex-GaMD turned out to be more efficient than the force constant rex-GaMD in simulations of chignolin.
A 2D plot of anharmonicity distribution of ΔV serves a good indicator to evaluate if the simulation is sufficiently converged for reweighting using cumulant expansion to the second order. The study of conventional GaMD reported that increased anharmonicity was noticed in the high-energy regions, e.g., the energy barriers, suggesting the free energy barriers were still unconverged and suffered from insufficient sampling10. Our conventional GaMD simulations of alanine dipeptide basically agreed with the observation that the ΔV anharmonicity of αL state was 0.80, higher than the other three states (anharmonicity below to 0.10) (Figure 7A left)10. For chignolin and HIV protease, the conventional GaMD simulations of this study could not reconstruct the unfolded state of chignolin and the open state of the HIV protease (Figure 7B and C left). We collected the results of alanine dipeptide and HIV protease from force constant rex-GaMD simulations and chignolin from threshold energy rex-GaMD simulations to construct a 2D anharmonicity distribution. Figure 7A and B right indicate that rex-GaMD simulations reduced the anharmonicity of high-energy regions of both alanine dipeptide and chignolin to <0.10, which suggests enough sampling for recovering a free energy profile. However, the increased anharmonicity in the region of the HIV protease open state indicated that the protein was still insufficiently sampled and the reweighted PMF profiles remained unconverged in the rex-GaMD simulations (Figure 7C right).
Figure 7:
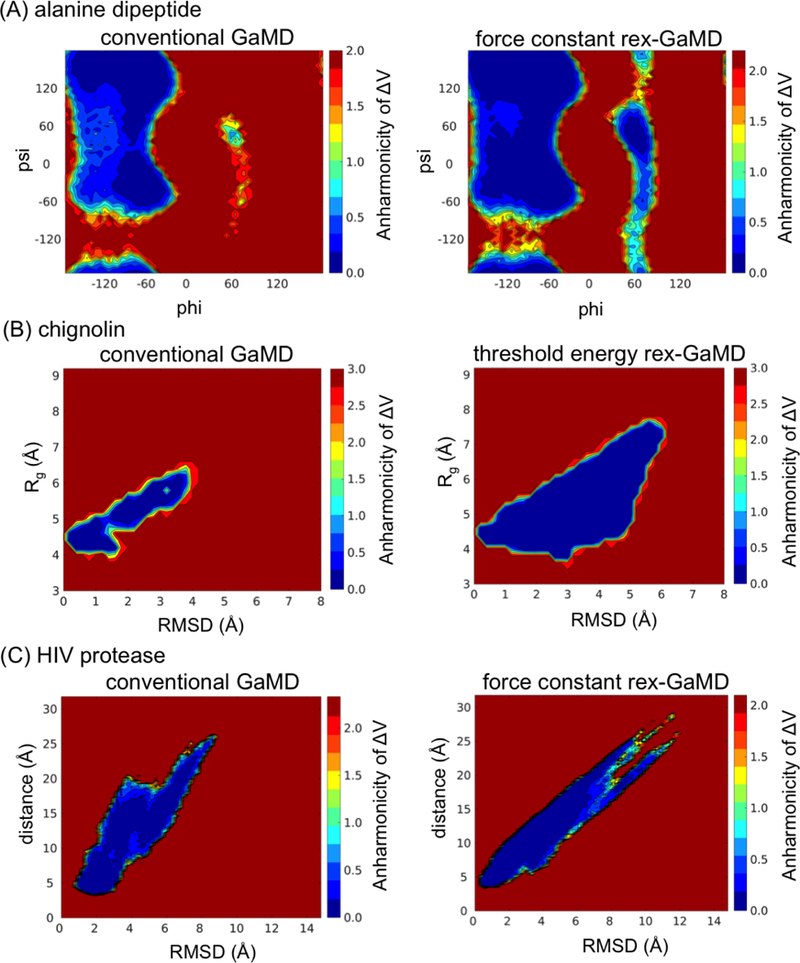
Distribution anharmonicity of ΔV. (A), (B) and (C) indicate the results collected from alanine dipeptide, chignolin and HIV protease. Left column shows the results from conventional GaMD simulations, and right column shows the results of alanine dipeptide, chignolin and HIV protease from either force constant or threshold energy rex-GaMD simulations.
In summary, the current force constant rex-GaMD has multiple replicas with different energy levels, while the threshold energy rex-GaMD has only two replicas. Adding more replicas to the threshold energy rex-GaMD between the lower and upper bounds of threshold energy and combining threshold energy and force constant replicas in a unified rex-GaMD are subject to future developments, which may further increase the exchange probabilities and improve conformational sampling of the biomolecules.
Although the present rex-GaMD simulations enhance the conformational sampling and reweighting accuracy from conventional GaMD, the sampling may still remain unconverged in the high-energy regions, especially during the simulation of large biomolecules. In the force constant rex-GaMD simulations, once k0P is increased to the 1.0 maximum, the greatest possible acceleration is reached. In the threshold energy rex-GaMD, the boost potential (ΔVavg) obtained from simulations at the upper bound of threshold energy is significantly smaller than that from simulations at the lower bound of threshold energy with highest (Table 2A, 3A and 4A). It seems the current setting of rex-GaMD has reached the greatest power of acceleration. Thus, one of directions in the future investigation is to combine the force constant rex-GaMD with threshold energy rex-GaMD for further enhanced sampling. Moreover, it is worth to note that in the current rex-GaMD algorithm, once the preparation step is completed, the GaMD parameters, Vmax, Vmin and Vavg, do not update, which means the boost potential is fixed during the simulations. Therefore, future studies also shall consider whether updating the boost potential during the rex-GaMD simulations will further facilitate the sampling for the conformations trapped in transient basin.
Acknowledgments
We thank Tillmann Utesch and Yugi Sugita for valuable discussion. This work was supported by the NIH, NBCR, and NSF supercomputer centers.
References
- 1.McCammon JA; Gelin BR; Karplus M, Dynamics of folded proteins. Nature 1977, 267 (5612), 585–590. [DOI] [PubMed] [Google Scholar]
- 2.Karplus M; McCammon JA, Molecular dynamics simulations of biomolecules. Nat. Struct. Biol. 2002, 9 (10), 788–788. [DOI] [PubMed] [Google Scholar]
- 3.Johnston JM; Filizola M, Showcasing modern molecular dynamics simulations of membrane proteins through G protein-coupled receptors. Curr. Opin. Struct. Biol. 2011, 21 (4), 552–558. [DOI] [PMC free article] [PubMed] [Google Scholar]
- 4.Torrie GM; Valleau JP, Non-physical sampling distributions in Monte-Carlo free energy estimation - umbrella sampling. J. Comput. Phys. 1977, 23 (2), 187–199. [Google Scholar]
- 5.Laio A; Gervasio FL, Metadynamics: A method to simulate rare events and reconstruct the free energy in biophysics, chemistry and material science. Reports on Progress in Physics 2008, 71 (12). [Google Scholar]
- 6.Schlitter J; Engels M; Kruger P, Targeted molecular dynamics - A new approach for searching pathways of conformational transitions. J. Mol. Graph. 1994, 12 (2), 84–89. [DOI] [PubMed] [Google Scholar]
- 7.Miao YL; McCammon JA, Unconstrained enhanced sampling for free energy calculations of biomolecules: a review. Mol. Simul. 2016, 42 (13), 1046–1055. [DOI] [PMC free article] [PubMed] [Google Scholar]
- 8.Sugita Y; Okamoto Y, Replica-exchange molecular dynamics method for protein folding. Chem. Phys. Lett. 1999, 314 (1–2), 141–151. [Google Scholar]
- 9.Hamelberg D; Mongan J; McCammon JA, Accelerated molecular dynamics: A promising and efficient simulation method for biomolecules. J. Chem. Phys. 2004, 120 (24), 11919–11929. [DOI] [PubMed] [Google Scholar]
- 10.Miao Y; Feher VA; McCammon JA, Gaussian accelerated molecular dynamics: Unconstrained enhanced sampling and free energy calculation. J. Chem. Theory Comput. 2015, 11 (8), 3584–3595. [DOI] [PMC free article] [PubMed] [Google Scholar]
- 11.Shao Q; Zhu WL, Effective conformational sampling in explicit solvent with Gaussian biased accelerated molecular dynamics. J. Chem. Theory Comput. 2017, 13 (9), 4240–4252. [DOI] [PubMed] [Google Scholar]
- 12.Marinari E; Parisi G, Simulated tempering - A new Monte-Carlo scheme. Europhys. Lett. 1992, 19 (6), 451–458. [Google Scholar]
- 13.Berg BA; Neuhaus T, Multicanonical algorithm for the first order phase transiitons. Phys. Lett. B 1991, 267 (2), 249–253. [DOI] [PubMed] [Google Scholar]
- 14.Curuksu J; Zacharias M, Enhanced conformational sampling of nucleic acids by a new Hamiltonian replica exchange molecular dynamics approach. J. Chem. Phys. 2009, 130 (10). [DOI] [PubMed] [Google Scholar]
- 15.Palermo G; Miao YL; Walker RC; Jinek M; McCammon JA, CRISPR-Cas9 conformational activation as elucidated from enhanced molecular simulations. Proc. Natl. Acad. Sci. U. S. A. 2017, 114 (28), 7260–7265. [DOI] [PMC free article] [PubMed] [Google Scholar]
- 16.Miao YL; McCammon JA, Graded activation and free energy landscapes of a muscarinic G-protein-coupled receptor. Proc. Natl. Acad. Sci. U. S. A. 2016, 113 (43), 12162–12167. [DOI] [PMC free article] [PubMed] [Google Scholar]
- 17.Miao Y; Huang YM; Walker RA C. C.; A. MJ; , Ligand binding pathways and conformational transitions of the HIV protease. In review 2017. [DOI] [PMC free article] [PubMed] [Google Scholar]
- 18.Miao YL; Sinko W; Pierce L; Bucher D; Walker RC; McCammon JA, Improved reweighting of accelerated molecular dynamics simulations for free energy calculation. J. Chem. Theory Comput. 2014, 10 (7), 2677–2689. [DOI] [PMC free article] [PubMed] [Google Scholar]
- 19.Miao YL; Feixas F; Eun CS; McCammon JA, Accelerated molecular dynamics simulations of protein folding. J. Comput. Chem. 2015, 36 (20), 1536–1549. [DOI] [PMC free article] [PubMed] [Google Scholar]
- 20.Lindorff-Larsen K; Piana S; Dror RO; Shaw DE, How fast-folding proteins fold. Science 2011, 334 (6055), 517–520. [DOI] [PubMed] [Google Scholar]
- 21.Satoh D; Shimizu K; Nakamura S; Terada T, Folding free-energy landscape of a 10-residue mini-protein, chignolin. FEBS Lett. 2006, 580 (14), 3422–3426. [DOI] [PubMed] [Google Scholar]
- 22.Spinelli S; Liu QZ; Alzari PM; Hirel PH; Poljak RJ, The 3-dimensional structure of the aspartyl protease from the HIV-1 isolate BRU. Biochimie 1991, 73 (11), 1391–1396. [DOI] [PubMed] [Google Scholar]
- 23.Cai Y; Yilmaz NK; Myint W; Ishima R; Schiffer CA, Differential flap dynamics in wild-type and a drug resistant variant of HIV-1 protease revealed by molecular dynamics and NMR relaxation. J. Chem. Theory Comput. 2012, 8 (10), 3452–3462. [DOI] [PMC free article] [PubMed] [Google Scholar]
- 24.Sinko W; Miao YL; de Oliveira CAF; McCammon JA, Population based reweighting of scaled molecular dynamics. J. Phys. Chem. B 2013, 117 (42), 12759–12768. [DOI] [PMC free article] [PubMed] [Google Scholar]
- 25.Jorgensen WL; Chandrasekhar J; Madura JD; Impey RW; Klein ML, Comparison of simple potential functions for simulating liquid water. J. Chem. Phys. 1983, 79 (2), 926–935. [Google Scholar]
- 26.Case DA; Cheatham TE; Darden T; Gohlke H; Luo R; Merz KM; Onufriev A; Simmerling C; Wang B; Woods RJ, The Amber biomolecular simulation programs. J. Comput. Chem. 2005, 26 (16), 1668–1688. [DOI] [PMC free article] [PubMed] [Google Scholar]
- 27.Salomon-Ferrer R; Case DA; Walker RC, An overview of the Amber biomolecular simulation package. WIREs Comput. Mol. Sci. 2013, 3 (2), 198–210. [Google Scholar]
- 28.Goetz AW; Williamson MJ; Xu D; Poole D; Le Grand S; Walker RC, Routine microsecond molecular dynamics simulations with AMBER on GPUs. 1. Generalized Born. J. Chem. Theory Comput. 2012, 8 (5), 1542–1555. [DOI] [PMC free article] [PubMed] [Google Scholar]
- 29.Case DA; Berryman JT; Betz RM; Cerutti DS; Cheatham TE; Darden TA; Duke RE; Giese TJ; Gohlke H; Goetz AW; Homeyer N; Izadi S; Janowski P; Kaus j.; Kovalenko A; Lee TS; LeGrand S; Li P; Luchko TL,R; Madej B; Merz KM; Monard G; Needham P; Nguyen H; Nguyen HT; Omelyan I; Onufriev A; Roe DR; Roitberg A; Salomon-Ferrer R; Simmerling CL; Smith W; Swails J; Walker RC; Wang J; Wolf RM; Wu X; York DM; Kollman PA, AMBER. University of California, San Francisco: 2015. [Google Scholar]
- 30.Essmann U; Perera L; Berkowitz ML; Darden T; Lee H; Pedersen LG, A Smooth particle mesh Ewald method. J. Chem. Phys. 1995, 103 (19), 8577–8593. [Google Scholar]
- 31.Salomon-Ferrer R; Goetz AW; Poole D; Le Grand S; Walker RC, Routine microsecond molecular dynamics simulations with AMBER on GPUs. 2. Explicit solvent particle mesh Ewald. J. Chem. Theory Comput. 2013, 9 (9), 3878–3888. [DOI] [PubMed] [Google Scholar]
- 32.Ryckaert JP; Ciccotti G; Berendsen HJC, Numerical-interaction of cartesian equations of motion of a system with constraints - molecular-dynamics of N-alkanes. J. Comput. Phys. 1977, 23 (3), 327–341. [Google Scholar]
- 33.Roe DR; Cheatham TE, PTRAJ and CPPTRAJ: Software for processing and analysis of molecular dynamics trajectory data. J. Chem. Theory Comput. 2013, 9 (7), 3084–3095. [DOI] [PubMed] [Google Scholar]
- 34.Humphrey W; Dalke A; Schulten K, VMD: Visual molecular dynamics. J. Mol. Graph. Model. 1996, 14 (1), 33–38. [DOI] [PubMed] [Google Scholar]
- 35.Honda S; Yamasaki K; Sawada Y; Morii H, 10 residue folded peptide designed by segment statistics. Structure 2004, 12 (8), 1507–1518. [DOI] [PubMed] [Google Scholar]


