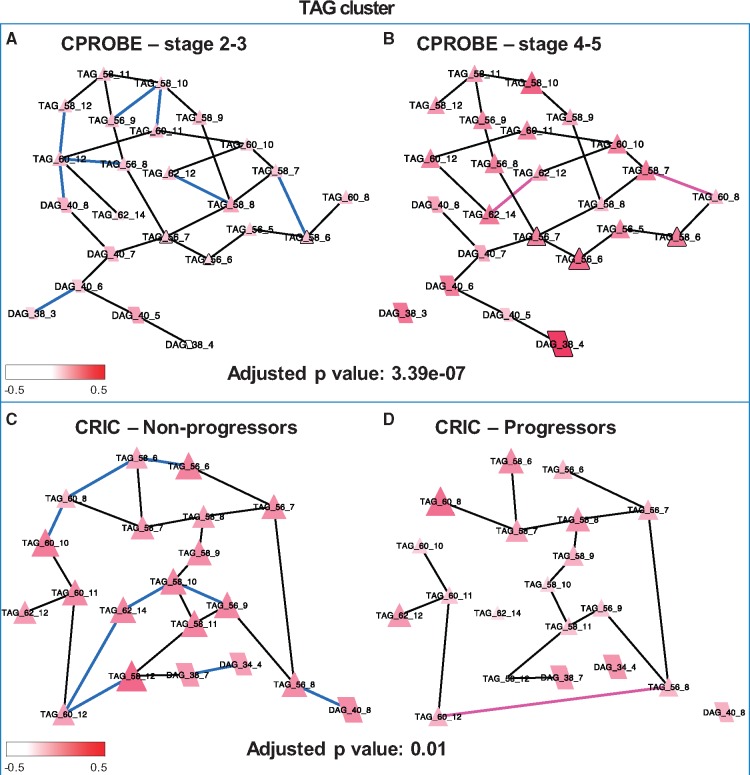
Fig. 5.
TAG cluster lipid pathways altered in CKD progression. (A) Stages 2 and 3 in CPROBE. (B) Stages 4 and 5 in CPROBE. (C) Non-progressor in CRIC. (D) Progressor in CRIC. Blue edges are more likely to be present in early-stage disease (CPROBE) and in non-progressors (CRIC). Pink edges are more likely to be present in late-stage CKD (CPROBE) and in progressors (CRIC). Black edges are equally likely to be present in both conditions. CPROBE, Clinical Phenotyping Resource and Biobank Core; CRIC, Chronic Renal Insufficiency Cohort; DAG, diacylglycerol; TAG, triacylglycerol

