Abstract
Due to the loss of DNA repair mechanisms in colorectal cancer (CRC) with microsatellite instability (MSI), somatic mutations accumulate within DNA; making them more prone to attack by tumor infiltrating lymphocytes (TIL) and macrophages. We hypothesize that MSI-High (MSI-H) patients have favorable survival due to increased tumor immunogenicity. The Cancer Genome Atlas (TCGA) was used to evaluate gene expression from 283 patients with CRC, comparing MSI-H and microsatellite stable (MSS) patients. CIBERSORT algorithm estimated the fraction of immune cell types. We found that low expression of DNA repair genes (MLH1, MLH3, PMS1, PMS2, ATR, PRKDC, ATM, BRCA2) associated with MSI-H. MSI-H was directly associated with Helper T-cells (p = 0.034) and M1 macrophages (p < 0.0001). MSI-H tumors associated with diminished intra-tumoral heterogeneity as well as higher expression of checkpoint molecules PD-1, PD-L1, CTLA4, LAG3 and TIM3 (p < 0.0001). Improved OS was seen in patients with low ATM, PMS2 and MLH3. In the TCGA CRC cohort, decreased expression of DNA repair genes associated with MSI-H. MSI-H patients had improved survival, likely due to higher TIL and M1 macrophage infiltration as well as lower intra-tumoral heterogeneity. MSI-H also associates with expression of immune checkpoint molecules with potential for development of therapeutic targets.
Subject terms: Cancer microenvironment, Surgical oncology
Introduction
Colorectal cancer (CRC) is the third most commonly occurring cancer and the fourth most common cause of cancer death worldwide1–4. A common hallmark in the development of CRC as in other cancers is defective DNA repair. Previous studies have linked up-regulation of DNA repair genes to poor prognostic factors such as resistance to chemotherapy and radiation as well as metastatic ability in tumors5. The DNA mismatch repair (MMR) pathway is important for correcting incorrect nucleotide insertions, deletions and substitutions5.
Microsatellite instability (MSI) occurs sporadically via inactivation of MMR genes by hypermethylation of their promoter regions resulting in impaired DNA repair function and accumulation of abnormal genes or via germ-line mutations in MMR genes (Lynch syndrome)6,7. Approximately 15% of CRC’s are deficient in MMR genes which include MLH1, PMS1, PMS2, MSH2, MSH6, MLH3 and MSH38. MSI-High (MSI-H) patients have been associated with improved survival compared to microsatellite stable (MSS) in patients with localized CRC5,6. In addition, immunotherapeutic agents have demonstrated improved disease control and progression free survival in patients with advanced or metastatic MSI-H CRC9,10.
This improved survival in MSI-H CRCs is hypothesized to be due to accumulation of somatic mutations within these tumors, resulting in subsequent immune cell infiltration into tumors11,12. Indeed, one of the clinicopathological criteria of MSI is high lymphocyte infiltration. This increased immunogenicity has also been predictive of diminished lymph node involvement, decreased incidence of distant metastases and increased chemo-responsiveness13,14.
In this study we aimed to identify whether low expression of DNA repair genes associated with MSI-H and with improved survival due to genomic instability, intra-tumoral immune cell infiltration and immunologic responsiveness. We also aimed to investigate whether improvement in survival correlated with diminished intra-tumoral heterogeneity.
Methods
Gene Expression Analysis
A cohort of 283 patients with colorectal cancer was obtained from The Cancer Genome Atlas (TCGA)15–20. Data obtained from these patients was deemed exempt from the Institutional Review Board at Roswell Park Comprehensive Cancer Center since the patient data is de-identified and publicly available. RNA sequence gene expression quantification data for colon cancer was retrieved from the Genomics Data Commons (GDC) data portal. Gene expression levels were derived using normalization methods provided in the DESeq. 2 package and designated as low or high. The expression of DNA repair genes was then compared between MSI and Microsatellite stable (MSS) cohorts. These DNA repair genes included ATM, PRKDC, BRCA1, BRCA2, ATR, LIG1, POLE, SLX4 as well as MMR genes MSH6, MLH1, PMS1, PMS2 and MLH3 as these are the most frequently mutated DNA repair genes in colorectal cancer as well as all MMR genes as determined by Chae, Y.K., et al.5. In initial analysis, higher expression of MSH2, in contrast to all other MMR genes was associated with MSI-H and was thus excluded from further analyses.
MSI Determination
Hause et al. examined 5,930 cancer exomes from 18 cancer types in TCGA data and designed a microsatellite instability classifier (MOSAIC) for MSI using instability calls. The classifier was then used to distinguish MSI-high (MSI-H) from MSI-stable (MSS) samples for TCGA data independently of cancer types21. Predicted MSI calls and intermediate results were obtained from Hause et al. for subsequent analysis; http://krishna.gs.washington.edu/content/members/hauser/mosaic/.
Cytolytic Activity Score (CYT)
The immune cytolytic activity score (CYT) was defined as the geometric mean of Granzyme A (GZMA) and Perforin 1 (PRF1) expression values in Transcripts Per Million (TPM)22–24.
Mutant-Allele Tumor Heterogeneity (MATH) score
Mutant-allele tumor heterogeneity (MATH) score, a measure of intra-tumor heterogeneity, was calculated through R/Bioconductor package “maftools”; efficient analysis, visualization and summarization of (MAF) files from large-scale cohort-based cancer studies (https://www.biorxiv.org/content/early/2016/05/11/052662)25–27. This technique was developed by Mroz et al. and uses whole exome sequencing of tumors with matched normal DNA to determine the fraction of sequenced DNA which shows the mutant allele or mutant-allele fraction (MAF)26.
Determination of Tumor infiltrating Immune Cells
In order to differentiate the numerous cell types that compose the immune response we utilized the CIBERSORT deconvolution algorithm which uses a set of reference gene expression values as a representation of each cell type and identifies cell type proportions in data sets of colorectal tumor gene expression data obtained from TCGA (further described by Ali, H.R. et al.)28. Twenty-two cell types were investigated in this research using CIBERSORT its online calculator (https://cibersort.stanford.edu/).
Gene Set Enrichment Analysis with TCGA
Gene Set Enrichment Analysis (GSEA) was performed using software provided by the Broad Institute (http://software.broadinstitute.org/gsea/index.jsp)29. All reported tests were conducted at a nominal significance level of 0.05. Statistical analyses were performed using R software (http://www.r-project.org/) and Bioconductor (http://bioconductor.org/).
Statistical analysis
Patients were dichotomized to into low and high groups based on different expression levels of genes in interest. To determine the threshold of the dichotomization, running Cox proportional hazard statistics were applied. Differences in the overall survival (OS) or disease free survival (DFS) between the two groups were assessed at multiple candidate cutoffs within the range of gene expression level, and the optimal cut off point was chosen based on the statistical significance of the Cox proportional hazards model. To compare the survival curves of individual groups, the Kaplan-Meier method with log-rank test and Cox proportional hazard regression were used when appropriate. The reported results included hazard ratios (HR) and 95% confidence intervals (CI). Association between variables including MSI status, gene expression, cell composition and other clinical characteristics were accessed using Mann–Whitney U test.
All reported tests were conducted at a nominal significance level of 0.05. Statistical analyses were performed using R software (http://www.r-project.org/) and Bioconductor (http://bioconductor.org/).
Results
Patient demographics
Gene expression data was obtained from a cohort of 283 patients. Of these, 127 patients were female and 156 male with a mean age of 65. Within this cohort, 255 patients had data on MSI status; 204 patients were MSS and 51 patients were MSI-H. Staging data was available for 274 patients, with the majority being stage II (40.1%) and stage III (29.2%). 41.3% patients were node positive and 14% patients had known metastatic disease in the entire cohort. 54.4% of patients had tumors located within the right colon, 36.6% with left colon cancer and 9% had transverse colon adenocarcinoma. The MSI-H group had more Stage I (24% vs. 15%) and Stage II (56% vs. 35%) patients than the MSS group, which had more Stage III and IV patients (Table 1). More tumors within the right colon were MSI-H than MSS (75% vs. 48%).
Table 1.
Clinical Variables of MSI-H compared to MSS patients.
| Clinical Variables | MSI-H (%) | MSS (%) |
|---|---|---|
| Gender (F/M) | 47/53 | 46/54 |
| Age Mean (range) | 69 (34–90) | 65 (31–90) |
| Stage (I/II/III/IV) | 24/56/16/4 | 15/35/33/17 |
| T stage (T1/T2/T3/T4) | 4/20/66/10 | 2/15/68/15 |
| N stage (N0/N1/N2) | 76/4/20 | 53/28/19 |
| M stage (M0/M1/MX) | 80/14/6 | 66/16/18 |
| Primary location (Left/right/transverse) | 10/75/15 | 43/48/9 |
DNA repair gene expression was significantly lower in MSI-high tumors
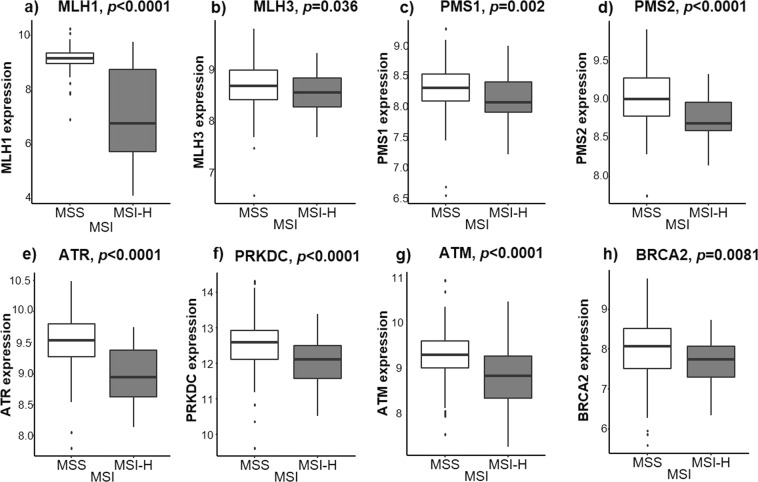
We initially sought to determine whether MSI-high tumors have lower expression of DNA repair genes, which is the current dogma. As expected, expression (as noted by relative values) of eight DNA repair genes was significantly lower in MSI-high tumors. Some of these were the expected mismatch repair (MMR) genes- MLH1 (6.74 vs. 9.15, p < 0.0001), MLH3 (8.55 vs. 8.68, p = 0.036), PMS1 (8.06 vs. 8.30, p = 0.002) and PMS2 (8.67 vs. 8.99, p < 0.0001). Others included non-MMR double stranded break DNA repair genes such as ATR (8.94 vs. 9.53, p < 0.0001), PRKDC (12.11 vs. 12.59, p < 0.0001), ATM (8.81 vs. 9.28, p < 0.0001) and BRCA2 (7.74 vs. 8.07, p = 0.0081), (Fig. 1a–h). Although they did achieve statistical significance, the difference in expression of MLH3, PMS1 and BRCA2 were not as dramatic as we expected from previous reports which may reflect the difference in methodology of using RNA sequencing data from TCGA.
Figure 1.
DNA repair gene expression in MSI-H compared to MSS patients: (a) MLH1, (b) MLH3, (c) PMS1, (d) PMS2, (e) ATR, (f) PRKDC, (g) ATM and (h) BRCA2.
MSI-H tumors are associated with higher tumor mutation load and Cytolytic Activity Score (CYT) but lower Mutant-Allele Tumor Heterogeneity (MATH)
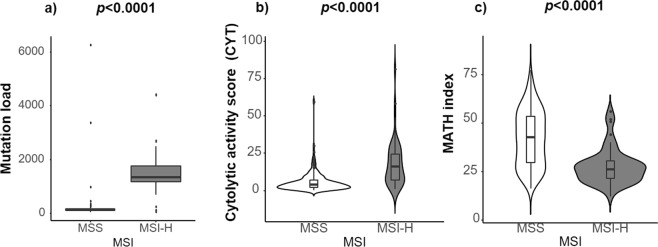
Next, we examined the mutation load, which we expected to be high in MSI-H tumors. As expected, MSI-H tumors had significantly higher mutation load than MSS tumors in this CRC cohort (p < 0.0001, Fig. 2a). These patients (MSI-H) also had higher cytolytic activity (as denoted by CYT) than those with MSS tumors, as shown by the jitter plot (Fig. 2b). Thus, indicating high cell killing activity intra-tumorally, most likely due to immune cell infiltration. We also measured intra-tumoral genetic heterogeneity by determining the MATH score for MSI-H compared to MSS patients. MSI-H tumors demonstrated significantly lower MATH than MSS (p < 0.0001, Fig. 2c).
Figure 2.
(a) Box plot comparing mutation load in MSI-H vs. MSS patients, (b) Jitter plot demonstrating Cytolytic activity score (CYT) in MSI-H vs. MSS and (c) Jitter plot demonstrating Mutant-Allele Tumor Heterogeneity (MATH) levels comparing MSI-H and MSS.
MSI-H tumors possess higher composition of tumor infiltrating immune cells
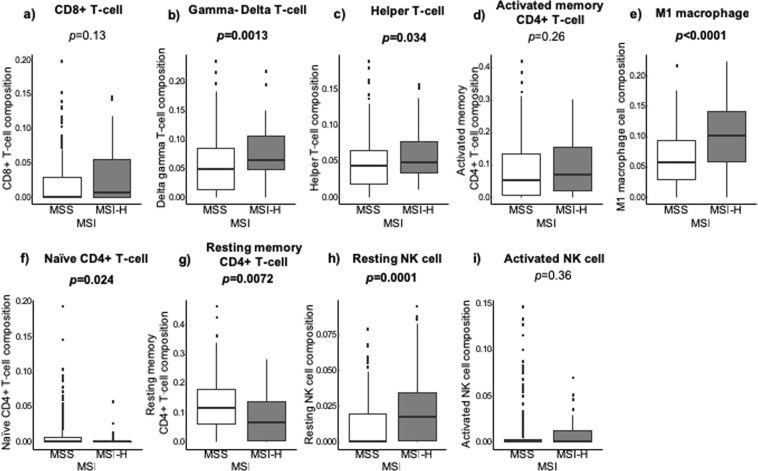
Given the high cytolytic activity score in MSI-H tumors, it was of interest to examine which immune cells are infiltrated in MSI-H patients compared to MSS utilizing the CIBERSORT algorithm (Fig. 3). T-cell expression was significantly higher in the MSI-H group compared to MSS in Gamma-Delta T-cell (p = 0.0013) and Helper T-cell groups (p = 0.034). This trend was also identified (without achieving statistical significance) in the CD8+ T-cell (p = 0.13) and Activated Memory CD4+ T-cell (p = 0.26) groups. MSS was associated with higher expression of Naïve CD4+ T-cells (p = 0.024) and Resting memory CD4+ T-cells (p = 0.0072). There was no difference between the two groups when measuring T regulatory (T-reg) cells (p = 0.96). MSI-H patients also had a greater fraction of M1 type macrophages than MSS (p < 0.0001) as well as more resting NK cells (p = 0.0001). There, however, was no difference between MSI-H and MSS groups when measuring for activated NK cells (p = 0.36).
Figure 3.
MSI-H vs. MSS in (a) CD8+ T-cell, (b) Gamma-Delta T-cell, (c) Helper T-cell, (d) Activated memory CD4+ T-cell, (e) M1 macrophage, (f) Naïve CD4+ T-cell, (g) Resting memory CD4+ T-cell, (h) Resting NK cell and (i) Activated NK cell.
MSI-H associates with high expression of immune-response related genes and immune checkpoint molecules (ICM)
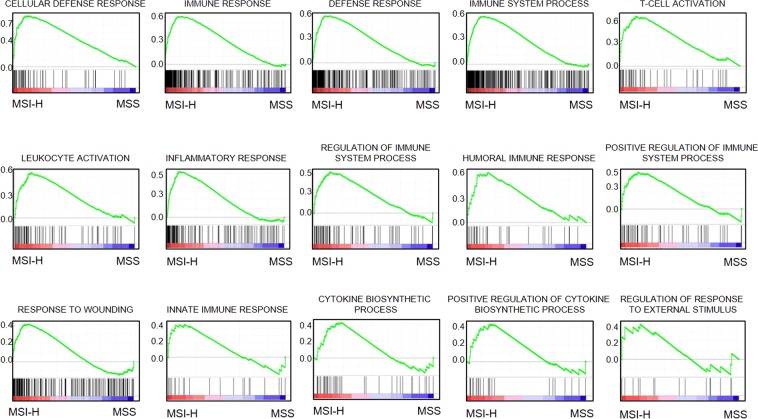
Gene Sets Enrichment Analysis (GSEA) was conducted to validate the association between CYT and immune-response signatures in MSI-H and MSS tumors (Supplementary Table 1). GSEA using TCGA dataset identified 15 available immune-response related gene sets, which were significantly upregulated in the MSI-H CRC tumors; suggesting that MSI-H positively associated with intra-tumoral immune response in MSI-H tumors (Fig. 4).
Figure 4.
Gene Sets Enrichment Analysis (GSEA) inclusion of 15 available immune-response related gene sets which were significantly upregulated in the MSI-H CRC tumors and diminished in MSS.
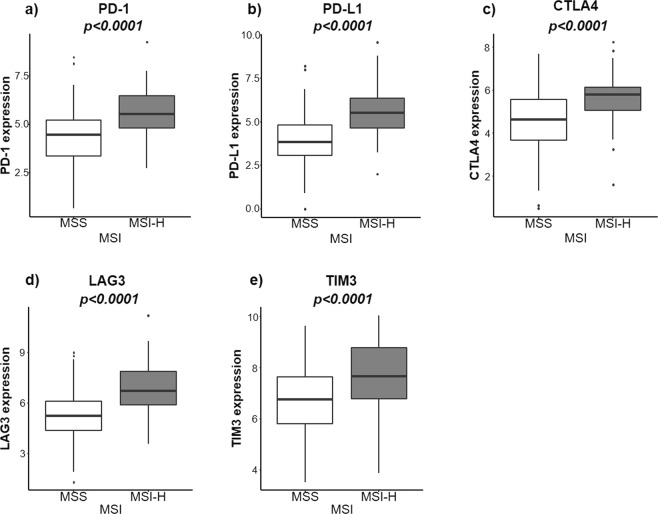
MSI-H and MSS tumors were then compared for expression of immune checkpoint molecules (ICM) including PD-1, PD-L1, CTLA4, LAG3 and TIM3 (Fig. 5). The expression (relative values) of all of these molecules was higher in in the MSI-H group than MSS: PD-1 (5.53 vs. 4.44, p < 0.0001), PD-L1 (5.52 vs. 3.83, p < 0.0001), CTLA4 (5.80 vs. 4.62, p < 0.0001), LAG3 (6.71 vs. 5.24, p < 0.0001) and TIM3 (7.66 vs. 6.76, p < 0.0001).
Figure 5.
MSI-H vs. MSS and their association with immune checkpoint molecules: (a) PD-1, (b) PD-L1, (c) CTLA4, (d) LAG3 and (e) TIM3.
Impact of MSI-H and DNA repair gene expression on survival
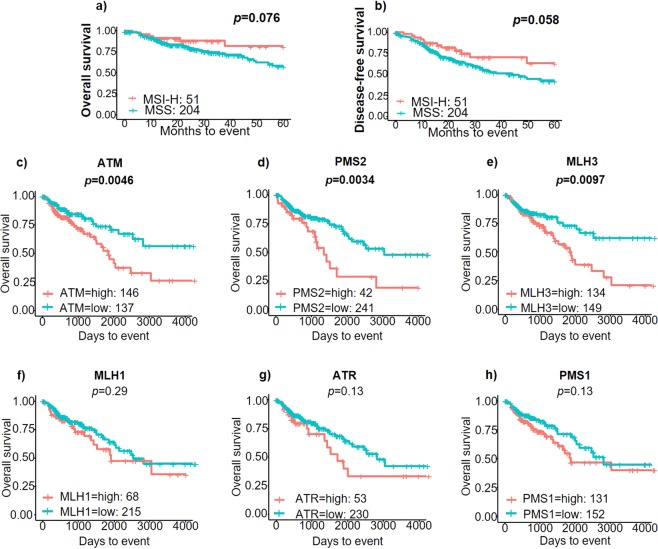
We then studied whether MSI status, or DNA repair gene expression associated with patient survival. MSI-H patients trended towards having higher 5-year OS (79.4% vs. 59.5%, p = 0.076) and DFS (59.7% vs. 43.6%, p = 0.058) than the MSS cohort without achieving statistical significance (Fig. 6a,b). In further survival analysis, broken down by stage we did note that MSI-H patients had trended towards improved 5-year OS than MSS in all stages. This was most markedly pronounced in stage II (92% vs. 72.6%, p = 0.5) and stage III (66.7% vs. 47.6%, p = 0.24). There were also trends towards improved DFS in MSI-H compared to MSS in stage I (83.3% vs. 62.3%, p = 0.77), stage III (60% vs. 38.9%, p = 0.26) and stage IV (50% vs. 10.1%, p = 0.9). These did not achieve statistical significance likely secondary to smaller patient numbers. We also found significantly improved 5-year OS in patients with low expression of certain DNA repair genes compared to high expression of these genes, which included ATM (74.4% vs. 51.9%, p = 0.004), PMS2 (72.6% vs. 28.8%, p = 0.003) and MLH3 (73.7% vs. 52.3%, p = 0.0097), (Fig. 6c,e). There was also a trend towards improved 5-year survival in patients with low expression of MLH1 (66.3% vs. 57.1%, p = 0.29), ATR (68.3% vs. 46.7%, p = 0.13) and PMS1 (71.3% vs. 54.6%, p = 0.13), (Fig. 6f–h).
Figure 6.
Survival analysis of MSI-H vs. MSS in CRC patients: (a) Kaplan-Meier (KM) Curve of Overall Survival (OS) with MSI-H vs. MSS, (b) KM Curve of Disease-Free Survival (DFS) with MSI-H vs. MSS, KM Curves of Overall Survival (OS) comparing high vs. low expression of DNA repair genes: (c) ATM, (d) PMS2, (e) MLH3, (f) MLH1, (g) ATR and (h) PMS1.
Impact of MSI and immune checkpoint molecule expression on survival
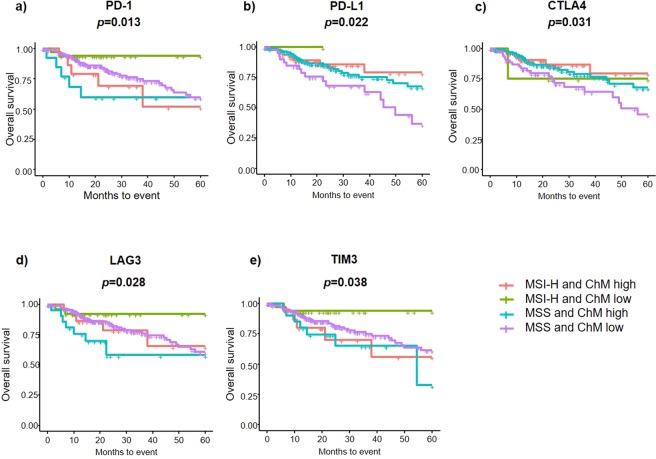
We then investigated the survival of patients in MSI-H and MSS groups, measuring for concurrent expression of ICMs which are known to function as “brakes” of immune response. We found that MSI-H patients with low ICM expression had significantly improved 5-year OS compared to MSS patients with high ICM expression (Fig. 7). This association was identified in ICMs: PD1 (93.9% vs. 59.8%, p = 0.022), CTLA4 (75% vs. 67.6%, p = 0.031), LAG3 (92.3% vs. 58.1%, p = 0.028) and TIM3 (93.9% vs. 32.5%, p = 0.038).
Figure 7.
Survival analysis of MSI-H vs. MSS in CRC patients stratified by their association with immune checkpoint molecules: (a) PD-1, (b) PD-L1, (c) CTLA4, (d) LAG3 and (e) TIM3. High, high expression of each gene; low, low expression of each gene.
Discussion
In this study, we used a novel completely bioinformatic approach using unbiased RNA-sequencing data from the TCGA CRC data set to perform in-depth analyses of the tumor immune microenvironment of MSI-H vs. MSS patients and to confirm findings of increased intra-tumoral immunogenicity in MSI-H patients associating with improvement in clinical outcomes. We, using this unique methodology, were able to reach concordant results with studies which utilized conventional methods of evaluating tumor immunology such as immunohistochemistry or flow cytometry but with diminished costs, lower time and labor expenditure and with higher reproducibility.
Secondary to the diminished DNA repair mechanisms in MSI-H CRC, somatic mutations accumulate within coding and non-coding regions in DNA4. As the reading frames of oncogenes or tumor suppressors are altered, tumors are generated4. This impaired DNA repair and genomic instability can lead to increased neoantigen load on the surface of tumor cells which make them more prone to attack by lymphocytes and other immune cells than MSS tumors30. In our evaluation of TCGA CRC cohort, we found that MSI-H patients trended towards having improved OS and DFS compared with the MSS cohort, a finding which is consistent with previously published data31–33. This trend appeared to be most pronounced in examining OS in stage II and stage III patients and less so in stage IV (likely due to low patient numbers in this group). We also found that MSI-H patients had a higher mutation load as well as high CYT compared to MSS, likely secondary to prominent lymphocytic infiltrate resulting in elevation in intra-tumoral immune cytolytic activity similar to what has been observed previously in different settings12,22,30,34.
In gene expression analysis from TCGA we identified several DNA repair genes and determined that low expression of MMR deficient genes including MLH1, MLH3, PMS1 and PMS2 as well as other double stranded break DNA repair genes including ATR, PRKDC, ATM and BRCA2 was associated with MSI-H. We also found improved 5-year survival in patients with lower expression of several of these genes including ATM, PMS2, MLH3, PMS1, MLH1 and ATR in comparison to survival in patients with MSI-H tumors which did not achieve statistical significance, likely due to fewer numbers of patients and a too short follow up. The fact that expression of DNA repair genes reached statistical significance may indicate that they may be stronger prognostic biomarkers.
For MSI-H CRC as well as other immunogenic cancers, a high level of T lymphocyte infiltration into tumors has been noted to be a positive prognostic factor11. MSI-H tumors are infiltrated with intra-epithelial cytotoxic T-cells and activated CD4+ helper T-cells, making them increasingly prone to a local cytotoxic immune response35. We noted this same association in the patients of this study with MSI-H tumors being significantly associated with infiltration by helper T-cells as well as trending towards increased infiltration by cytotoxic (especially Gamma-Delta) and activated memory CD4+ T-cells. There was, in our study, no difference between MSI-H and MSS groups in the expression of T-reg lymphocytes. Other studies have noted that increased expression of T-reg cells compared to CD4+ and CD8+ lymphocytes can indicate a poorer outcome likely due to suppression of cytotoxic T-cells35,36.
We also found in this study that MSI-H patients had a higher ratio of intra-tumoral M1 macrophages than the MSS group. M1 macrophages have been demonstrated previously to be associated with the inflammatory response via release of pro-inflammatory cytokines as well as pathogen clearance and anti-tumor immunity37. M1 macrophages have also been shown in previous studies to have tumor suppressive effects via production of reactive oxygen species which we hypothesize also may have contributed to the trend in improved survival in MSI-H patients38.
MSI-H tumors were also found to have elevated tumor mutation burden but diminished intra-tumoral heterogeneity as defined by MATH than MSS. This may have contributed to improvement in survival in MSI-H patients26. There has been increasing interest in increasing genetic diversity within tumors resulting in clonal evolution as a response to anti-tumor immunosurveillance39–41. We may speculate that MSI-H patients have low tumor heterogeneity due to increased clonal selective pressures from robust immunologic responses within these tumors.
Immune checkpoints are an immune inhibitory mechanism by which cancer cells evade anti-tumor immunity42,43. Some immune checkpoint molecules have been identified as potential targets for immunotherapy. These include PD-1 (programmed cell death molecule), PD-L1 (PD1 ligand), CTLA-4 (cytotoxic T-lymphocyte associated protein 4), LAG-3 (lymphocyte activation gene) and TIM3, an inhibitory molecule selectively expressed on IFN-γ-producing helper and cytotoxic T-cell responses44–47. This study found that expression all of these molecules (PD-1, PD-L1, CTLA4, LAG3 and TIM3) was higher in in the MSI-H group than MSS which may be a result of the immune activation driven by effector T-cells in patients with MSI-H tumors.
PD-1/PD-L1 binding has been demonstrated to block the effector function and motility of most lymphocytes, thereby decreasing the production of IL-2 (interleukin-2) by helper T-cells and diminishing the clonal proliferation of cytotoxic T-cells in response to cancer cells44. This impaired immune function is termed “T-cell exhaustion” and allows cancer cells to escape immune surveillance11,44. Studies have also noted that high PD-1 and PD-L1 expression on tumor cells has been associated with a weakened host immune response and subsequent poor prognosis in a number of malignancies42,45,48. Up-regulation of PD-L1 has been reported in several malignancies including CRC, melanoma, lung cancer, renal cell carcinoma, ovarian cancer, breast cancer and osteosarcoma48. It has been associated with more frequent incidence of vascular invasion, tumor recurrence and lower numbers of cytotoxic T-cells48. We identified a similar trend within this study, finding that MSS patients with elevated ICM expression had significantly poorer survival than MSI-H patients with lower ICM expression.
Recently, treatment with immune checkpoint inhibitors such as anti-PD1 antibodies (e.g. Nivolumab and Pembrolizumab) and its ligand anti-PD-L1 (e.g. Atezolizumab) have been increasingly used as an effective treatment strategy to combat various advanced cancers11,49. Le et al. in their phase II trial examining anti-PD-1 blockade found a significantly improved objective response rate and survival in MSI-H CRC compared to MSS with associated TIL elevation49. This is likely a result of MSI-H CRCs association with increased neoantigen (immunogenic tumor mutated peptide) expression, concurrent with PD-1 inhibition; resulting in elevated TIL expression and tumor regression35,45. Targeting MSS tumors in advanced CRC may present a more difficult challenge with decreased responsiveness to immunotherapy and would thus be more likely to be treated with standard chemotherapy regimens or via methodologies being developed to increase intra-tumoral immunogenicity (such as PARP inhibitors or vaccines) in combination with immunotherapeutic agents50–52.
Some limitations of TCGA data included limited clinical information regarding patients’ co-morbid conditions and therapeutic information. We were also only able to make associations between these analyses of RNA sequencing data and clinical outcomes from TCGA without being able to elucidate underlying molecular mechanisms or make direct correlations. Also, the majority of patients had locoregional disease which likely contributed to the improved survival of these patients. Additionally, the TCGA was created prior to the wide use of immune checkpoint inhibition, thus our data reflects patients who did not receive those treatments.
Conclusions
This study used a unique bioinformatic approach to analyze RNA sequencing data, obtained from The Cancer Genome Atlas to identify disparities within the tumor immune microenvironments of MSI-H and MSS colorectal cancer patients. Using this approach, we were able to find an association between low expression of non-mismatch DNA repair genes as well as known MMR genes with high microsatellite instability. We found that MSI-H was associated with high TIL and M1 macrophage infiltration into the tumor immune microenvironment as well as with higher cytolytic activity and diminished heterogeneity (with likely increased clonality) which may have contributed to the improvement in survival. We also found an association between MSI-H and 15 different immune response gene signatures as well as immune checkpoint molecules which can be used to further development of targeted therapies (not only in ICMs which already have immunotherapies such as PD-1, PD-L1 and CTLA4, but also in future therapies targeting LAG3 and TIM3 which are currently targeted by no immunotherapeutic agents). The primary novelty of our study is that it allowed us to utilize a completely bioinformatic approach to perform an in-depth analysis of the tumor immune microenvironment using RNA sequencing data with low associated costs, increased feasibility and increased reproducibility than conventional methods of studying tumor immunology.
Supplementary information
Acknowledgements
Kazuaki Takabe is supported by NIH/NCI grant R01CA160688 and Susan G. Komen Investigator Initiated Research Grant IIR12222224. This work was also supported by National Cancer Institute (NCI) grant P30CA016056 involving the use of Roswell Park Cancer Institute’s Bioinformatics and Biostatistics Shared Resources. Li Yan is partially supported by NIH/NCI grant U24CA232979.
Author Contributions
Drs S. Narayanan, T. Kawaguchi, L. Yan, and K. Takabe had full access to all the data in the study and take responsibility for the integrity of the data and the accuracy of the data analysis. Study concept and design: S.N., T.K., and K.T. Acquisition, analysis, or interpretation of data: S.N., T.K., L.Y., Q.Q., and X.P. Drafting of the manuscript: S.N., T.K., L.Y., Q.Q., X.P. and K.T. Critical revision of the manuscript for important intellectual content: T.K., F.I., and K.T. Statistical analysis: T.K., L. Yan, Q.Q., and X.P. Obtained funding: K.T. and S.L. Administrative, technical, or material support: L.Y., Q.Q., X.P., and S.L. Study supervision: T.K. and K.T.
Data Availability
There are no restrictions on the availability of materials or data for this project. Data was obtained from the publicly available The Cancer Genome Atlas.
Competing Interests
The authors declare no competing interests.
Footnotes
Publisher’s note Springer Nature remains neutral with regard to jurisdictional claims in published maps and institutional affiliations.
Sumana Narayanan and Tsutomu Kawaguchi contributed equally.
Supplementary information
Supplementary information accompanies this paper at 10.1038/s41598-019-49878-4.
References
- 1.Benedix F, et al. Comparison of 17,641 patients with right- and left-sided colon cancer: differences in epidemiology, perioperative course, histology, and survival. Dis Colon Rectum. 2010;53:57–64. doi: 10.1007/DCR.0b013e3181c703a4. [DOI] [PubMed] [Google Scholar]
- 2.Weiss JM, et al. Mortality by stage for right- versus left-sided colon cancer: analysis of surveillance, epidemiology, and end results–Medicare data. J Clin Oncol. 2011;29:4401–4409. doi: 10.1200/JCO.2011.36.4414. [DOI] [PMC free article] [PubMed] [Google Scholar]
- 3.Li P, et al. A relationship to survival is seen by combining the factors of mismatch repair status, tumor location and age of onset in colorectal cancer patients. PLoS One. 2017;12:e0172799. doi: 10.1371/journal.pone.0172799. [DOI] [PMC free article] [PubMed] [Google Scholar]
- 4.Marmol, I., Sanchez-de-Diego, C., Pradilla Dieste, A., Cerrada, E. & Rodriguez Yoldi, M.J. Colorectal Carcinoma: A General Overview and Future Perspectives in Colorectal Cancer. Int J Mol Sci18 (2017). [DOI] [PMC free article] [PubMed]
- 5.Chae YK, et al. Genomic landscape of DNA repair genes in cancer. Oncotarget. 2016;7:23312–23321. doi: 10.18632/oncotarget.8196. [DOI] [PMC free article] [PubMed] [Google Scholar]
- 6.Shen H, et al. Different treatment strategies and molecular features between right-sided and left-sided colon cancers. World J Gastroenterol. 2015;21:6470–6478. doi: 10.3748/wjg.v21.i21.6470. [DOI] [PMC free article] [PubMed] [Google Scholar]
- 7.Vacante M, Borzi AM, Basile F, Biondi A. Biomarkers in colorectal cancer: Current clinical utility and future perspectives. World J Clin Cases. 2018;6:869–881. doi: 10.12998/wjcc.v6.i15.869. [DOI] [PMC free article] [PubMed] [Google Scholar]
- 8.Chen W, Swanson BJ, Frankel WL. Molecular genetics of microsatellite-unstable colorectal cancer for pathologists. Diagn Pathol. 2017;12:24. doi: 10.1186/s13000-017-0613-8. [DOI] [PMC free article] [PubMed] [Google Scholar]
- 9.Aad G, et al. Combined Measurement of the Higgs Boson Mass in pp Collisions at sqrt[s]=7 and 8 TeV with the ATLAS and CMS Experiments. Phys Rev Lett. 2015;114:191803. doi: 10.1103/PhysRevLett.114.191803. [DOI] [PubMed] [Google Scholar]
- 10.Gbolahan O, O’Neil B. Update on systemic therapy for colorectal cancer: biologics take sides. Transl Gastroenterol Hepatol. 2019;4:9. doi: 10.21037/tgh.2019.01.12. [DOI] [PMC free article] [PubMed] [Google Scholar]
- 11.Prall F, Huhns M. The PD-1 expressing immune phenotype of T cell exhaustion is prominent in the ‘immunoreactive’ microenvironment of colorectal carcinoma. Histopathology. 2017;71:366–374. doi: 10.1111/his.13231. [DOI] [PubMed] [Google Scholar]
- 12.Giannakis M, et al. Genomic Correlates of Immune-Cell Infiltrates in Colorectal Carcinoma. Cell Rep. 2016;17:1206. doi: 10.1016/j.celrep.2016.10.009. [DOI] [PMC free article] [PubMed] [Google Scholar]
- 13.Daster S, et al. High frequency of CD8 positive lymphocyte infiltration correlates with lack of lymph node involvement in early rectal cancer. Dis Markers. 2014;2014:792183. doi: 10.1155/2014/792183. [DOI] [PMC free article] [PubMed] [Google Scholar]
- 14.Berntsson J, Nodin B, Eberhard J, Micke P, Jirstrom K. Prognostic impact of tumour-infiltrating B cells and plasma cells in colorectal cancer. Int J Cancer. 2016;139:1129–1139. doi: 10.1002/ijc.30138. [DOI] [PubMed] [Google Scholar]
- 15.Young J, et al. Tamoxifen sensitivity-related microRNA-342 is a useful biomarker for breast cancer survival. Oncotarget. 2017;8:99978–99989. doi: 10.18632/oncotarget.21577. [DOI] [PMC free article] [PubMed] [Google Scholar]
- 16.Ramanathan R, et al. Angiopoietin pathway gene expression associated with poor breast cancer survival. Breast Cancer Res Treat. 2017;162:191–198. doi: 10.1007/s10549-017-4102-2. [DOI] [PMC free article] [PubMed] [Google Scholar]
- 17.Kim SY, et al. Clinical Relevance of microRNA Expressions in Breast Cancer Validated Using the Cancer Genome Atlas (TCGA) Ann Surg Oncol. 2017;24:2943–2949. doi: 10.1245/s10434-017-5984-2. [DOI] [PMC free article] [PubMed] [Google Scholar]
- 18.Kawaguchi T, et al. Overexpression of suppressive microRNAs, miR-30a and miR-200c are associated with improved survival of breast cancer patients. Sci Rep. 2017;7:15945. doi: 10.1038/s41598-017-16112-y. [DOI] [PMC free article] [PubMed] [Google Scholar]
- 19.Terakawa T, et al. High expression of SLCO2B1 is associated with prostate cancer recurrence after radical prostatectomy. Oncotarget. 2018;9:14207–14218. doi: 10.18632/oncotarget.24453. [DOI] [PMC free article] [PubMed] [Google Scholar]
- 20.Moro K, et al. Ceramide species are elevated in human breast cancer and are associated with less aggressiveness. Oncotarget. 2018;9:19874–19890. doi: 10.18632/oncotarget.24903. [DOI] [PMC free article] [PubMed] [Google Scholar]
- 21.Hause RJ, Pritchard CC, Shendure J, Salipante SJ. Classification and characterization of microsatellite instability across 18 cancer types. Nature medicine. 2016;22:1342–1350. doi: 10.1038/nm.4191. [DOI] [PubMed] [Google Scholar]
- 22.Rooney MS, Shukla SA, Wu CJ, Getz G, Hacohen N. Molecular and genetic properties of tumors associated with local immune cytolytic activity. Cell. 2015;160:48–61. doi: 10.1016/j.cell.2014.12.033. [DOI] [PMC free article] [PubMed] [Google Scholar]
- 23.Balli D, Rech AJ, Stanger BZ, Vonderheide RH. Immune Cytolytic Activity Stratifies Molecular Subsets of Human Pancreatic Cancer. Clin Cancer Res. 2017;23:3129–3138. doi: 10.1158/1078-0432.CCR-16-2128. [DOI] [PMC free article] [PubMed] [Google Scholar]
- 24.Narayanan, S. et al. Cytolytic Activity Score to Assess Anticancer Immunity in Colorectal Cancer. Ann Surg Oncol (2018). [DOI] [PMC free article] [PubMed]
- 25.Rocco JW. Mutant allele tumor heterogeneity (MATH) and head and neck squamous cell carcinoma. Head Neck Pathol. 2015;9:1–5. doi: 10.1007/s12105-015-0617-1. [DOI] [PMC free article] [PubMed] [Google Scholar]
- 26.Mroz EA, Rocco JW. MATH, a novel measure of intratumor genetic heterogeneity, is high in poor-outcome classes of head and neck squamous cell carcinoma. Oral Oncol. 2013;49:211–215. doi: 10.1016/j.oraloncology.2012.09.007. [DOI] [PMC free article] [PubMed] [Google Scholar]
- 27.Mroz EA, Tward AD, Hammon RJ, Ren Y, Rocco JW. Intra-tumor genetic heterogeneity and mortality in head and neck cancer: analysis of data from the Cancer Genome Atlas. PLoS Med. 2015;12:e1001786. doi: 10.1371/journal.pmed.1001786. [DOI] [PMC free article] [PubMed] [Google Scholar]
- 28.Ali HR, Chlon L, Pharoah PD, Markowetz F, Caldas C. Patterns of Immune Infiltration in Breast Cancer and Their Clinical Implications: A Gene-Expression-Based Retrospective Study. PLoS Med. 2016;13:e1002194. doi: 10.1371/journal.pmed.1002194. [DOI] [PMC free article] [PubMed] [Google Scholar]
- 29.Subramanian A, et al. Gene set enrichment analysis: a knowledge-based approach for interpreting genome-wide expression profiles. Proceedings of the National Academy of Sciences of the United States of America. 2005;102:15545–15550. doi: 10.1073/pnas.0506580102. [DOI] [PMC free article] [PubMed] [Google Scholar]
- 30.Green AR, et al. Clinical Impact of Tumor DNA Repair Expression and T-cell Infiltration in Breast Cancers. Cancer Immunol Res. 2017;5:292–299. doi: 10.1158/2326-6066.CIR-16-0195. [DOI] [PubMed] [Google Scholar]
- 31.Weiss JM, et al. Adjuvant chemotherapy for stage II right-sided and left-sided colon cancer: analysis of SEER-medicare data. Ann Surg Oncol. 2014;21:1781–1791. doi: 10.1245/s10434-014-3631-8. [DOI] [PMC free article] [PubMed] [Google Scholar]
- 32.Yahagi M, Okabayashi K, Hasegawa H, Tsuruta M, Kitagawa Y. The Worse Prognosis of Right-Sided Compared with Left-Sided Colon Cancers: a Systematic Review and Meta-analysis. J Gastrointest Surg. 2016;20:648–655. doi: 10.1007/s11605-015-3026-6. [DOI] [PubMed] [Google Scholar]
- 33.Ribic CM, et al. Tumor microsatellite-instability status as a predictor of benefit from fluorouracil-based adjuvant chemotherapy for colon cancer. N Engl J Med. 2003;349:247–257. doi: 10.1056/NEJMoa022289. [DOI] [PMC free article] [PubMed] [Google Scholar]
- 34.Park JH, et al. Mismatch repair status in patients with primary operable colorectal cancer: associations with the local and systemic tumour environment. Br J Cancer. 2016;114:562–570. doi: 10.1038/bjc.2016.17. [DOI] [PMC free article] [PubMed] [Google Scholar]
- 35.Bupathi M, Wu C. Biomarkers for immune therapy in colorectal cancer: mismatch-repair deficiency and others. J Gastrointest Oncol. 2016;7:713–720. doi: 10.21037/jgo.2016.07.03. [DOI] [PMC free article] [PubMed] [Google Scholar]
- 36.Katz SC, et al. Regulatory T cell infiltration predicts outcome following resection of colorectal cancer liver metastases. Ann Surg Oncol. 2013;20:946–955. doi: 10.1245/s10434-012-2668-9. [DOI] [PMC free article] [PubMed] [Google Scholar]
- 37.Burmeister K, et al. Vascular endothelial growth factor A amplification in colorectal cancer is associated with reduced M1 and M2 macrophages and diminished PD-1-expressing lymphocytes. PLoS One. 2017;12:e0175563. doi: 10.1371/journal.pone.0175563. [DOI] [PMC free article] [PubMed] [Google Scholar]
- 38.Aras, S. & Zaidi, M. R. TAMeless traitors: macrophages in cancer progression and metastasis. Br J Cancer (2017). [DOI] [PMC free article] [PubMed]
- 39.Greaves M. Evolutionary determinants of cancer. Cancer Discov. 2015;5:806–820. doi: 10.1158/2159-8290.CD-15-0439. [DOI] [PMC free article] [PubMed] [Google Scholar]
- 40.McGranahan N, et al. Clonal neoantigens elicit T cell immunoreactivity and sensitivity to immune checkpoint blockade. Science. 2016;351:1463–1469. doi: 10.1126/science.aaf1490. [DOI] [PMC free article] [PubMed] [Google Scholar]
- 41.Gerlinger M, et al. Intratumor heterogeneity and branched evolution revealed by multiregion sequencing. N Engl J Med. 2012;366:883–892. doi: 10.1056/NEJMoa1113205. [DOI] [PMC free article] [PubMed] [Google Scholar]
- 42.Lee LH, et al. Patterns and prognostic relevance of PD-1 and PD-L1 expression in colorectal carcinoma. Mod Pathol. 2016;29:1433–1442. doi: 10.1038/modpathol.2016.139. [DOI] [PMC free article] [PubMed] [Google Scholar]
- 43.Jomrich G, Silberhumer GR, Marian B, Beer A, Mullauer L. Programmed death-ligand 1 expression in rectal cancer. Eur Surg. 2016;48:352–356. doi: 10.1007/s10353-016-0447-8. [DOI] [PMC free article] [PubMed] [Google Scholar]
- 44.Toh JW, et al. The Potential Value of Immunotherapy in Colorectal Cancers: Review of the Evidence for Programmed Death-1 Inhibitor Therapy. Clin Colorectal Cancer. 2016;15:285–291. doi: 10.1016/j.clcc.2016.07.007. [DOI] [PubMed] [Google Scholar]
- 45.Rosenbaum MW, Bledsoe JR, Morales-Oyarvide V, Huynh TG, Mino-Kenudson M. PD-L1 expression in colorectal cancer is associated with microsatellite instability, BRAF mutation, medullary morphology and cytotoxic tumor-infiltrating lymphocytes. Mod Pathol. 2016;29:1104–1112. doi: 10.1038/modpathol.2016.95. [DOI] [PubMed] [Google Scholar]
- 46.Anderson AC. Tim-3: an emerging target in the cancer immunotherapy landscape. Cancer Immunol Res. 2014;2:393–398. doi: 10.1158/2326-6066.CIR-14-0039. [DOI] [PubMed] [Google Scholar]
- 47.Pennock GK, Chow LQ. The Evolving Role of Immune Checkpoint Inhibitors in Cancer Treatment. Oncologist. 2015;20:812–822. doi: 10.1634/theoncologist.2014-0422. [DOI] [PMC free article] [PubMed] [Google Scholar]
- 48.Saigusa S, et al. Implication of programmed cell death ligand 1 expression in tumor recurrence and prognosis in rectal cancer with neoadjuvant chemoradiotherapy. Int J Clin Oncol. 2016;21:946–952. doi: 10.1007/s10147-016-0962-4. [DOI] [PubMed] [Google Scholar]
- 49.Le DT, et al. PD-1 Blockade in Tumors with Mismatch-Repair Deficiency. N Engl J Med. 2015;372:2509–2520. doi: 10.1056/NEJMoa1500596. [DOI] [PMC free article] [PubMed] [Google Scholar]
- 50.Tejpar, S. et al. Prognostic and Predictive Relevance of Primary Tumor Location in Patients With RAS Wild-Type Metastatic Colorectal Cancer: Retrospective Analyses of the CRYSTAL and FIRE-3 Trials. JAMA Oncol (2016). [DOI] [PMC free article] [PubMed]
- 51.Césaire Mathieu, Thariat Juliette, Candéias Serge M., Stefan Dinu, Saintigny Yannick, Chevalier François. Combining PARP inhibition, radiation, and immunotherapy: A possible strategy to improve the treatment of cancer? International Journal of Molecular Sciences. 2018;19(12):3793. doi: 10.3390/ijms19123793. [DOI] [PMC free article] [PubMed] [Google Scholar]
- 52.Feola S, et al. Oncolytic vaccines increase the response to PD-L1 blockade in immunogenic and poorly immunogenic tumors. Oncoimmunology. 2018;7:e1457596. doi: 10.1080/2162402X.2018.1457596. [DOI] [PMC free article] [PubMed] [Google Scholar]
Associated Data
This section collects any data citations, data availability statements, or supplementary materials included in this article.
Supplementary Materials
Data Availability Statement
There are no restrictions on the availability of materials or data for this project. Data was obtained from the publicly available The Cancer Genome Atlas.


