

Abstract
Shading conditions adversely affect flower-number and pod-number of soybeans under maize-soybean relay-intercropping (MSR). Here we reveal that leaf-removal from maize-canopy improves the photosynthetically active radiation (PAR) transmittance and dry-matter production (DMP) of soybean (especially during the co-growth phase), and compensates the maize seed-yield loss by considerably increasing soybean seed-yield. In a two-year experiment with MSR, maize-plants were subjected to different leaf-removal treatments to increase the PAR-transmittance of soybean; removal of the topmost two-leaves (R2), four-leaves (R4), six-leaves (R6), with no-removal of leaves (R0). Leaf-removal treatments improved the PAR-transmittance, photosynthetic-rate, and morphological-characteristics of soybean under MSR. At 90 days after sowing, the dry-matter of pods, and seeds was increased by 25%, and 32%, respectively under R6 than R0. Importantly, enhanced PAR-transmittance and DMP under R6 enabled soybean to initiate a greater number of flowers 182.2 plant−1 compared to 142.7 plant−1 under R0, and it also decreased the flower-abscission (by 13%, from 54.9% under R0 to 47.6% under R6). These positive responses increased the pod-number by 49% and seed-number by 28% under R6 than R0. Overall, under R6, relay-intercropped soybean produced 78% of sole-soybean seed-yield, and relay-intercropped maize produced 81% of sole-maize seed-yield and achieved the land equivalent ratio of 1.59.
Subject terms: Light responses, Plant development
Introduction
Maize (Zea mays L.) soybean (Glycine max L. Merr.) relay-intercropping (MSR) is a productive and sustainable cropping system1,2. The land equivalent ratio (LER) of MSR is ranged from 1.6 to 1.83, which is higher than that of other relay-intercropping systems in the world2. In relay strip intercropping, two crops are planted in the same field in alternating narrow strips of the two species, whereby the growing periods overlap for a limited period of co-growth4. Intercropping legumes with cereals are the most common type of relay-intercropping in China, amongst which MSR is most prevalent5–8. In MSR, soybean is sown 60 days after maize6. Therefore, the taller maize plants shade the soybean plants during their early growth (Fig. 1). Soybean is a responsive crop to shading conditions9, and under MSR soybean plants suffer from maize shading, especially during their co-growth phase from germination to flowering8,10 which increased the seedling height11 and reduced the initial dry matter production12, stem diameter13 and flower initiation of the soybean14. Moreover, shaded soybean plants become more susceptible to lodging15. The lodging of soybean plants inhibits the translocation of carbohydrates, water, and nutrients, which significantly decreases the soybean seed-yield16,17. Reduced growth and flowering of soybean are the main problems of maize soybean relay-intercropping18. However, the initiation of flowers and pods under different levels of shading in intercropping was never studied before.
Figure 1.
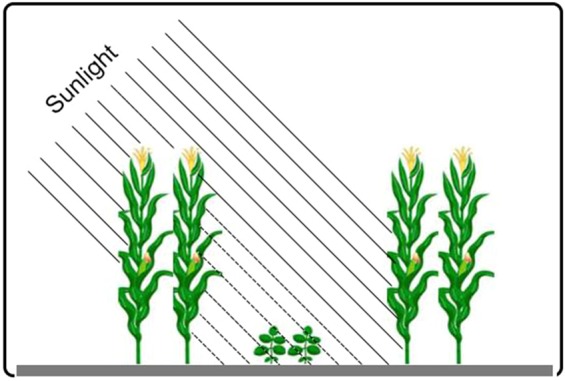
Schematic representation of the maize soybean relay-intercropping system considered in the present experiment.
The primary constituents of soybean seed-yield are flower number (flower/plant) and pod number (pod/plant). Genetic improvement or innovation in agronomic practices could enhance future seed-yields by enhancing flower number, pod number, or both constituents. The pod number is directly related to flower number, which shows high environmental variation19. The availability of carbohydrates is a major factor controlling flower and pod number20,21. Differences in available light for plant growth, dry matter production, and leaf area index have been linked with the variation in final pod number21–25. Shading conditions reduce the plant growth rate, decrease the flower, and pod number in soybean25. Only a small number of flowers mature into pods with seeds. Shading conditions accelerated the flower abscission, which reduced the final pod number and grain yield19. Flower abscission is a major problem of soybean in MSR because it greatly decreases the pod number and grain yield of soybean. It is therefore vital to study how we can decrease the flower abscission in soybean plants during the co-growth phase under MSR.
To study the role of shading in the intercropping system on soybean flowering and pod development, we removed maize leaves to increase the light intensity on soybean plants under MSR. This study was initiated to investigate the effects of improved light environment on dry matter production and partitioning, flower initiation and abscission, and setting of final pod number in soybean under MSR. This critical information of flower initiation and abscission will provide new insights for agronomists to develop the innovative agronomic practices for a higher number of flowers with low abscission rate to prevent the severe yield loss of soybean crop in MSR.
Results
PAR-transmittance
Light (photosynthetically active radiation, PAR) transmittance considerably changed under all treatments at soybean canopy in R0, R2, R4, and R6 compared with those of the treatment sole soybean (SS) (Fig. 2). In both study years, the mean PAR-transmittance of soybean canopy in R0, R2, R4, and R6 was always found less than SS at 30 and 50 days after sowing (DAS). However, the leaf removal significantly improved the light environment and the mean maximum PAR-transmittance 71%, and 77% was recorded under treatment R6, whereas the mean minimum PAR-transmittance 41% and 49%, was observed in R0 at 30 and 50 DAS, respectively. After the harvest of maize, non-significant differences were observed for the light intensity between MSR and SS (data not shown).
Figure 2.

Changes in PAR-transmittance of soybean canopy as affected by leaf removal treatments in 2017 (a) and 2018 (b). 30 and 70 refer to days after sowing of the soybean crop. The R2, R4, R6, and R0 refer to removal of the topmost two-leaves, four-leaves, six-leaves, with no removal of leaves, respectively, from maize canopy in relay intercropping system. Means are averaged over three replicates. Bars show ± standard errors, (n = 3). Within a bar, different lowercase letters show a significant difference (p ≤ 0.05) between treatments.
Morphological parameters
The morphological parameters of soybean plants are presented in Fig. 3. Morphology of soybean plants changed significantly under all treatments (P < 0.05 for all the parameters at 30, 50, 70, and 90 DAS). Compared to R0, treatment R6 increased the mean stem diameter (SD) by 19%, 37%, 29% and 27% (Fig. 3a,b), and the mean stem breaking strength (SBS) was enhanced by 32%, 35%, 49% and 35%, (Fig. 3c,d) at 30, 50, 70 and 90 DAS, respectively. At the same sampling times, plant height was decreased by 36%, 27%, 20% and 20% (Fig. 3e,f) in treatment R6 than in R0, and similarly the lodging rate of soybean plants was declined by 54%, 49%, 77% and 83% in R6 as compared with the corresponding values in R0 (Fig. 3g,h). This increase in PAR-transmittance may improve the physiological indices of soybean in MSR.
Figure 3.

Changes in the stem diameter (a,b), stem breaking strength (c,d), plant height (e,f) and lodging rate (g,h) of soybean plants as affected by leaf removal treatments in 2017 and 2018. 30, 50, 70 and 90 refer to days after sowing of the soybean crop. The R2, R4, R6, and R0 refer to removal of the topmost two-leaves, four-leaves, six-leaves, with no removal of leaves, respectively, from maize canopy in relay intercropping system. Means are averaged over three replicates. Bars show ± standard errors, (n = 3). Within a bar, different lowercase letters show a significant difference (p ≤ 0.05) between treatments.
Leaf area index and photosynthetic characteristics
Different leaf removal treatments significantly (P < 0.05) changed the leaf area index (LAI) of soybean plants from 30 to 90 DAS (Fig. 4). At 90 DAS, relative to SS, the soybean LAI was decreased in R0, R2, R4, and R6 by 34%, 30%, 21%, and 10%, respectively (Fig. 4). Maize leaf removal significantly increased the photosynthesis in soybean (Table 1). It also slightly but significantly increased the transpiration of soybean but lowered the stomatal conductance. The internal CO2 concentration was lower in sole soybean and strongly defoliated soybean than in non-defoliated soybean (Table 1). These responses are consistent with the higher amount of light received by sole soybean plants and soybean plants intercropped with strongly defoliated maize plants (R4 and R6), in comparison to non-defoliated (R0) or lightly defoliated maize plants (R2). The effects were consistent between the two years and similar at the two measurement times (30 and 70 DAS).
Figure 4.

Changes in the leaf area index of the soybean plants as affected by leaf removal treatments in 2017 and 2018. 30, 50, 70 and 90 refer to days after sowing of the soybean crop. The R2, R4, R6, and R0 refer to removal of the topmost two-leaves, four-leaves, six-leaves, with no removal of leaves, respectively, from maize canopy in relay intercropping system. Means are averaged over three replicates. Bars show ± standard errors, (n = 3). Within a bar, different lowercase letters show a significant difference (p ≤ 0.05) between treatments.
Table 1.
Effects leaf removal treatments on photosynthetic characteristics of soybean at 30 (during the co-growth period) and 70 (after the co-growth period) days after sowing (DAS) under sole soybean cropping system (SS) and relay intercropping system in 2017 and 2018.
| Years | Treatments | Photosynthetic Rate (μmol CO2 m−2 s−1) | Stomatal Conductance (mol H2O m−2 s−1) | Intercellular CO2 Concentration (μmol CO2 m−2 s−1) | Transpiration Rate (mmol H2O m−2 s−1) | ||||
|---|---|---|---|---|---|---|---|---|---|
| 30 DAS | 70 DAS | 30 DAS | 70 DAS | 30 DAS | 70 DAS | 30 DAS | 70 DAS | ||
| 2017 | R0 | 13.7e | 17.1b | 0.60a | 0.84a | 351.2a | 413.3a | 2.9d | 3.2e |
| R2 | 14.6d | 18.0b | 0.55ab | 0.78ab | 331.2ab | 381.1ab | 3.0d | 3.6d | |
| R4 | 16.8c | 20.6a | 0.51b | 0.76b | 309.6bc | 370.7bc | 3.2c | 3.9c | |
| R6 | 18.6b | 21.9a | 0.44c | 0.69c | 295.bc | 340.1cd | 3.3b | 4.5b | |
| SS | 19.7a | 22.1a | 0.42c | 0.64c | 272.3c | 331.3d | 3.5a | 5.3a | |
| LSD | 0.74 | 1.56 | 0.05 | 0.05 | 39.92 | 33.08 | 0.15 | 0.14 | |
| 2018 | R0 | 12.8c | 17.7c | 0.55a | 0.72a | 332.7a | 430.1 | 3.8e | 4.6e |
| R2 | 13.6c | 18.6c | 0.51ab | 0.70a | 309.9ab | 403.5ab | 4.2d | 4.9d | |
| R4 | 15.7b | 20.7b | 0.49b | 0.66ab | 287.7bc | 379.7bc | 4.3c | 5.6c | |
| R6 | 17.3b | 22.2a | 0.42c | 0.61bc | 270.3cd | 352.3c | 4.7b | 6.2b | |
| SS | 19.2a | 22.8a | 0.41c | 0.58c | 246.2d | 321.7d | 5.3a | 7.1a | |
| LSD | 1.68 | 1.12 | 0.06 | 0.06 | 35.04 | 30.21 | 0.09 | 0.13 | |
The R2, R4, R6, and R0 refer to removal of the topmost two-leaves, four-leaves, six-leaves, with no removal of leaves, respectively, from maize canopy in relay intercropping system. Means are averaged over three replicates. Means do not share the same letters in the column differ significantly at p ≤ 0.05.
Dry matter accumulation
Maize leaf removal had a significant impact on dry matter accumulation of soybean (Table 2). Soybean plants in sole cropping system obtained higher dry matter than those in R0, R2, R4, and R6 under MSR. Amongst the leaf removal treatments, R6 produced the highest dry matter (60.1 g plant−1 at 90 DAS in 2017 and 68.3 g plant−1 in 2018) of soybean. The soybean total dry matter demonstrated the trend SS > R6 > R4 > R2 > R0, indicating that increased the PAR-transmittance at soybean canopy in relay intercropping system considerably enhanced the soybean dry matter accumulation by reducing the adverse effects of maize shading on soybean growth. Moreover, the different leaf removal treatments significantly (P < 0.05) altered the dry matter distribution among root, stem, leaves, pods, and the seed of soybean (Fig. 5). At 30 and 50 DAS, the maximum proportion of dry matter distribution was noticed in leaves followed by stem and root in R0, R2, R4, R6 and SS (Fig. 5a,b). However, at 70 and 90 DAS, the pattern of dry matter partitioning was changed, and soybean plants invested their dry matter in pod and seed formation. At 90 DAS, relative to R0, the proportion of pods and seeds dry matter increased by 13%, 46%, and 87%, and 14%, 45%, and 72%, respectively in R2, R4, and R6 (Fig. 5c,d).
Table 2.
Effects leaf removal treatments on dry matter production, flower initiated and flower abscission of soybean at 30, 50, 70 and 90 days after sowing (DAS) under sole soybean cropping system (SS) and relay intercropping system in 2017 and 2018.
| Years | Treatments | Dry Matter Production (g plant−1) | Flower Initiated (plant−1) | Flower Abscission (% plant−1) | |||
|---|---|---|---|---|---|---|---|
| 30 DAS | 50 DAS | 70 DAS | 90 DAS | 50–90 DAS | 50–90 DAS | ||
| 2017 | R0 | 3.6e | 17.3e | 25.0e | 38.0e | 133.4d | 54.5a |
| R2 | 4.2d | 18.5d | 29.2d | 44.4d | 146.9cd | 53.2ab | |
| R4 | 4.7c | 20.9c | 34.7c | 51.7c | 165.8bc | 52.3abc | |
| R6 | 5.2b | 22.8b | 38.8b | 60.1b | 179.1b | 48.4bc | |
| SS | 5.9a | 26.8a | 45.3a | 70.1a | 207.3a | 46.7c | |
| LSD | 0.09 | 0.99 | 1.07 | 1.55 | 21.61 | 6.07 | |
| 2018 | R0 | 4.0c | 18.5e | 28.8e | 44.1e | 152.0c | 55.2a |
| R2 | 4.4c | 20.7d | 33.0d | 51.d | 160.3c | 52.6ab | |
| R4 | 5.0b | 22.6c | 37.7c | 58.6c | 176.4b | 51.1ab | |
| R6 | 5.5b | 25.5b | 41.7b | 68.3b | 185.4b | 46.8b | |
| SS | 6.5a | 31.3a | 48.1a | 76.0a | 218.3a | 45.7b | |
| LSD | 0.52 | 1.02 | 1.10 | 2.93 | 14.12 | 7.18 | |
The R2, R4, R6, and R0 refer to removal of the topmost two-leaves, four-leaves, six-leaves, with no removal of leaves, respectively, from maize canopy in relay intercropping system. Means are averaged over three replicates. Means do not share the same letters in the column differ significantly at p ≤ 0.05.
Figure 5.

Dry matter partitioning to root, stem, leaves, pods, and seeds of soybean plants as affected by leaf removal treatments in 2017 and 2018. 30, 50, 70 and 90 refer to days after sowing of the soybean crop. The R2, R4, R6, and R0 refer to removal of the topmost two-leaves, four-leaves, six-leaves, with no removal of leaves, respectively, from maize canopy in relay intercropping system. Means are averaged over three replicates. Bars show ± standard errors, (n = 3). Within a bar, different lowercase letters show a significant difference (p ≤ 0.05) between treatments.
Flower initiation and abscission
In MSR, soybean plants were co-planted with maize plants in the field from germination to flowering. During this period, soybean plants suffered from maize shading, flower initiation and abscission significantly affected as compared to the sole cropping system. Flowering was initiated earlier in intercropping without any defoliation (R0) (51 DAS in 2017 and 54 DAS in 2018) (Table 3) than in sole soybean (56 DAS and 59 DAS in 2017 and 2018, respectively). Likewise, flowering was terminated earlier in intercropping without any defoliation (R0) (94 DAS in 2017 and 96 DAS in 2018) (Table 3) than in sole soybean (99 DAS and 101 DAS in 2017 and 2018, respectively). Defoliation of maize leaves resulted in a later onset and termination of flowering in soybean than in the intercropping without defoliation, demonstrating that shading by maize advances and shortens the flowering period in soybean. In SS, the average number of flowers initiated (49%) and abscised (16%) were significantly higher and lower, respectively as compared to R0 treatment in both years (Table 2). Maize leaf removal significantly increased the number of flowers initiated, and it reduced the flower abscission rate in MSR. Overall, soybean plants in R6 produced a higher number of flowers than R0 (by 34% in 2017 and 22% in 2018) and reduced the flower abscission (by 13% in 2017 and 18% in 2018) (Table 2). Thus, maize leaves defoliation increased flower production in soybean and reduced the flower abscission rate, resulting in a higher number of pods. In addition, we also measured the total number of flowers initiated at each node. The initiated flowers were significantly (P < 0.05) higher at middle nodes (9th to 12th node of the main stem) than at upper and lower nodes (Fig. 6a,b). The initiated flowers per node of relay-intercropped soybean were significantly (P < 0.05) lower than that of sole cropping soybean. Flowers initiation of treatment R6 was significantly (P < 0.05) higher than that of R0 at the 7th–12th node of the main stem (Fig. 6a,b).
Table 3.
Effects leaf removal treatments on total pod number, seed number, 100-seed weight, seed-yield, and land equivalent ratio (LER) of maize and soybean under sole soybean cropping system (SS), sole maize cropping system (SM) and relay intercropping system in 2017 and 2018.
| Years | Treatments | Pod Number | Seed Number | Seed Weight | Seed-Yield (kg ha−1) | LER | Total LER | ||
|---|---|---|---|---|---|---|---|---|---|
| (plant−1) | (plant−1) | (g) | Soybean | Maize | Soybean | Maize | |||
| 2017 | R0 | 60.4e | 79.3d | 17.73NS | 1406.1d | 6834.5b | 0.56c | 0.89b | 1.45b |
| R2 | 68.6d | 85.4cd | 17.72 | 1512.7cd | 8353.2a | 0.60bc | 1.10a | 1.69a | |
| R4 | 78.5c | 92.4c | 17.71 | 1633.2c | 6513.1b | 0.65b | 0.85b | 1.50b | |
| R6 | 92.3b | 103.4b | 17.70 | 1831.3b | 6167.8b | 0.73a | 0.80b | 1.53b | |
| SS | 110.1a | 142.4a | 17.68 | 2523.3a | — | — | — | — | |
| SM | 7713.9a | — | — | — | |||||
| LSD | 5.65 | 7.29 | 0.23 | 138.08 | 819.81 | 0.06 | 0.11 | 0.10 | |
| 2018 | R0 | 67.5e | 94.4d | 17.51NS | 1650.4d | 6634.9c | 0.66c | 0.92b | 1.58c |
| R2 | 75.5d | 100.7cd | 17.49 | 1761.0cd | 7666.1a | 0.70bc | 1.06a | 1.77a | |
| R4 | 86.2c | 107.1c | 17.48 | 1867.5c | 6228.2d | 0.75b | 0.86c | 1.61bc | |
| R6 | 98.8b | 119.5b | 17.46 | 2091.6b | 5904.7e | 0.84a | 0.82d | 1.65b | |
| SS | 118.6a | 142.8a | 17.45 | 2496.5a | — | — | — | — | |
| SM | 7238.3b | — | — | — | |||||
| LSD | 5.81 | 6.90 | 0.53 | 153.66 | 264.64 | 0.05 | 0.05 | 0.06 | |
The R2, R4, R6, and R0 refer to removal of the topmost two-leaves, four-leaves, six-leaves, with no removal of leaves, respectively, from maize canopy in relay intercropping system. Means are averaged over three replicates. Means do not share the same letters in the column differ significantly at p ≤ 0.05.
Figure 6.

Flower number (a,b) and pod number (c,d) of each soybean node as affected by leaf removal treatments in 2017 and 2018. The R2, R4, R6, and R0 refer to removal of the topmost two-leaves, four-leaves, six-leaves, with no removal of leaves, respectively, from maize canopy in relay intercropping system. Means are averaged over three replicates. Bars show ± standard errors, (n = 3). Within a bar, different lowercase letters show a significant difference (p ≤ 0.05) between treatments.
Yield and yield components
In both years, different leaf removal treatments significantly (P < 0.05) affected the soybean seed-yield (Table 3). On average over the two years, relative yield per plant compared to sole soybean was 0.61 in R0, 0.65 in R2, 0.70 in R4 and 0.78 in R6. Among the intercropping treatments, R6 had a maximum average soybean grain yield (1961.5 kg ha−1) while R0 had minimum average soybean grain yield (1528.2 kg ha−1). On average, as compared to R0, treatments R2, R4, and R6 increased the grain yield of soybean by 7%, 15%, and 28% in both years. In addition, relative yield per plant compared to sole maize was 0.90 in R0, 107 in R2, 0.85 in R4 and 0.81 in R6. (Table 3). On average, treatments R4 and R6 decreased the seed-yields of maize by 6% and 12%, while R2 enhanced the maize grain yield by 19% than R0 in both years. Average across the two cropping seasons, SS significantly produced the highest pod number per plant (114.4 plant−1) and the highest grain number of a plant (142.6 plant−1). There were non-significant differences between treatments in the individual seed weight (mg) of soybean. However, different levels of leaf removal exhibited a significant impact on the final pod number plant−1 and the seed number plant−1, with highest values of 95.6 pods and 111.5 seeds plant−1 recorded under R6, followed by R4 (82.4 pods plant−1 and 99.8 seeds plant−1) and R2 (72.1 pods plant−1 and 93.0 seeds plant−1), and lowest values (63.9 pods plant−1 and 86.9 seeds plant−1) in R0. Pod number was higher at the middle nodes (8th-13th nodes of the main stem) than at the upper and lower nodes (Fig. 6c,d). The pod number per plant of SS was significantly higher than that of relay-cropped soybean at each node of the main stem.
Land equivalent ratio
In this study, the land equivalent ratio values of maize (LERm) were found higher than the corresponding land equivalent ratio values of soybean (LERs) in all leaf removal treatments. However, the land equivalent ratio (LER) of soybean was considerably improved in R2, R4, and R6 as compared to R0 treatment. In addition, treatments R2, R4, and R6 increased the LER of soybean by 7%, 17%, and 31% in 2017 and 6%, 13%, and 27% in 2018 as compared to R0, suggesting that LERs are closely related to the changes of light environment. Overall, under MS, the mean LER value of treatment R2 (1.73) was significantly higher than R0 (1.51), R4 (1.55) and R6 (1.59) in both years (Table 3).
Discussion
Effects of improved light environment on morphological characteristics
The light intensity of soybean plants decreases in MSR as compared to sole cropping of soybean (SS)18. However, in the current experiment, different levels of leaf removal in MSR enhanced (from 41% to 77%) the PAR-transmittance of soybean canopy by decreasing the rate of light absorbed and reflected by maize leaves which in turn improve the PAR-transmittance of soybean plants in MSR (Fig. 2). Previously, many studies have revealed that the lodging rate and plant height of soybean plants increases under shading conditions26,27. However, in this experiment, improved PAR-transmittance of soybean canopies led to decrease in the lodging rate and plant height of soybean plants under MSR (Fig. 3). Moreover, the SD and SBS of soybean are of primary concern for agronomist because these indices were adversely affected in intercropping conditions28. Similarly, our results confirmed that the decrease in SD and SBS of soybean plants under MSR is the consequence of dense maize shade during the co-growth phase. Therefore, increased SD and SBS of soybean plants are more favorable to reduce the soybean lodging in MSR.
Effects of improved light environment on leaf area index and photosynthetic characteristics
Improvement in leaf area index can improve the crop performance by enhancing the photosynthetic-rate29. At all sampling times, the leaf area index of soybean achieved the highest value in R6, followed by R4, R2, and R0 (Fig. 4). Higher LAI of soybean resulted from improved light environment exhibits the optimum leaf expansion and development, which increased the light-harvesting and efficiency of soybean leaves. This improvement in leaf area index might be due to the improved light environment of soybean canopy, which significantly improved the LAI of soybean because soybean LAI under MSR is directly related to the available light intensity30,31. The photosynthetic-rate of soybean leaves changed significantly under different light levels13, and shading conditions decreased the soybean photosynthetic-rate under MSR4. In this experiment, increased PAR-transmittance of soybean canopy from R2 to R6 in MSR led to enhance the transpiration- and photosynthetic-rate of soybean plants, but reductions were measured for intercellular CO2 concentration and stomatal conductance of soybean leaves in MSR (Table 1). These results are indicating that the adequate light can improve the photosynthetic characteristics of soybean leaves by decreasing the adverse impacts of maize-shading in MSR. These findings are consistent with the previous studies in which researchers have revealed that crop plants alter their physiological characteristics to perform better under the prevailing conditions32–34.
Effects of improved light environment on dry matter accumulation
The increased leaf area and photosynthetic-rate are the main factors for dry matter production (DMP) in oilseed crops35. Previously, researchers had confirmed that the decreased PAR-transmittance significantly reduced the DMP of soybean plants under MSR12. However, our results demonstrated that the leaf removal from maize canopy during the co-growth period in MSR, soybean adequately harvested and used enough sunlight for their biochemical and physiological processes which maintained the higher DMP. The treatment R6 significantly increased mean DMP of soybean by 40%, 35%, 50%, and 56% at 30, 50, 70, and 90 DAS, respectively than R0 (Table 2). The higher DMP in soybean might be due to the adequate accumulation of major nutrients from germination to maturity in MSR because an enhanced accumulation of major nutrient directly increases the intercrop DMP36,37 and improve light intensity significantly enhanced the nutrient uptake in crops38. Furthermore, the dry matter partitioning changed considerably in soybean, and our findings of treatment R0 confirms the past results which conclude that shading conditions significantly increase the dry matter allocation to stem, decreases the distribution of dry matter to roots and leaves in soybean12,39. However, the improved PAR-transmittance under R4 and R6 balanced the dry matter distribution between vegetative parts (stem and leaves) and reproductive parts (pods and seeds) in MSR (Fig. 5).
Effects of improved light on flower initiation and abscission
The main flush of flower initiation was directly affected by PAR-transmittance of soybean canopy in all leaf removal treatments. The initiated flower number accelerated proportionately with the increase in PAR-transmittance (Fig. 2) and leaf area index (Fig. 4) in R0, R2, R4, and R6 treatments for both years. Remarkably, the flower initiation was sustained at a high rate under treatment R6 where soybean plants accumulated higher dry matter than other treatments irrespective of full sunlight availability in all treatments after the harvest of maize crop in MSR, which suggested that flower initiation in soybean plants is sensitive to initial growth and dry matter accumulation. Moreover, the total number of initiated flowers increased concomitantly in soybean plants with the enhanced leaf growth. Indeed, a higher number of flowers would require increased partition of current photo-assimilates to flowering buds. As both, leaf growth and flower initiation increased with the increase in PAR-transmittance in MSR; it was evident that competition for photo-assimilates did not impinge on flower initiation. Previously, scientists have reported that the developing reproductive parts need a large amount of photo-assimilates to maintain growth during their initial developmental stages40,41. Therefore, photo-assimilate limitation seems to impinge at this early stage. Additionally, treatment R6 in MSR significantly reduced the flower abscission rate (Table 2), and this reduction in flower abscission may be due to the utilization of stored assimilates for flower initiation14. Our results are consistent with previous findings in which researchers had reported that the flower abscission was decreased when soybean plants were opened artificially at flowering stage42, while higher flower abscission in soybean was recorded under shading conditions19.
Effects of improved light on yield and yield components, and land equivalent ratio
The final pod-number at harvest was the outcome of the balance between two components: total initiated flowers and total abscised flowers. In this study, leaf removal treatments significantly increase the final pod-number of soybean plants at soybean harvest through increase the flower initiation and decrease the flower abscission. This response was predominantly due to the increase PAR-transmittance impact on flower initiation, which was positively linked with the assimilatory capacity of soybean plants. Similarly, except under R0, all leaf removal treatments significantly enhanced the final pod-number through the decrease of flower abscission because, in this way, most of the flower developed into pods. Previous predictive models of final pod-number43–45, and recent model which incorporates the flowering temporal profile46 are carbohydrate-based models. Present findings regarding the flower abscission component of the final pod-number per plant could be described by carbohydrate-based models. The seed-number (plant−1) showed the significant differences among different treatments and was affected by the initial growth and DMP, which provide the photo-assimilate for pod and seed formation. This finding suggested that seed-number in soybean plants was under the control of total leaf area and carbohydrate production47 and our leaf removal treatments significantly enhanced the source size which may be the possible reason of higher seed number in R6 under MSR (Table 3).
Furthermore, we observed the non-significant differences for seed weight of soybean in all treatments (Table 3) which might be due to the genetic character of soybean variety (Nandou-12), consistent with a past report where scientist concluded that seed size is genetically determined48. We further investigated the impacts of leaf removal levels on soybean seed-yield under MSR and SS. Our findings showed that the mean maximum soybean seed-yield was produced under treatment SS, while in leaf removal treatments under MSR, the average highest soybean seed-yield was measured in R6, with an improvement of 30% in 2017 and 27% in 2018 as compared to R0 (Table 3). This improvement in the seed-yield of soybean might be attributed to the higher pod and seed number, which all together enhanced the soybean seed-yield in MSR. On average, mean soybean seed-yield was increased by 28%, and maize seed-yield was decreased by 12% in R6 as compared to their corresponding values in R0. On the other hand, treatment R2 was the only treatment which increased the seed-yields of both intercrop species in MSR. This improvement in seed-yields of intercrop species maybe because of the optimum growing conditions8,49, better light interception within maize canopy50 and at soybean canopy, delayed leaf senescence at maturity51,52, and adequate uptake of major nutrients8,53. Moreover, the improved light conditions increased the nitrogen fixation ability of soybean plants54 and leaf defoliation treatments considerably improved the PAR-transmittance at soybean canopy. Therefore, it is possible that in MSR, the neighboring deep-root maize plants accumulated extra nitrogen that was released by soybean nodule3, which enhanced the maize seed-yield under R2 in both years. In addition, non-significant differences were noticed for the maize seed-yield under treatments R4, R6, and R0 in 2017. However, as compared to R0, R4 and R6 decreased the maize seed-yield by 6% and 12% in both years. This reduction in maize seed-yield under R4 and R6 might be due to the reduced photosynthesis at maturity due to the severe leaf loss (Data not shown)51 and decreased translocation of dry matter towards maize cob55, similar results were reported in past studies6,56.
Additionally, in this experiment, the values of LER were always greater than one under all treatments in MSR, which shows the seed-yield advantage of MSR over sole soybean and maize cropping systems due to the improved exploitation of water, land, light, and nutrients for growth57. Specifically, the mean values of LER in R0, R2, R4 and R6 were 1.51, 1.73, 1.55 and 1.59, respectively (Table 3), which shows that 51% to 73% of more agricultural land will be required by sole crop of soybean and maize to equal the seed-yield of MS, demonstrating the greater land-use efficiency than SS and SM58. Overall, the removal of leaves from maize top under MSR significantly improves the initial growth and development of soybean plants, accelerated the DMP and flower initiation in soybean and compensated the maize seed-yield loss by substantially increasing the seed-yield of soybean plants in MSR.
Conclusion
In the present study, our results revealed that different leaf defoliation levels had positive effects on soybean growth and development in MSR. The PAR-transmittance of soybean canopy was strengthened, and morphological characteristics of soybean were improved significantly for R4 and R6 treatments, which increased the LAI and photosynthetic rate of soybean plants, and soybean obtained a greater seed-yield under MSR. The most important finding of this study was the demonstration that the number of initiated flowers increased and the rate of flower abscission decreased as the PAR-transmittance, and dry matter production of soybean plants increased in MSR, especially during the co-growth period. This response exhibited a similar trend in all leaf removal treatments despite significant differences between SS and MSR. Moreover, heavy defoliation (R4 and R6) decreased the maize seed-yield and considerably increased the soybean seed-yield in MSR. Interestingly, treatment R2 was the only treatment which increased the seed-yield of both intercrops in MSR. Further experiments are needed to understand the nature of the internal signals modulating flower initiation.
Methods
Research location and planting material
This study was conducted in 2017 and 2018 at the research area of Sichuan Agricultural University in Ya’an (29° 59′ N, 103° 00′ E, altitude 620 m), China. We used the semi-compact Zhenghong-505 maize variety and the shade-tolerant Nandou-12 soybean variety in both years of experimentations. Both varieties are widely used for the production of soybean and maize in southwestern parts of China11.
Weather conditions and soil properties
The experimental site has a subtropical and humid climate. Long-term (1960–2010) average temperature is 16.21 °C, and average precipitation is 1200 mm. The weather data of experimental location during the growing seasons from 2017 to 2018 is presented in Table 4. The soil characteristics at Yaan were: pH of 6.62, organic matter of 29.85 g kg−1, total N of 1.62 g kg−1, total P of 1.28 g kg−1, total K of 16.32 g kg−1, available N of 317.14 mg kg−1, available P of 42.26 mg kg−1, and available K of 382.14 mg kg−1 in 0–30 cm soil layer.
Table 4.
Monthly rainfall, average temperature, and humidity from March to October in the growing seasons of 2017 and 2018.
| Month | Years | |||||
|---|---|---|---|---|---|---|
| 2017 | 2018 | |||||
| Rainfall (mm) | Average T (°C) | Humidity (%) | Rainfall (mm) | Average T (°C) | Humidity (%) | |
| March | 41.1 | 15.63 | 56.34 | 26.7 | 14.11 | 55.37 |
| April | 65.5 | 19.39 | 62.27 | 53.5 | 19.14 | 57.31 |
| May | 93.7 | 22.45 | 66.31 | 113.1 | 23.52 | 56.36 |
| June | 167.1 | 26.41 | 61.37 | 151.7 | 25.54 | 56.45 |
| July | 205.7 | 27.73 | 84.43 | 185.4 | 29.19 | 62.39 |
| August | 126.8 | 28.66 | 65.99 | 223.6 | 27.72 | 80.14 |
| September | 172.5 | 22.32 | 79.21 | 146.3 | 23.55 | 54.35 |
| October | 21.4 | 19.48 | 57.29 | 59.4 | 17.68 | 77.87 |
| March-October | 893.8 | 22.75 | 66.65 | 959.7 | 22.56 | 62.53 |
Experimental design and details
A randomized complete block design (RCBD) with four-leaf removal treatments and three replicates was used in both years of experiments. Soybean was relay intercropped with hybrid maize, and the results were compared with sole soybean (SS) and sole maize (SM). The MSR was used in the present study. In this experiment, we used the same planting arrangements which farmer practices in this area, and each strip in MSR contained 2 maize rows and 2 soybean rows (2:2). In this system, row to row spacing between soybean to soybean and maize to maize rows was 40 centimeters, and the gap of 60 centimeters was maintained between the rows of soybean and maize. Furthermore, sole soybean and maize were sown with a row distance of 50 centimeters and 70 centimeters, respectively. The size of each plot was 6 meters wide by 6 meters long. Both varieties were overseeded and thinned to keep a plant population of 100000 and 60000 plants per hectares for soybean and maize, respectively. Similar plant population was maintained in SS and SM by keeping a distance of 20 centimeters and 16.7 centimeters for soybean and maize, respectively. The times of sowing were the first week of April for maize and the second week of June for soybean in both years. The times of harvesting were the second week of August for maize and the last week of October for soybean in both years, and the cogrowth phase is shown in (Fig. 7). Basal fertilizers were applied at the time of sowing in intercropped and sole-cropped maize at a rate of N, P, and K of 135, 72, and 90 kg ha−1, respectively. The second dose of N for maize was applied at 75 kg ha−1 in all plots. Soybean was fertilized at sowing at rates of N, P, and K of 75, 40, and 4 kg ha−1, respectively. For fertilizers, urea, calcium superphosphate, and potassium chloride were used as sources of N, P, and K, respectively. All other farming practices were kept the same in all plots according to the crop demand and farmer’s practices in the area4. The crops were rainfed.
Figure 7.
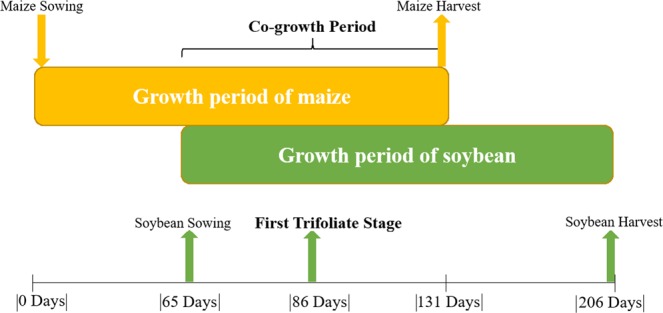
Illustration of the growth period of maize soybean relay-intercropping system. The upper-bar shows the growing period of maize crop (131days, first sown relay-crop), and the lower-bar shows the growing period of soybean crop (141 days, second sown relay-crop). The co-growth period (66 days), is defined as the proportion of the total system growth period that both relay-crops grow together.
Treatments
Leaf removal treatments were applied to maize, when the maize was at silking stage (30th June 2017 and 28th June 2018), and soybean at the first trifoliate leaf stage (Fig. 8) viz. no removal of leaves (R0); removal of two-leaves (R2); removal of four-leaves (R4); removal of six-leaves (R6) from the canopy of maize plants in MSR.
Figure 8.

Schematic representation of maize canopy as affected by leaf removal treatments in 2017 and 2018. The R2, R4, R6, and R0 refer to removal of the topmost two-leaves, four-leaves, six-leaves, with no removal of leaves, respectively, from maize canopy in relay intercropping system.
Measurements
Light conditions
Photosynthetically active radiation (PAR) was measured in all treatments to determine the variations of PAR-transmittance at soybean canopy. LI-191SA quantum sensors were placed on the horizontal arm of an observation scaffold, first above of maize canopy, and subsequently of soybean canopy. This was done at 30 and 50 days after sowing (DAS) in all treatments and all replicates during the co-growth period. In each treatment, the PAR was recorded three times on soybean and maize top from 10:00 am to 1:00 pm on a clear day, and then the average was measured. From the data, we calculated PAR-transmittance to the soybean as a percentage of incoming light at the top of the maize plants.
Morphological parameters
At 30, 50, 70 and 90 DAS, twenty soybean seedlings from each treatment were chosen, then plant height was determined from ground to top, and stem diameter was measured by using a Vernier caliper. Soybean’s lodging rate was assessed by determining the proportion of soybean stems (20 soybean stems per plot) for which the angle between the soybean stem and the ground was less than 30 degree11. The digital plant lodging tester was used to measure the stem breaking strength of soybean plants18.
Leaf area index and photosynthetic characteristics
The leaf area index of soybean in different treatments was determined at 30, 50, 70, and 90 DAS. For this purpose, ten consecutive soybean plants were sampled destructively from each treatment. The maximum leaf length and width were determined using a ruler. Then the leaf area was calculated by multiplying the leaf length, leaf width, and crop-specific coefficient factor of 0.75 for soybean59. Photosynthetic characteristics of soybean leaves were determined using a Li-6400 portable photosynthesis system equipped with a LED leaf chamber35. In all treatments, 3 expanded leaves from each experimental plot from soybean canopy were selected at 50 and 70 DAS, and photosynthetic characteristics were measured from 10:00 to 11:00 am on a clear day under a CO2 concentration of 400 µmol mol−1.
Dry matter accumulation
To measure the total dry matter accumulation and distribution over different plant parts (g plant−1), ten consecutive soybean plants were harvested from all treatments at 30, 50, 70 and 90 DAS. All samples were divided into root, stem, leaves, pods, and seed. All subsamples were oven-dried at 105 °C for one hour to kill the fresh-tissues and then dried at 65 °C until a constant weight reached. Cores (15 centimeters height and 8 centimeters diameter) for root dry matter analysis of soybean were collected using a core sampler. The soil cores were immersed in tap water and kept for three hours to disperse the soil. A root washer then separated roots from the dispersed soil.
Flower initiation and abscission
Flower formation and flower abscission were monitored on a daily basis from 51 DAS to 94 DAS on ten plants in each plot and replication. All nodes on all stems on a plant were carefully inspected, and new open flowers at R1 (initiation of the flowering stage) were individually tagged using embroidery thread at appearance (Table 5). The thread of different colors was used for every date of flower initiation. In this way, each flower was followed. All the initiated and abscised flowers at each node were counted at each date, and then the total number of initiated and abscised flower per plant were calculated at the end of flowering. Then flower abscission (%) was calculated by using the following formulas19.
Table 5.
Soybean physiological-stages and periods were recorded in 2017 and 2018.
| Serial No. | Physiological stage | Growth period | DAS 2017* | DAS 2018* |
|---|---|---|---|---|
| 1 | Seed emergence | Germination | 07 | 05 |
| 2 | Fifth-trifoliate | Vegetative | 35 | 33 |
| 3 | Beginning-flowering | Pre-reproductive | 51 | 54 |
| 4 | Beginning-pod | Reproductive | 64 | 66 |
| 5 | Full-flowering | Reproductive | 72 | 75 |
| 6 | End-flowering | Reproductive | 94 | 96 |
| 7 | End-pod | Reproductive | 101 | 103 |
| 8 | Physiological-maturity | Reproductive | 124 | 122 |
| 9 | Full-maturity | Reproductive | 136 | 134 |
*Plant samples were collected at 30, 50, 70 and 90 days after sowing (DAS) for all the measurements.
Yield and yield components
At full maturity, 40 consecutive soybean plants were harvested from the three plots per treatment (95% of pods achieved mature pod color). The pod number at each node of the main stem and the total number of pods plant−1 (PN) was determined. All the pods of the sampled plants were threshed manually, and then the seed number plant−1 (SN) was determined. The threshed seeds were weighed to determine the seed-yield plant−1 and changed into kg ha−1. Five lots of hundred soybean seeds from a bulk seed sample of every treatment were dried in an oven at 65 °C till constant weight reached, and then seed weight (SW) was determined using an electrical balance. Additionally, to evaluate the leaf removal effects on maize yield under MSR, we harvested the four m2 (twenty-four ears) from each treatment at maize maturity. All the harvested ears were dried under sunlight for 6 days; dried ears were manually threshed and weighed to determine the maize seed-yield of each treatment and then changed into kg ha−1.
Land equivalent ratio
The land equivalent ratio (LER) was calculated to determine the yield advantage of MS in response to different leaf removal treatments60:
Where LERs and LERm are the partial LER values for soybean and maize, respectively. Ysm and Yim are the seed-yield of maize (kg ha−1) under SM and MS, respectively. Yss and Yis are the seed-yield of soybean (kg ha−1) under SS and MS, respectively.
Statistical analysis
All the data recorded for every measured variable was analyzed using Statistix 8.1. Significance was determined via one-way analysis of variance. The least significance difference (LSD) test was employed to compare the means at 5% probability level. Microsoft Excel was used for the graphical presentation of data using standard error (±SE).
Acknowledgements
This research was funded by National Key Research and Development Program of China grant number (2016YFD0300602), the National Nature Science Foundation (31571615) and Program on Industrial Technology System of National Soybean (CARS-04-PS19). M. A. R’s thanks, to Professor Wenyu Yang for his useful advice that significantly improved the quality of the manuscript, to Rizwana Kousar and Rehana Kousar for their support and prayers. M. A. R. wants to thanks, in particular, Dr. Meki Gul for the sincerity, care, love, and respect over the past years. M. A. R. also wants to thanks, Nasir Iqbal who helped him throughout the tough situations of Ph.D. studies.
Author Contributions
M.A.R., L.Y.F., N.I., M.H.B., Y.K.C., S.A., A.M.U.D., A.K. and S.A. conducted the field experiment and collected all data in both study years. F.Y. and W.Y. conceived the study, secured the funding, and led the project progress. M.A.R. and A.W. performed the statistical analysis; M.A.R. and W.V.D.W. were involved in the data interpretation; M.A.R. wrote the whole paper; M.A.R. and L.Y.F. made all figures; M.A.R. and W.V.D.W. reviewed and revised this research paper.
Data Availability
The datasets generated during and/or analyzed during the current study are available from the corresponding author on reasonable request.
Competing Interests
The authors declare no competing interests.
Footnotes
Publisher’s note Springer Nature remains neutral with regard to jurisdictional claims in published maps and institutional affiliations.
Muhammad Ali Raza, Ling Yang Feng and Wopke van der Werf contributed equally.
Contributor Information
Feng Yang, Email: f.yang@sicau.edu.cn.
Wenyu Yang, Email: mssiyangwy@sicau.edu.cn.
References
- 1.Du J-b, et al. Maize-soybean strip intercropping: Achieved a balance between high productivity and sustainability. Journal of Integrative Agriculture. 2017;16:60345–60347. doi: 10.1016/S2095-3119(17)61789-1. [DOI] [Google Scholar]
- 2.Iqbal, N. et al. Comparative analysis of maize-soybean strip intercropping systems. A review. Plant Production Science (2018).
- 3.Chen P, et al. Effects of reduced nitrogen inputs on crop yield and nitrogen use efficiency in a long-term maize-soybean relay strip intercropping system. PloS one. 2017;12:e0184503. doi: 10.1371/journal.pone.0184503. [DOI] [PMC free article] [PubMed] [Google Scholar]
- 4.Yang F, et al. Effect of aboveground and belowground interactions on the intercrop yields in maize-soybean relay intercropping systems. Field Crops Research. 2017;203:16–23. doi: 10.1016/j.fcr.2016.12.007. [DOI] [Google Scholar]
- 5.Rahman T, et al. Water use efficiency and evapotranspiration in maize-soybean relay strip intercrop systems as affected by planting geometries. PloS one. 2017;12:e0178332. doi: 10.1371/journal.pone.0178332. [DOI] [PMC free article] [PubMed] [Google Scholar]
- 6.Raza MA, et al. Optimum leaf excision increases the biomass accumulation and seed yield of maize plants under different planting patterns. Annals of applied biology. 2019;175:1–15. doi: 10.1111/aab.12514. [DOI] [Google Scholar]
- 7.Raza, M. A. et al. Narrow-wide-row planting pattern increases the radiation use efficiency and seed yield of intercrop species in relay-intercropping system. Food and Energy Security, e170 (2019). [DOI] [PMC free article] [PubMed]
- 8.Raza MA, et al. Effect of planting patterns on yield, nutrient accumulation and distribution in maize and soybean under relay intercropping systems. Scientific reports. 2019;9:4947. doi: 10.1038/s41598-019-41364-1. [DOI] [PMC free article] [PubMed] [Google Scholar]
- 9.Wolff XY, Coltman RR. Productivity under shade in Hawaii of five crops grown as vegetables in the tropics. Journal of the American Society for Horticultural Science. 1990;115:175–181. doi: 10.21273/JASHS.115.1.175. [DOI] [Google Scholar]
- 10.Raza MA, et al. Growth and development of soybean under changing light environments in relay intercropping system. PeerJ. 2019;7:e7262. doi: 10.7717/peerj.7262. [DOI] [PMC free article] [PubMed] [Google Scholar]
- 11.Liu W, et al. Relationship between cellulose accumulation and lodging resistance in the stem of relay intercropped soybean [Glycine max (L.) Merr.] Field Crops Research. 2016;196:261–267. doi: 10.1016/j.fcr.2016.07.008. [DOI] [Google Scholar]
- 12.Yang F, et al. Growth of soybean seedlings in relay strip intercropping systems in relation to light quantity and red: far-red ratio. Field Crops Research. 2014;155:245–253. doi: 10.1016/j.fcr.2013.08.011. [DOI] [Google Scholar]
- 13.Feng LY, et al. The Influence of Light Intensity and Leaf Movement on Photosynthesis Characteristics and Carbon Balance of Soybean. Frontiers in plant science. 2018;9:1952. doi: 10.3389/fpls.2018.01952. [DOI] [PMC free article] [PubMed] [Google Scholar]
- 14.Jiang H, Egli D. Shade induced changes in flower and pod number and flower and fruit abscission in soybean. Agronomy Journal. 1993;85:221–225. doi: 10.2134/agronj1993.00021962008500020011x. [DOI] [Google Scholar]
- 15.Fan Y, et al. Effect of shading and light recovery on the growth, leaf structure, and photosynthetic performance of soybean in a maize-soybean relay-strip intercropping system. PloS one. 2018;13:e0198159. doi: 10.1371/journal.pone.0198159. [DOI] [PMC free article] [PubMed] [Google Scholar]
- 16.Zuber, M. & Kang, M. Corn lodging slowed by sturdier stalks. Crops and Soils (1978).
- 17.Li T, Liu L-N, Jiang C-D, Liu Y-J, Shi L. Effects of mutual shading on the regulation of photosynthesis in field-grown sorghum. Journal of Photochemistry and Photobiology B: Biology. 2014;137:31–38. doi: 10.1016/j.jphotobiol.2014.04.022. [DOI] [PubMed] [Google Scholar]
- 18.Liu W, et al. Evaluation of soybean (Glycine max) stem vining in maize-soybean relay strip intercropping system. Plant Production Science. 2015;18:69–75. doi: 10.1626/pps.18.69. [DOI] [Google Scholar]
- 19.Heindl JC, Brun WA. Light and shade effects on abscission and 14C-photoassimilate partitioning among reproductive structures in soybean. Plant physiology. 1983;73:434–439. doi: 10.1104/pp.73.2.434. [DOI] [PMC free article] [PubMed] [Google Scholar]
- 20.Jiang H, Egli DB. Soybean seed number and crop growth rate during flowering. Agronomy Journal. 1995;87:264–267. doi: 10.2134/agronj1995.00021962008700020020x. [DOI] [Google Scholar]
- 21.Board J, Tan Q. Assimilatory capacity effects on soybean yield components and pod number. Crop Science. 1995;35:846–851. doi: 10.2135/cropsci1995.0011183X003500030035x. [DOI] [Google Scholar]
- 22.Herbert S, Litchfield G. Growth response of short-season soybean to variations in row spacing and density. Field Crops Research. 1984;9:163–171. doi: 10.1016/0378-4290(84)90022-4. [DOI] [Google Scholar]
- 23.Ramseur E, Wallace S, Quisenberry V. Growth of ‘Braxton’Soybeans as Influenced by Irrigation and Intrarow Spacing 1. Agronomy Journal. 1985;77:163–168. doi: 10.2134/agronj1985.00021962007700010037x. [DOI] [Google Scholar]
- 24.Board JE, Harville BG. A criterion for acceptance of narrow-row culture in soybean. Agronomy Journal. 1994;86:1103–1106. doi: 10.2134/agronj1994.00021962008600060033x. [DOI] [Google Scholar]
- 25.Egli DB, Bruening WP. Potential of early-maturing soybean cultivars in late plantings. Agronomy Journal. 2000;92:532–537. doi: 10.2134/agronj2000.923532x. [DOI] [Google Scholar]
- 26.Morelli G, Ruberti I. Light and shade in the photocontrol of Arabidopsis growth. Trends in plant science. 2002;7:399–404. doi: 10.1016/S1360-1385(02)02314-2. [DOI] [PubMed] [Google Scholar]
- 27.Nagasuga K, Kubota F. Effects of shading on hydraulic resistance and morphological traits of internode and node of napiergrass (Pennisetum purpureum Schumach.) Plant Production Science. 2008;11:352–354. doi: 10.1626/pps.11.352. [DOI] [Google Scholar]
- 28.Wu Y, Gong W, Yang W. Shade inhibits leaf size by controlling cell proliferation and enlargement in soybean. Scientific Reports. 2017;7:9259. doi: 10.1038/s41598-017-10026-5. [DOI] [PMC free article] [PubMed] [Google Scholar]
- 29.Liu X, et al. PAR Interception and Utilization in Different Maize and Soybean Intercropping Patterns. PloS one. 2017;12:e0169218. doi: 10.1371/journal.pone.0169218. [DOI] [PMC free article] [PubMed] [Google Scholar]
- 30.Wu Y, et al. Shade adaptive response and yield analysis of different soybean genotypes in relay intercropping systems. Journal of Integrative Agriculture. 2017;16:1331–1340. doi: 10.1038/s41598-017-10026-5. [DOI] [Google Scholar]
- 31.Feng LY, et al. Narrow-wide row planting pattern improves the light environment and seed yields of intercrop species in relay intercropping system. PloS one. 2019;14:e0212885. doi: 10.1371/journal.pone.0212885. [DOI] [PMC free article] [PubMed] [Google Scholar]
- 32.Dai Y, et al. Effects of shade treatments on the photosynthetic capacity, chlorophyll fluorescence, and chlorophyll content of Tetrastigma hemsleyanum Diels et Gilg. Environmental and Experimental Botany. 2009;65:177–182. doi: 10.1016/j.envexpbot.2008.12.008. [DOI] [Google Scholar]
- 33.Huang D, Wu L, Chen J, Dong L. Morphological plasticity, photosynthesis and chlorophyll fluorescence of Athyrium pachyphlebium at different shade levels. Photosynthetica. 2011;49:611–618. doi: 10.1007/s11099-011-0076-1. [DOI] [Google Scholar]
- 34.Ahmed S, et al. Responses of Soybean Dry Matter Production, Phosphorus Accumulation, and Seed Yield to Sowing Time under Relay Intercropping with Maize. Agronomy. 2018;8:282. doi: 10.3390/agronomy8120282. [DOI] [Google Scholar]
- 35.Raza M, et al. Effect of Sulphur Application on Photosynthesis and Biomass Accumulation of Sesame Varieties under Rainfed Conditions. Agronomy. 2018;8:149. doi: 10.3390/agronomy8080149. [DOI] [Google Scholar]
- 36.Li L, et al. Wheat/maize or wheat/soybean strip intercropping: I. Yield advantage and interspecific interactions on nutrients. Field Crops Research. 2001;71:123–137. doi: 10.1016/S0378-4290(01)00156-3. [DOI] [Google Scholar]
- 37.Raza MA, et al. Sulphur application increases seed yield and oil content in sesame seeds under rainfed conditions. Field Crops Research. 2018;218:51–58. doi: 10.1016/j.fcr.2017.12.024. [DOI] [Google Scholar]
- 38.Baligar V, et al. Light intensity effects on growth and micronutrient uptake by tropical legume cover crops. Journal of plant nutrition. 2006;29:1959–1974. doi: 10.1080/01904160600927633. [DOI] [Google Scholar]
- 39.Khalid M, et al. Effect of shade treatments on morphology, photosynthetic and chlorophyll fluorescence characteristics of soybeans (Glycine Max l. Merr.) Applied Ecology and Environmental Research. 2019;17:2551–2569. doi: 10.15666/aeer/1702_25512569. [DOI] [Google Scholar]
- 40.Brun WA, Betts KJ. Source/sink relations of abscising and nonabscising soybean flowers. Plant physiology. 1984;75:187–191. doi: 10.1104/pp.75.1.187. [DOI] [PMC free article] [PubMed] [Google Scholar]
- 41.Heitholt JJ, Egli D, Leggett J, MacKown C. Role of Assimilate and Carbon-14 Photosynthate Partitioning in Soybean Reproductive Abortion 1. Crop Science. 1986;26:999–1004. doi: 10.2135/cropsci1986.0011183X002600050032x. [DOI] [Google Scholar]
- 42.Mathew JP, Herbert SJ, Zhang S, Rautenkranz AA, Litchfield GV. Differential response of soybean yield components to the timing of light enrichment. Agronomy Journal. 2000;92:1156–1161. doi: 10.2134/agronj2000.9261156x. [DOI] [Google Scholar]
- 43.Sheldrake A. A hydrodynamical model of pod-set in pigeon pea (Cajanus cajan) Indian Journal of Plant Physiology. 1979;22:137–143. [Google Scholar]
- 44.Charles-Edwards, D. A. Modelling plant growth and development (1986).
- 45.Egli D, Zhen-wen Y. Crop growth rate and seeds per unit area in soybean. Crop Science. 1991;31:439–442. doi: 10.2135/cropsci1991.0011183X003100020043x. [DOI] [Google Scholar]
- 46.Egli DB. SOYPOD: A model of fruit set in soybean. Agronomy Journal. 2010;102:39–47. doi: 10.2134/agronj2009.0222. [DOI] [Google Scholar]
- 47.Quijano A, Morandi EN. Post-flowering leaflet removals increase pod initiation in soybean canopies. Field Crops Research. 2011;120:151–160. doi: 10.1016/j.fcr.2010.09.009. [DOI] [Google Scholar]
- 48.Hartwig EE. Varietal development. Soybeans: Improvement, Production and Use. 1973;16:187–210. [Google Scholar]
- 49.Liu T-N, Gu L-M, Xu C-L, Dong S-T. Responses of group and individual leaf photosynthetic characteristics of two summer maize (Zea mays L.) to leaf removal under high plant density. Canadian Journal of Plant Science. 2014;94:1449–1459. doi: 10.4141/cjps2013-319. [DOI] [Google Scholar]
- 50.Jun X, Ling G, Shi Z-G, Zhao Y-S, Zhang W-F. Effect of leaf removal on photosynthetically active radiation distribution in maize canopy and stalk strength. Journal of Integrative Agriculture. 2017;16:85–96. doi: 10.1016/S2095-3119(16)61394-1. [DOI] [Google Scholar]
- 51.Liu T, Huang R, Cai T, Han Q, Dong S. Optimum Leaf Removal Increases Nitrogen Accumulation in Kernels of Maize Grown at High Density. Scientific reports. 2017;7:39601. doi: 10.1038/srep39601. [DOI] [PMC free article] [PubMed] [Google Scholar]
- 52.Liu TN, Xu CL, Gu LM, Dong ST. Effects of leaf removal on canopy apparent photosynthesis and individual leaf photosynthetic characteristics in summer maize under high plant density. Acta Agronomica Sinica. 2014;40:143–153. doi: 10.3724/SP.J.1006.2014.00143. [DOI] [Google Scholar]
- 53.Xia H-Y, et al. Contribution of interspecific interactions and phosphorus application to sustainable and productive intercropping systems. Field Crops Research. 2013;154:53–64. doi: 10.1016/j.fcr.2013.07.011. [DOI] [Google Scholar]
- 54.Sedghi M, Sharifi RS, Ghalipouri A. Practical methods for increasing light interception efficiency and root growth in soybean. Pak. J. Biol. Sci. 2008;11:595–600. doi: 10.3923/pjbs.2008.595.600. [DOI] [PubMed] [Google Scholar]
- 55.Liu T, et al. Optimum leaf removal increases canopy apparent photosynthesis, 13 C-photosynthate distribution and grain yield of maize crops grown at high density. Field Crops Research. 2015;170:32–39. doi: 10.1016/j.fcr.2014.09.015. [DOI] [Google Scholar]
- 56.Wei S, Wang X, Jiang D, Dong S. Physiological and proteome studies of maize (Zea mays L.) in response to leaf removal under high plant density. BMC plant biology. 2018;18:378. doi: 10.1186/s12870-018-1607-8. [DOI] [PMC free article] [PubMed] [Google Scholar]
- 57.Yang F, et al. Yield response to different planting geometries in maize–soybean relay strip intercropping systems. Agronomy Journal. 2015;107:296–304. doi: 10.2134/agronj14.0263. [DOI] [Google Scholar]
- 58.Agegnehu G, Ghizaw A, Sinebo W. Yield performance and land-use efficiency of barley and faba bean mixed cropping in Ethiopian highlands. European Journal of agronomy. 2006;25:202–207. doi: 10.1016/j.eja.2006.05.002. [DOI] [Google Scholar]
- 59.Gao Y, et al. Distribution and use efficiency of photosynthetically active radiation in strip intercropping of maize and soybean. Agronomy Journal. 2010;102:1149–1157. doi: 10.2134/agronj2009.0409. [DOI] [Google Scholar]
- 60.Mead R, Willey R. The concept of a ‘land equivalent ratio’and advantages in yields from intercropping. Experimental Agriculture. 1980;16:217–228. doi: 10.1017/S0014479700010978. [DOI] [Google Scholar]
Associated Data
This section collects any data citations, data availability statements, or supplementary materials included in this article.
Data Availability Statement
The datasets generated during and/or analyzed during the current study are available from the corresponding author on reasonable request.