Abstract
Background
We conducted a meta-analysis to systematically evaluate the relationship between programmed death-ligand 1 (PD-L1) expression and survival in patients with lung cancer.
Methods
The electronic databases PubMed, Embase, Cochrane, and Web of Science were searched up to January 2nd, 2018, for articles relating to PD-L1 expression detected by immunohistochemistry (IHC) and lung cancer patient prognosis.
Results
Fifty studies including 11,383 patients published between 2011 and 2017 were enrolled in this meta-analysis. The pooled hazard ratios (HRs) and 95% confidence intervals (CIs) suggested that PD-L1 IHC expression was related to poor overall survival (OS) (HR =1.45, 95% CI: 1.24–1.68). In subgroup analysis categorized according to sample type, cut-off value, ethnicity and TNM stage, the pooled results demonstrated inferior survival in the PD-L1 positive group when the PD-L1 expression was detected by resection specimens (P=0.000), 5% was taken as the cutoff value (P=0.000), the patients were in early stage (I–III) (P=0.000), and the geographic setting of the study was in Asia (P=0.000). Besides, patients with high PD-L1 expression had shorter OS in NSCLC (P=0.000), ADC (P=0.000), SCC (P=0.353) and LELC (P=0.810), while no significant difference was observed in SCLC (P=0.000). The pooled odds ratios (ORs) suggested that PD-L1 expression was associated with male (P<0.001), smoker (P<0.001), poor tumor differentiation (P=0.014), large tumor size (P=0.132), positive lymph nodal metastasis (P=0.002), EGFR wild-type status (P<0.001) and KRAS mutations (P=0.393). However, age (P=0.15) and ALK rearrangements (P=0.567) had no bearing on PD-L1 expression.
Conclusions
PD-L1 expression that is associated with several clinicopathological feactures may serve as a poor prognostic biomarker for patients with lung cancer.
Keywords: Lung cancer, meta-analysis, programmed cell death ligand 1, prognosis
Introduction
Lung cancer is the most lethal cancer and a major public health challenge both worldwide and in China (1,2). Most lung cancer patients are diagnosed at the advanced stage as lacking of specific symptoms at early stage. Even with multidisciplinary treatment, the long-term survival rate of lung cancer remains poor, and the overall five-year survival rate is merely 17% (3). In clinical practice, several independent prognostic factors like disease stage and performance status are valuable for guiding treatments for individual patients (4). Nevertheless, the discriminant value of most potential prognostic biological markers is insufficient, and molecular biomarkers that precisely identify patients at a high risk of poor prognosis urgently need to be discovered.
Programmed death 1 (PD-1), which belongs to the CD28 superfamily, is an inhibitory surface-receptor expressing on activated T, B, and natural killer (NK) cells, and regulates their proliferation and activation (5). Programmed cell death ligand 1 (PD-L1), which belongs to the B7 family, is the main ligand of PD-1 that is frequently upregulated in several kinds of human malignancies, including lung cancer (6,7). PD-L1 transmits inhibitory signals leading to apoptosis or exhaustion of activated T cells, differentiation of naive CD4+ T cells into regulatory T cells, and maintenance of suppressive functions of regulatory T cells by engaging its receptor PD-1. Consequently, blockade of PD-1/PD-L1 signaling has demonstrated clinical efficacy in multiple tumor types in recent clinical trials (8,9).
Though several studies have reported the relationship between PD-L1 expression and survival in patients with lung cancer, the data still remain inconsistent and conflicting. To address these issues, we carried out a comprehensive meta-analysis to quantitatively investigate the clinicopathological and prognostic significance of PD-L1 expression in patients with lung cancer.
Methods
Literature search
The electronic databases PubMed, Embase, Cochrane, and Web of Science were searched using the following keywords: (“PD-L1” or “B7-H1” or “CD274” or “programmed cell death ligand 1”) and (“lung cancer” or “lung neoplasms” or “pulmonary cancers”). The last search deadline was January 2nd, 2018.
Inclusion and exclusion criteria
Two authors (H Li and Y Xu) determined study eligibility independently, and any discrepancies were resolved by consensus. Studies eligible for inclusion were gathered in accordance with the following criteria: (I) all patients were confirmed to have lung cancer by a pathology assessment; (II) PD-L1 protein expression was evaluated in the primary lung cancer tissues by IHC; (III) studies revealed a correlation between PD-L1 expression and prognosis of lung cancer; (IV) studies reported sufficient information about PD-L1 expression and clinicopathological parameters; (V) studies provided HR and it’s 95% CI for OS, or sufficient information to estimate them; (VI) all patients received no preoperative immunotherapy; (VII) when there was more than one study with the same patient population, only the most recent or the most complete study was included. The exclusion criteria included the followings: (I) reviews, case reports, editorials, conference abstracts, meta-analyses, in vivo or vitro studies, non-English articles; (II) studies with insufficient data to be extracted; (III) a sample size of fewer than 20 patients.
Data extraction
The following information was extracted from each included study: name of the first author, year of publication, study location, the number of patients, sample type (resection, biopsy, etc.), histology, TNM stage, IHC antibody, IHC counting method, cut-off value, the percent of PD-L1 positive, HR and 95% CI: for OS, clinicopathological parameters. If any data from the above categories were not reported directly, items were treated as “not applicable (NA)”. If the HRs and their 95% CIs were not reported explicitly, we estimated the values from Kaplan-Meier curves using the methods of Parmar (10).
Quality assessment and statistical analysis
The final eligible articles were evaluated independently by two authors (H Li and B Wan) according to the Newcastle-Ottawa Scale (NOS), and any discrepancies were resolved by consensus. The maximum possible NOS score is 9 points, and any study included which receives a score of more than 6 is rated as high quality (11). The pooled overall survival (OS) was used to assess the relationship between PD-L1 expression and prognosis, and the pooled odds ratios (ORs) were combined to investigate the correlation between PD-L1 expression and clinicopathological features. The heterogeneity was statistically tested by chi-squared test and I square (I2), and a chi-squared P value <0.1 or an I2 statistic >50% was defined as statistically significant heterogeneity (12). If significant heterogeneity was observed, we used a random-effects model for the following analysis, otherwise a fixed-effects model was applied. Moreover, the potential publication bias was assessed through Begg’s funnel plots (13). All of the statistical analyses were conducted using STATA version 12.0 (Stata Corporation, College Station, TX, USA) statistical software.
Results
Study selection and characteristics
The initial database searching yielded a total of 372 records eligible for inclusion. Through reviewing the titles or abstracts of the all articles, 304 articles were excluded in accordance with the exclusion criteria (reviews, case reports, comments, meta-analysis, in vivo/vitro studies, conference abstracts, non-English language, or having fewer than 20 patients). The full text of the remaining 68 articles were further reviewed in detail, and eventually, 50 studies fulfilling the inclusion criteria were included in this meta-analysis. A flowchart of study selection is shown in Figure 1.
Figure 1.
Flow chart of study selection.
The major characteristics and technical information on PD-L1 immunohistochemistry (IHC) of the 50 eligible studies are shown in Tables 1 and 2, respectively. In total, 50 studies published between 2011 and 2017 were included in the pooled analysis, with 11,383 lung cancer patients from Australia, Canada, China, France, Germany, Italy, Japan, Korea, and the United States enrolled. The study cohort size ranged from 36 to 1,070 patients (median 228). Among the 50 studies, 24 focused on PD-L1 expression in non-small cell lung cancer (NSCLC) (7,14-36), 12 focused on adenocarcinoma (ADC) (37-48), 5 focused on squamous cell carcinoma (SCC) (49-53), 3 focused on small cell lung cancer (SCLC) (54-56), 2 focused on pulmonary lymphoepithelioma-like carcinoma (LELC) (57,58), 1 focused on pulmonary sarcomatoid carcinomas (SC) (59), 1 focused on high-grade neuroendocrine tumor (HGNET) (60), 1 focused on pulmonary pleomorphic carcinoma (PPC) (61), and 1 focused on pleomorphic, spindle cell and giant cell carcinoma of the lung (PSCGCC) (62). The expression of PD-L1 was found in 4,293 participants (37.7%), although the definitions of positive expressions of PD-L1 among the studies varied.
Table 1. Characteristics of the studies included in the meta-analysis.
| Author | Year | Patients source | No. | Tissues source | Histology | Stage | Outcome | HR estimation | Prognostic value |
|---|---|---|---|---|---|---|---|---|---|
| Chen | 2012 | China | 120 | Surgical resections | NSCLC | I–III | OS | HR and 95% CI: 2.95 (1.63–4.38) | Poor |
| Mao | 2014 | China | 128 | Surgical resections | NSCLC | I–III | OS | HR and 95% CI: 1.90 (1.09–3.30) | Poor |
| Cha | 2016 | Korea | 323 | Surgical resections | ADC | I–IV | OS | HR and 95% CI: 2.70 (1.78-4.10) | Poor |
| Toyokawa | 2017 | Japan | 292 | Surgical resections | ADC | I | OS | HR and 95% CI: 5.86 (2.66–12.91) | Poor |
| Mu | 2011 | China | 109 | Surgical resections | NSCLC | I–III | OS | Survival curves: 1.78 (1.12–2.83) | Poor |
| Schmidt | 2015 | Germany | 321 | Surgical resections | NSCLC | I–III | OS | HR and 95% CI: 0.95 (0.68–1.33) | NA |
| Miao | 2017 | China | 83 | NA | SCLC | I–IV | OS | HR and 95% CI: 0.943 (0.57–1.56) | Good |
| Jiang | 2015 | China | 79 | NA | LELC | I–IV | OS | HR and 95% CI: 3.44 (0.86–13.68) | NA |
| Lin | 2015 | China | 56 | Surgical resections or biopsy specimens | ADC | IV | OS | HR and 95% CI: 0.26 (0.11–0.62) | Good |
| Zhang | 2014 | China | 143 | Surgical resections | ADC | I–III | OS | K-M and 95% CI: 2.72 (1.29–5.73) | Poor |
| Tang | 2015 | China | 170 | Surgical resections or biopsy specimens | NSCLC | IIIB–IV | OS | HR and 95% CI: 1.901 (0.953–3.790) | NA |
| Ishii | 2015 | Japan | 102 | NA | SCLC | I–IV | OS | HR and 95% CI: 0.44 (0.24–0.80) | Good |
| Yang | 2014 | Taiwan | 163 | Surgical resections | ADC | I | OS | K-M and 95% CI: 0.85 (0.21–3.44) | NA |
| Yvorel | 2017 | France | 36 | Surgical resections | PSCGCC | I–IV | OS | K-M and 95% CI: 1.30 (0.4–4.27) | Poor |
| Zhang | 2017 | China | 84 | Surgical resections | SCC | I–III | OS | HR and 95% CI: 2.49 (1.27–4.88) | Poor |
| Inamura | 2017 | Japan | 115 | Surgical resections | HGNET | I–IV | OS | HR and 95% CI: 0.29 (0.11–0.61) | Good |
| Takada | 2017 | Japan | 499 | Surgical resections | NSCLC | I–III | OS | HR and 95% CI: 2.08 (1.42–3.09) | Poor |
| Shimoji | 2016 | Japan | 220 | Surgical resections | NSCLC | I–IV | OS | K-M and 95% CI: 2.42 (1.25–4.68) | Poor |
| D’incecco | 2015 | Italy | 123 | NA | NSCLC | IV | OS | K-M and 95% CI: 0.70 (0.44–1.11) | NA |
| Mori | 2017 | Japan | 296 | Surgical resections | ADC | NR | OS | HR and 95% CI: 2.59 (1.25–5.39) | Poor |
| Chang | 2017 | Taiwan | 186 | Biopsies,surgery | SCLC | I–IV | OS | K-M and 95% CI: 2.90 (1.44–5.86) | Poor |
| Igawa | 2017 | Japan | 229 | Surgical resections | NSCLC | I–III | OS | HR and 95% CI: 0.90 (0.60–1.35) | NA |
| Okita | 2017 | Japan | 91 | Surgical resections | NSCLC | IA–IIIA | OS | HR and 95% CI: 3.32 (1.10–9.97) | Poor |
| Sun | 2016 | Korea | 1,070 | Surgical resections | NSCLC | I–IV | OS | HR and 95% CI: 1.23 (1.00–1.51) | Poor |
| Song | 2016 | China | 385 | Surgical resections | ADC | I–III | OS | HR and 95% CI: 1.79 (1.30–2.46) | NA |
| Inamura | 2016 | Japan | 268 | Surgical resections | ADC | I–IV | OS | HR and 95% CI: 1.88 (1.25–2.74) | Poor |
| Vieira | 2016 | France | 75 | Surgical resections | SC | I–IV | OS | HR and 95% CI: 1.07 (0.60–2.00) | NA |
| Takada-a | 2017 | Japan | 205 | Surgical resections | SCC | I–III | OS | HR and 95% CI: 1.65 (1.08–2.54) | Poor |
| Wu | 2017 | China | 133 | Surgical resections | ADC | I–IV | OS | HR and 95% CI: 3.39 (1.25–9.19) | Poor |
| Pan | 2017 | China | 329 | Surgical resections | NSCLC | I–III | OS | K-M and 95% CI: 3.23 (0.80–13.12) | NA |
| Tokito | 2016 | Japan | 74 | NA | NSCLC | III | OS | HR and 95% CI: 0.47 (0.37–1.53) | NA |
| Cooper | 2015 | Australia | 678 | Surgical resections | NSCLC | I–III | OS | HR and 95% CI: 0.65 (0.45–0.85) | Good |
| Guo | 2017 | China | 128 | NA | SCC | III–IV | OS | K-M and 95% CI: 2.29 (1.47–3.57) | Poor |
| Zhou | 2017 | China | 108 | Surgical resections | NSCLC | I–IV | OS | HR and 95% CI: 2.57 (1.46–4.52) | Poor |
| Ji | 2017 | China | 100 | Surgical resections | NSCLC | I–III | OS | HR and 95% CI: 2.21 (1.10–4.42) | Poor |
| Huynh | 2016 | USA | 261 | Surgical resections | ADC | I–IV | OS | K-M and 95% CI: 1.65 (0.79–3.45) | Poor |
| Kim | 2015 | Korea | 331 | Surgical resections | SCC | I–III | OS | K-M and 95% CI: 1.24(0.76–2.02) | NA |
| Inoue | 2016 | Japan | 654 | Surgical resections | NSCLC | I–III | OS | HR and 95% CI: 1.23 (0.86–1.76) | NA |
| Sorensen | 2016 | USA | 204 | Biopsy specimens | NSCLC | IV | OS | HR and 95% CI: 1.17 (0.83–1.65) | NA |
| Teng | 2016 | China | 126 | Surgical resections | NSCLC | I | OS | HR and 95% CI: 1.00 (0.47–2.14) | NA |
| Chang | 2016 | Taiwan | 122 | Surgical resections or Biopsy specimens | PPC | I–IV | OS | K-M and 95% CI: 1.54 (0.94–2.54) | Poor |
| Fang | 2015 | China | 113 | Surgical resections | LELC | I–IV | OS | HR and 95% CI: 2.73 (0.76–9.81) | NA |
| Ameratunga | 2016 | Australia | 420 | Surgical resections | NSCLC | I–III | OS | HR and 95% CI: 1.05 (0.62–1.78) | NA |
| Ilie | 2016 | France | 56 | Surgical resections | SCC | I–IV | OS | K-M and 95% CI: 1.79 (0.28–11.44) | NA |
| Chen | 2016 | China | 48 | Surgical resections | NSCLC | I–III | OS | K-M and 95% CI: 1.25 (0.75–2.08) | NA |
| Tsao | 2017 | Canada | 982 | NA | NSCLC | I–IV | OS | HR and 95% CI: 1.01 (0.76–1.35) | NA |
| Hirai | 2017 | Japan | 94 | Surgical resections | ADC | I | OS | HR and 95% CI: 2.81 (1.06–8.23) | Poor |
| Yang | 2017 | China | 178 | Surgical resections | NSCLC | I–IV | OS | HR and 95% CI: 1.68 (0.83–3.40) | NA |
| Azuma | 2014 | Japan | 164 | Surgical resections | NSCLC | I–III | OS | HR and 95% CI: 1.60 (1.08–2.38) | Poor |
| Uruga | 2017 | USA | 109 | Surgical resections | ADC | II–III | OS | K-M and 95% CI: 0.68 (0.40–1.16) | NA |
No., number of patients; NSCLC, non-small cell lung cancer; ADC, adenocarcinoma; SCC, squamous cell carcinoma; SCLC, small cell lung cancer; LELC, pulmonary lymphoepithelioma-like carcinoma; SC, sarcomatoid carcinomas; HGNET, high-grade neuroendocrine tumor; PPC, pulmonary pleomorphic carcinoma; PSCGCC, pleomorphic, spindle cell and giant cell carcinoma; OS, overall survival; HR, hazard ratio; K-M, Kaplan-Meier curve; NA, not available.
Table 2. Technical information on PD-L1 immunohistochemistry of the studies included in the meta-analysis.
| Author | Year | IHC counting method | Cut-off | PD-L1 positive (%) | Antibody | |||
|---|---|---|---|---|---|---|---|---|
| Company | Source | Type | Clone | |||||
| Chen | 2012 | Percentage of positive cells and staining intensity | IRS ≥3 | 57.5% (69/120) | Abcam, HK | Rabbit | PAB | 236A/E7 |
| Mao | 2014 | Percentage of positive cells and staining intensity | IRS ≥2 | 72.7% (93/128) | NA | Mouse | MAB | 2H11 |
| Cha | 2016 | Percentage of positive cells | ≥5% | 18.6% (60/323) | Spring Bioscience, USA | Rabbit | MAB | SP142 |
| Toyokawa | 2017 | Percentage of positive cells | ≥5% | 16.1% (47/292) | Ventana Medical Systems, USA | Rabbit | MAB | SP142 |
| Mu | 2011 | Percentage of positive cells and staining intensity | Median value of all the H-scores | 53.2% (58/109) | NA | NA | MAB | NA |
| Schmidt | 2015 | Percentage of positive cells and staining intensity | ≥10% and Moderate or strong staining | 24% (77/321) | Cell Signaling, USA | Rabbit | MAB | E1L3N |
| Miao | 2017 | Percentage of positive cells | ≥5% | 51.8% (43/83) | SPRINGBIO, USA | Mouse | NA | SP66 |
| Jiang | 2015 | Percentage of positive cells | ≥5% | 63.3% (50/79) | Abcam, UK | Rabbit | PAB | NA |
| Lin | 2015 | Percentage of positive cells and staining intensity | Mean value of all the H-scores | 53.6% (30/56) | Abcam, UK | Rabbit | PAB | ab58810 |
| Zhang | 2014 | Percentage of positive cells and staining intensity | Median value of all the H-scores | 49% (70/143) | Sigma-Aldrich, USA | Rabbit | PAB | SAB2900365 |
| Tang | 2015 | Percentage of positive cells and staining intensity | H-score ≥5 | 65.9% (112/170) | Cell Signaling, USA | Rabbit | MAB | E1L3N |
| Ishii | 2015 | Percentage of positive cells | ≥5% | 71.6% (73/102) | Abcam, UK | Rabbit | MAB | NA |
| Yang | 2014 | Percentage of positive cells and staining intensity | >5% and moderate-to-strong staining | 39.9% (65/163) | Proteintech Group Inc., USA | NA | NA | NA |
| Yvorel | 2017 | Percentage of positive cells | ≥5% | 75% (27/36) | Cell Signaling, USA | Rabbit | MAB | E1L3N |
| Zhang | 2017 | Percentage of positive cells and staining intensity | ≥5% and weak or Moderate or strong staining | 58.3% (49/84) | Abcam, UK | Rabbit | MAB | 28-8 |
| Inamura | 2017 | Percentage of positive cells | ≥5% | 21% (25/115) | Cell Signaling, USA | Rabbit | MAB | E1L3N |
| Takada | 2017 | Percentage of positive cells | ≥1% | 37.9% (189/499) | Spring Bioscience, USA | Rabbit | MAB | SP142 |
| Shimoji | 2016 | Percentage of positive cells and staining intensity | H-score ≥5 | 32% (70/220) | Cell Signaling, USA | Rabbit | MAB | E1L3N |
| D’incecco | 2015 | Percentage of positive cells and staining intensity | >5% and moderate-to-strong staining | 55.3% (68/123) | Abcam, UK | Rabbit | PAB | ab58810 |
| Mori | 2017 | Percentage of positive cells and staining intensity | 50 PD-L1 score | 36.1% (107/296) | Abcam, UK | Rabbit | MAB | EPR1611 |
| Chang | 2017 | Percentage of positive cells and staining intensity | ≥5% and moderate to strong staining | 78% (145/186) | Proteintech Group Inc., USA | Rabbit | PAB | NA |
| Igawa | 2017 | Percentage of positive cells and staining intensity | Median value of all the H-scores | 52.4% (120/229) | Ventana Medical Systems, USA | Rabbit | PAB | SP263 |
| Okita | 2017 | Percentage of positive cells and staining intensity | H-score >100 | 14% (13/91) | Spring Bioscience, USA | Mouse | MAB | SP142 |
| Sun | 2016 | Percentage of positive cells | ≥1% | 44.7% (478/1,070) | Merck & Co, USA | Mouse | MAB | 22C3 |
| Song | 2016 | Percentage of positive cells | ≥5% | 48.3% (186/385) | Proteintech Group Inc., USA | Rabbit | NA | 66248-1-Ig |
| Inamura | 2016 | Percentage of positive cells | ≥5% | 16% (43/268) | Cell Signaling, USA | Rabbit | MAB | E1L3N |
| Vieira | 2016 | Percentage of positive cells | ≥5% | 53% (40/75) | NA | Murine | MAB | 5H1 |
| Takada-a | 2017 | Percentage of positive cells | ≥1% | 51.7% (106/205) | Spring Bioscience, USA | Rabbit | MAB | SP142 |
| Wu | 2017 | Percentage of positive cells | ≥25% | 13.5% (18/133) | Roche Ventana, USA | Rabbit | MAB | SP263 |
| Pan | 2017 | Percentage of positive cells and staining intensity | 1+ to 3+ | 14% (46/329) | Dako | Mouse | MAB | 22C3 |
| Tokito | 2016 | Percentage of positive cells | ≥5% | 74.3% (55/74) | Abcam, UK | Rabbit | MAB | EPR1161 |
| Cooper | 2015 | Percentage of positive cells | ≥50% | 7.4% (50/678) | Merck, USA | Mouse | MAB | 22C3 |
| Guo | 2017 | Percentage of positive cells and staining intensity | IRS ≥3 | 61.7% (79/128) | Abcam, UK | Rabbit | PAB | ab58810 |
| Zhou | 2017 | Percentage of positive cells and staining intensity | H-score ≥1 | 40.7% (44/108) | Cell Signaling, USA | Rabbit | MAB | E1L3N |
| Ji | 2017 | Percentage of positive cells and staining intensity | >5% and staining intensity ≥2 | 40% (40/100) | Abcam, USA | Mouse | PAB | ab174838 |
| Huynh | 2016 | Percentage of positive cells | ≥5% | 36.5% (95/261) | Cell Signaling, USA | Rabbit | MAB | E1L3N |
| Kim | 2015 | Percentage of positive cells and staining intensity | 2+ or 3+ | 26.9% (89/331) | Cell Signaling, USA | Rabbit | MAB | E1L3N |
| Inoue | 2016 | Percentage of positive cells and staining intensity | H-score ≥5 | 30.7% (201/654) | Cell Signaling, USA | Rabbit | MAB | E1L3N |
| Sorensen | 2016 | Percentage of positive cells | ≥1% | 75% (153/204) | Merck & Co, USA | Mouse | MAB | 22C3 |
| Teng | 2016 | Percentage of positive cells | ≥5% | 19.8% (25/126) | Spring Bioscience, Canada | NA | NA | M4424 |
| Chang | 2016 | Percentage of positive cells | ≥5% | 70.5% (86/122) | Proteintech Group Inc., USA | NA | NA | NA |
| Fang | 2015 | Percentage of positive cells and staining intensity | ≥5% | 74.3% (84/113) | Cell Signaling, USA | Rabbit | MAB | E1L3N |
| Ameratunga | 2016 | Percentage of positive cells | ≥50% | 23.8% (100/420) | Cell Signaling, USA | Rabbit | MAB | E1L3N |
| Ilie | 2016 | NA | NA | 82% (46/56) | Abcam, UK | NA | NA | 28-8 |
| Chen | 2016 | Percentage of positive cells and staining intensity | Allred score ranges 1–8 | 64.6% (31/48) | Abcam, USA | Rabbit | PAB | ab58810 |
| Tsao | 2017 | Percentage of positive cells | ≥1% | 32% (314/982) | Cell Signaling, USA | Rabbit | MAB | E1L3N |
| Hirai | 2017 | Percentage of positive cells | ≥5% | 16.0% (15/94) | Cell Signaling, Japan | Rabbit | MAB | E1L3N |
| Yang | 2017 | Percentage of positive cells | ≥5% | 39.9% (71/178) | Cell Signaling, USA | Rabbit | MAB | E1L3N |
| Azuma | 2014 | Percentage of positive cells and staining intensity | H-score >30 | 50% (82/164) | Lifespan Biosciences, USA | Rabbit | PAB | NA |
| Uruga | 2017 | Percentage of positive cells | ≥1% | 51.4% (56/109) | Cell Signaling, USA | Rabbit | MAB | E1L3N |
Correlation between PD-L1 expression and prognosis
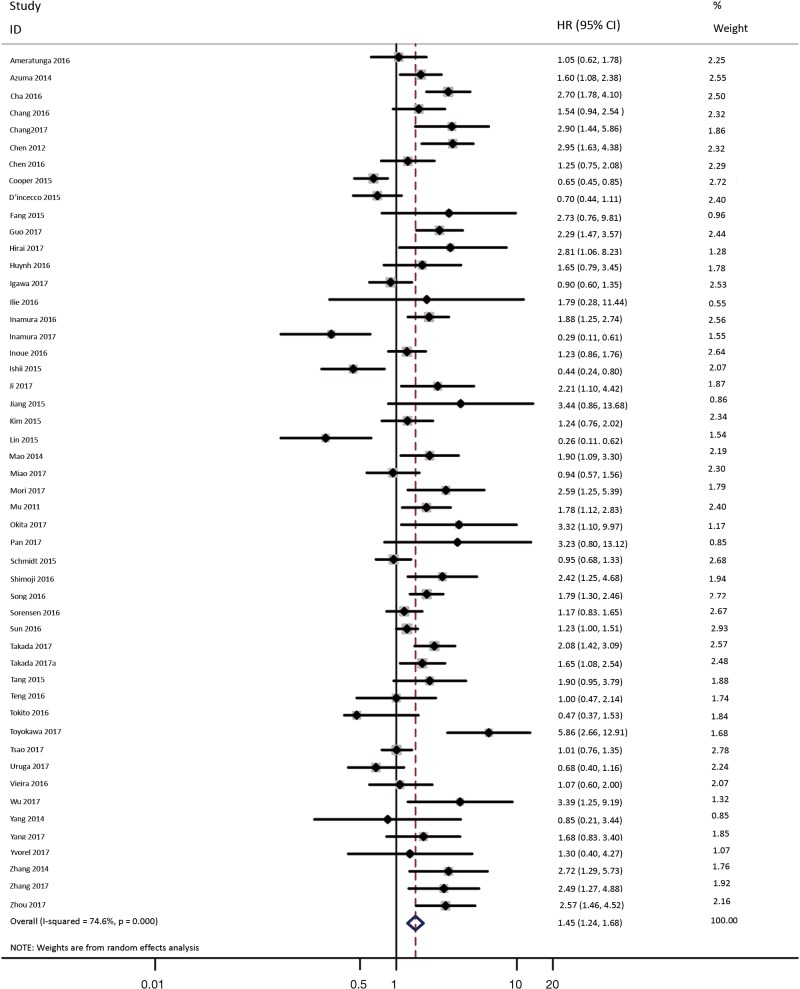
As shown in Figure 2, all 50 studies, comprising 11,383 patients, assessed the correlation between PD-L1 expression and OS. The pooled results (HR =1.45, 95% CI: 1.24–1.68) revealed that the overexpression of PD-L1 exhibited shorter OS in lung cancer, with a 45% increase in the risk for mortality. Meanwhile, a random-effects model was applied for this analysis, as significant heterogeneity was observed (P=0.000, I2=74.6%).
Figure 2.
Forest plot describing the association between PD-L1 expression and OS of patients with lung cancer.
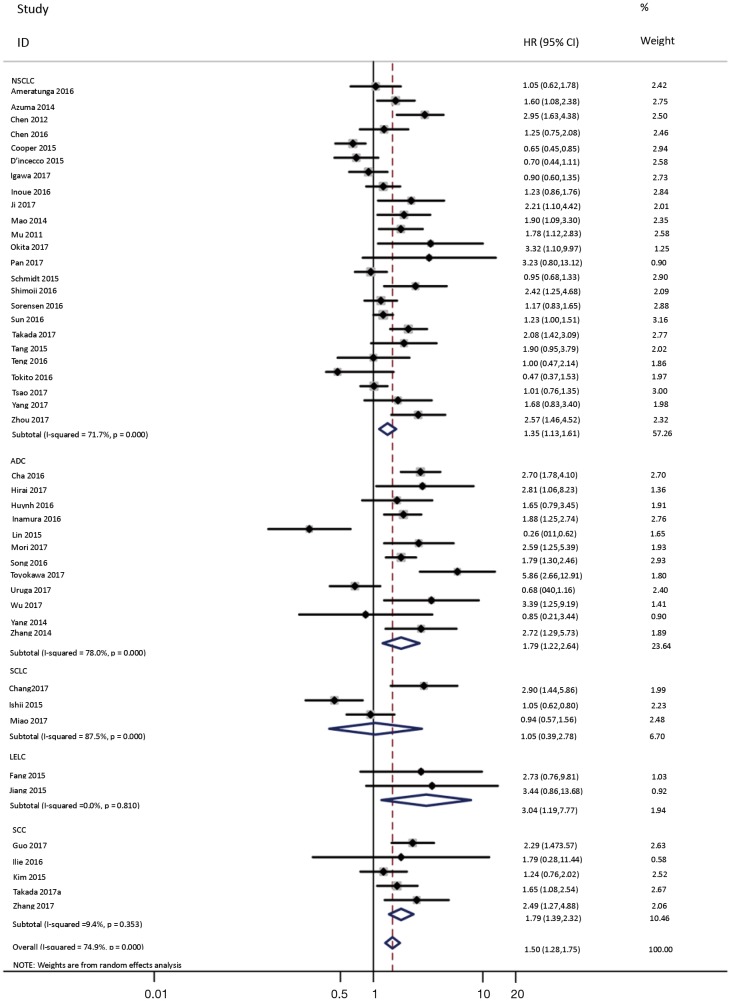
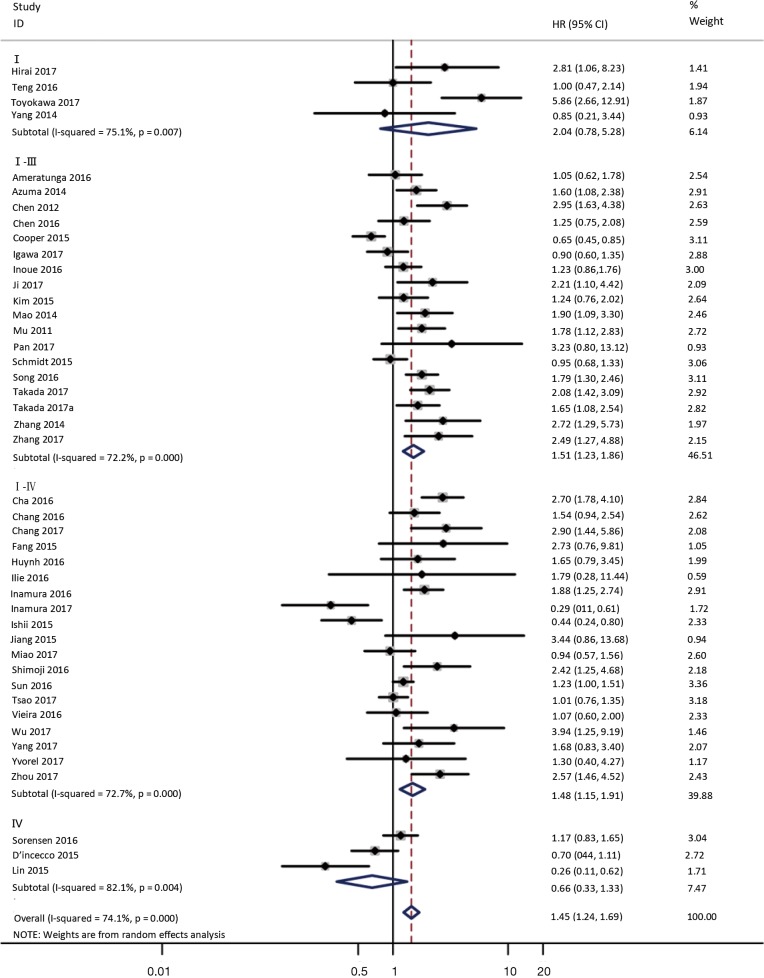
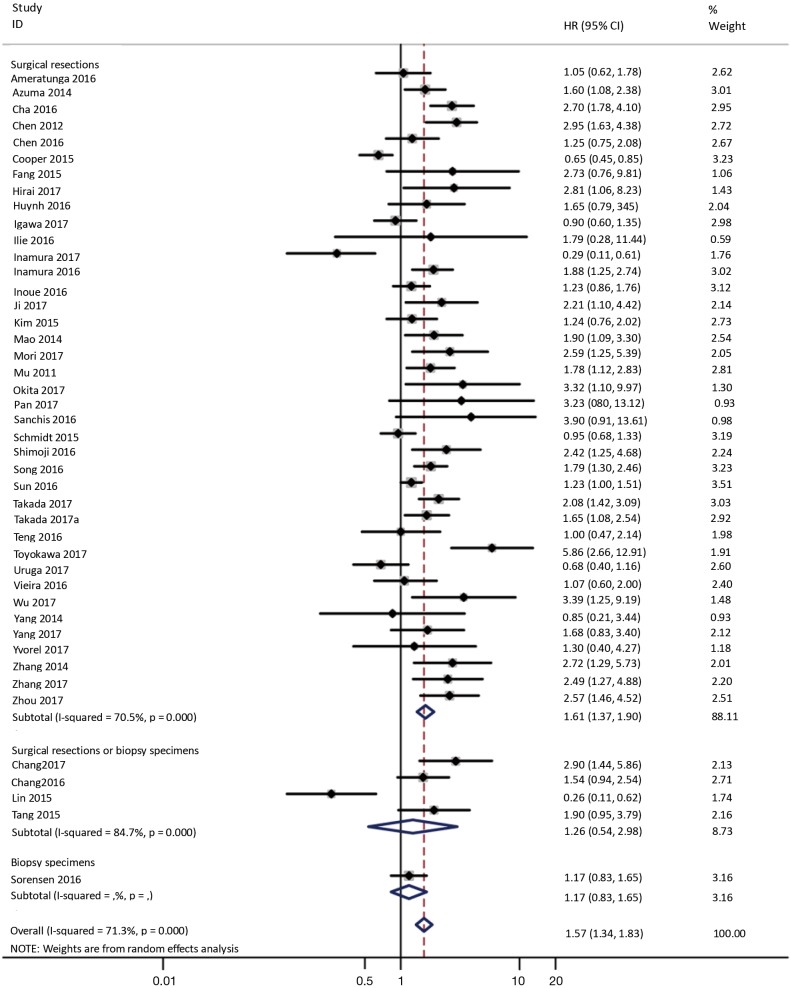
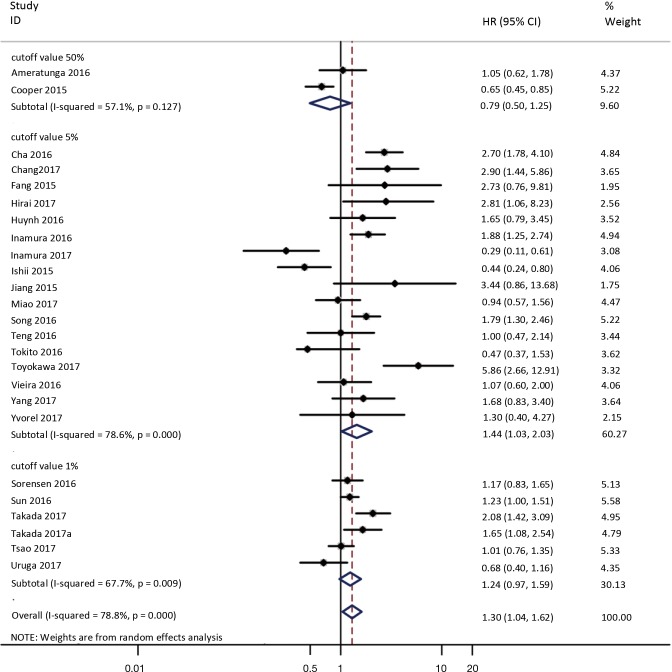
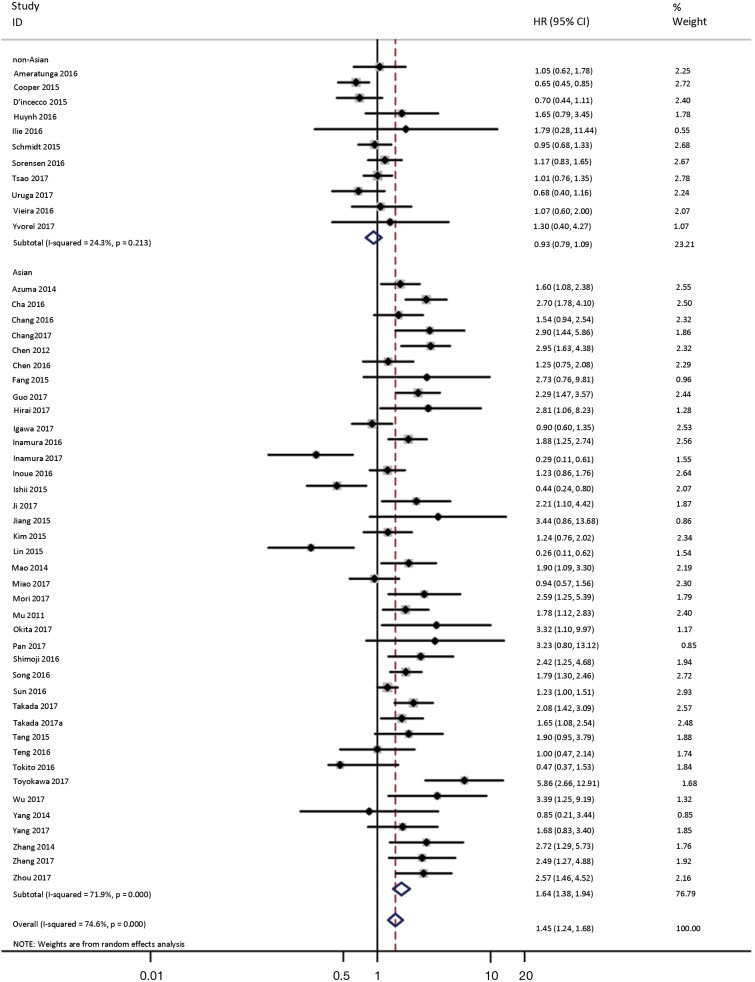
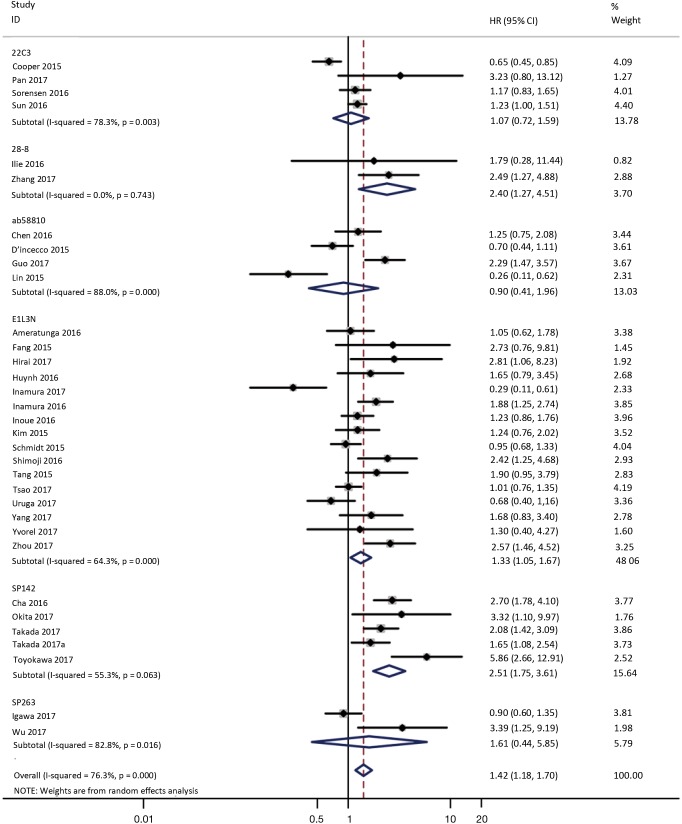
To investigate the sources of heterogeneity, subgroup analyses for OS were performed according to histology, TNM stage, sample type, cutoff value, ethnicity and PD-L1 IHC assay. Subgroup analyses according to histology revealed high PD-L1 expression significantly reduced the OS of NSCLC patients (HR =1.35, 95% CI: 1.13–1.61), ADC patients (HR =1.79, 95% CI: 1.22–2.64), SCC patients (HR =1.79, 95% CI: 1.39–2.32), and LELC patients (HR =3.04, 95% CI: 1.19–7.77), but there was no association of PD-L1 expression with survival in SCLC patients (HR =1.05, 95% CI: 0.39–2.78) (Figure 3). Moreover, subgroup analyses based on TNM stage showed that increased PD-L1 expression was negatively relevant to OS for lung cancer patients in stage I–IV (HR =1.48, 95% CI: 1.15–1.91). To further examine the effects of the different stages of lung cancer on survival, a subgroup analysis was conducted in patients with stage I–III and stage IV. The results revealed that increased PD-L1 expression was associated with poor prognosis for lung cancer patients in early stage I-III (HR =1.51, 95% CI: 1.23–1.86), but not in advanced stage IV (HR =0.66, 95% CI: 0.33–1.33) (Figure 4). When grouped according to the sample type, the pooled results demonstrated that using resection specimens to detect PD-L1 expression (HR =1.61, 95% CI: 1.37–1.90) was related to worse prognosis, when compared to using resection or biopsy specimens (HR =1.26, 95% CI: 0.54–2.98) and using biopsy specimens (HR =1.17, 95% CI: 0.83–1.65) (Figure 5). Furthermore, subgroup analyses based on cutoff value revealed patients with PD-L1 positive tumors had poor survival if 5% (HR =1.44, 95% CI: 1.03–2.03) was taken as the cutoff value, compared to 1% (HR =1.24, 95% CI: 0.97–1.59) or 50% (HR =0.79, 95% CI: 0.50–1.25) (Figure 6). When grouped by ethnicity, the pooled HRs revealed PD-L1 is a poor prognosis indicator in Asian patients 1.64 (95% CI: 1.38–1.94) compared to in non-Asian patients 0.93 (95% CI: 0.79–1.09) (Figure 7). Moreover, subgroup analyses according to PD-L1 IHC assay indicated that PD-L1 overexpression was associated with shorter OS when the SP142 antibody (HR =2.51, 95% CI: 1.75–3.61), the E1L3N antibody (HR =1.33, 95% CI: 1.05–1.67) or the 28-8 antibody (HR =2.40, 95% CI: 1.27–4.51) was used to assess PD-L1 expression. On the contrary, there was no significant association between PD-L1 expression and survival when ab58810 (HR =0.90, 95% CI: 0.41–1.96), 22C3 (HR =1.07, 95% CI: 0.72–1.59) or SP263 (HR =1.61, 95% CI: 0.44–5.85) antibody was used to assess PD-L1 expression (Figure 8).
Figure 3.
Forest plot describing subgroup analysis of the association between PD-L1 expression and OS according to histology. OS, overall survival.
Figure 4.
Forest plot describing subgroup analysis of the association between PD-L1 expression and OS according to TNM stage. OS, overall survival.
Figure 5.
Forest plot describing subgroup analysis of the association between PD-L1 expression and OS according to sample acquisition method. OS, overall survival.
Figure 6.
Forest plot describing subgroup analysis of the association between PD-L1 expression and OS according to cutoff value. OS, overall survival.
Figure 7.
Forest plot describing subgroup analysis of the association between PD-L1 expression and OS according to ethnicity. OS, overall survival.
Figure 8.
Forest plot describing subgroup analysis of the association between PD-L1 expression and OS according to PD-L1 IHC assay. OS, overall survival; IHC, immunohistochemistry.
Correlation between PD-L1 expression and clinicopathological features
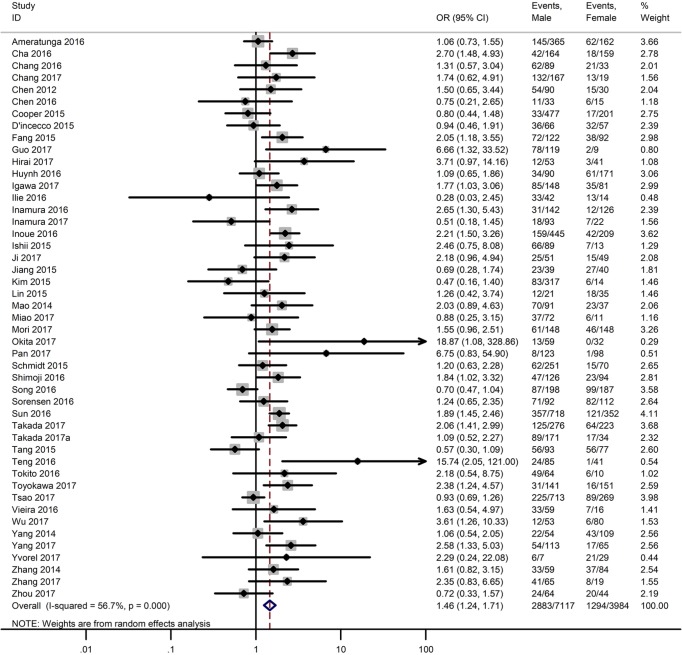
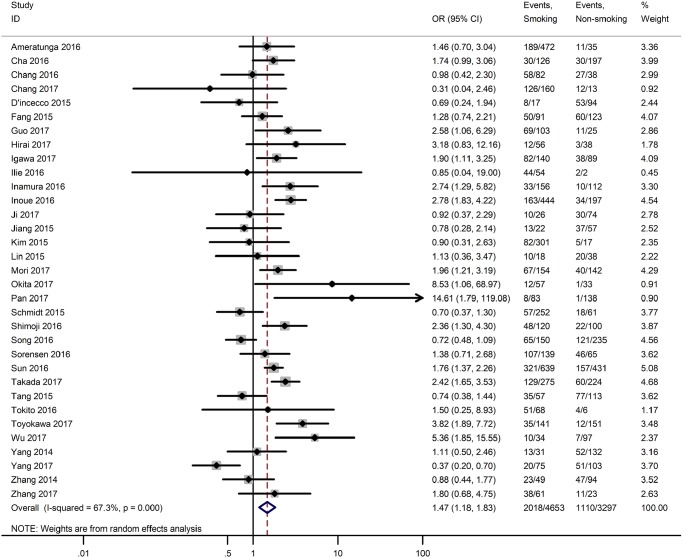
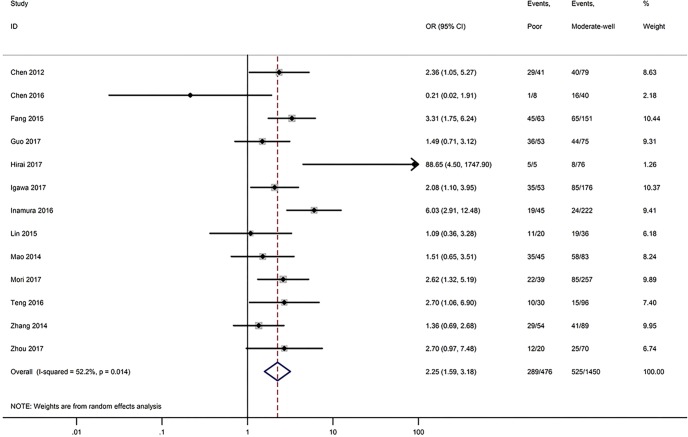
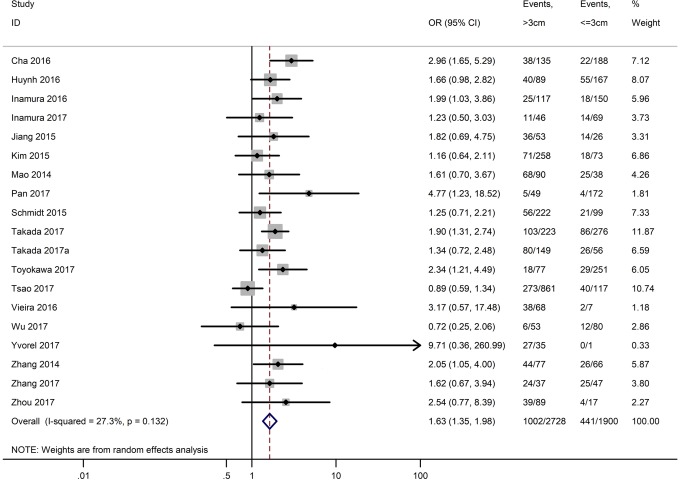
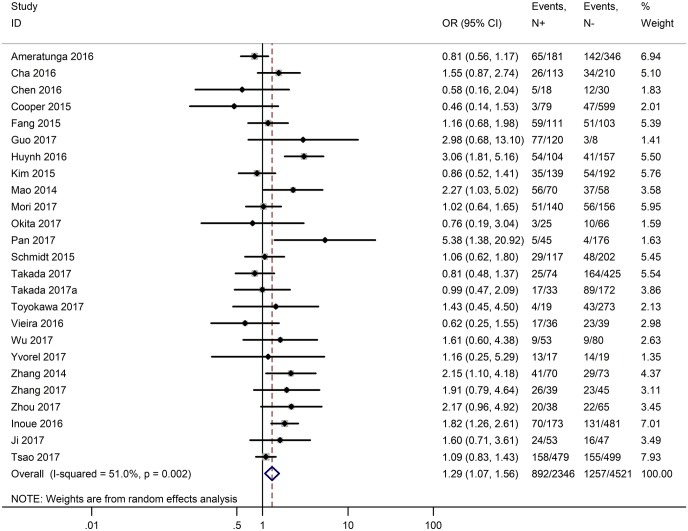
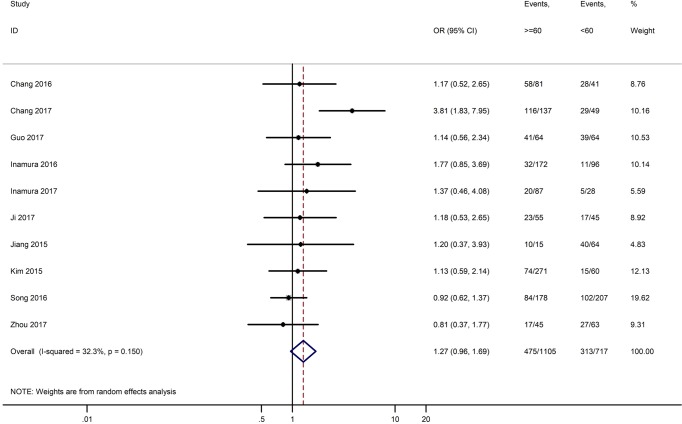
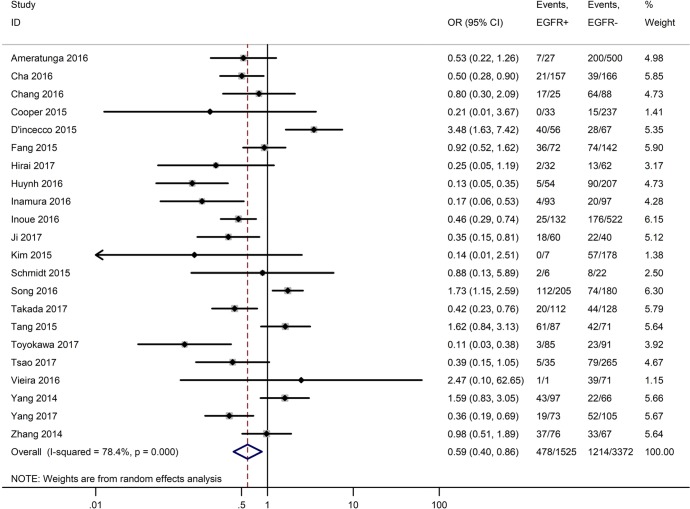
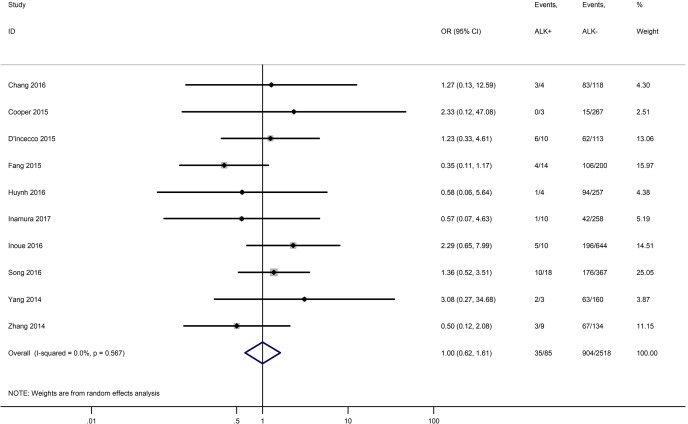
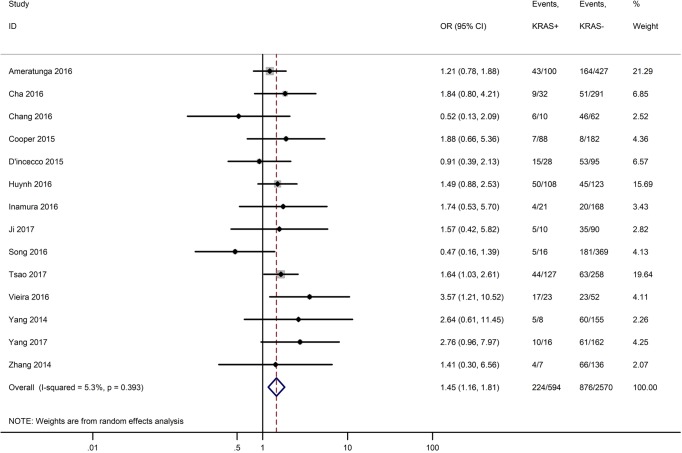
Table 3 shows the main clinicopathological parameters. The combined results revealed that increased PD-L1 expression was associated with a male gender (OR =1.46, 95% CI: 1.24–1.71) (Figure S1), smoking history (OR =1.47, 95% CI: 1.18–1.83) (Figure S2), poor tumor differentiation (OR =2.25, 95% CI: 1.59–3.18) (Figure S3), large tumour size (OR =1.63, 95% CI: 1.35–1.98) (Figure S4), and positive lymph nodal metastasis (OR =1.29, 95% CI: 1.07–1.56) (Figure S5). However, no significant relationship was detected between PD-L1 expression and age (OR =1.27, 95% CI: 0.96–1.69) (Figure S6). To further understand the significance of PD-L1 expression, we also investigated the relevance of the expression of PD-L1 and major driver mutations including EGFR, ALK, and KRAS. In total, 22, 10, and 14 out of 50 studies demonstrated the relationship of PD-L1 expression to EGFR mutations (Figure S7), ALK rearrangements (Figure S8), and KRAS mutations (Figure S9) respectively. The pooled results showed that PD-L1 expression was related to EGFR wild-type status (OR =0.59, 95% CI: 0.40–0.86) and KRAS mutation (OR =1.45, 95% CI: 1.16–1.81), while no associations was identified between PD-L1 expression and ALK rearrangements (OR =1.00, 95% CI: 0.62–1.61). Heterogeneity was observed in the analysis of PD-L1 expression with gender (P=0.000, I2= 56.7%), smoking status (P=0.000, I2=67.3%), tumor differentiation (P=0.014, I2=52.2%), lymph nodal metastasis (P=0.002, I2=51.0%), EGFR mutation (P=0.000, I2=78.4%), so a random-effects model was applied. The other analyses above were conducted using a fixed-effects model.
Table 3. Subgroup analyses of OR for the association between PD-L1 expression and clinicopathological features.
| Clinicopathological features | No. of studies | Heterogeneity | OR (95% CI) | |
|---|---|---|---|---|
| P value | I2 (%) | |||
| Gender (male vs. female) | 47 | 0.000 | 56.70 | 1.46 (1.24–1.71) |
| Smoking status (yes vs. no) | 33 | 0.000 | 67.30 | 1.47 (1.18–1.83) |
| Tumor differentiation (poor vs. moderate-well) | 13 | 0.014 | 52.20 | 2.25 (1.59–3.18) |
| Tumor size (>3 vs. ≤3 cm) | 19 | 0.132 | 27.30 | 1.63 (1.35–1.98) |
| Lymph nodal metastasis (N+ vs. N−) | 25 | 0.002 | 51.00 | 1.29 (1.07–1.56) |
| Age (≥60 vs. <60) | 10 | 0.150 | 32.30 | 1.27 (0.96–1.69) |
| EGFR mutation (EGFR+ vs. EGFR−) | 22 | 0.000 | 78.40 | 0.59 (0.40–0.86) |
| ALK rearrangement (ALK+ vs. ALK−) | 10 | 0.567 | 0.00 | 1.00 (0.62–1.61) |
| KRAS mutation (KRAS+ vs. KRAS−) | 14 | 0.393 | 5.30 | 1.45 (1.16–1.81) |
OR, odds ratio.
Figure S1.
Forest plots for the association between PD-L1 expression and gender.
Figure S2.
Forest plots for the association between PD-L1 expression and smoking status.
Figure S3.
Forest plots for the association between PD-L1 expression and tumor differentiation.
Figure S4.
Forest plots for the association between PD-L1 expression and tumor size.
Figure S5.
Forest plots for the association between PD-L1 expression and lymph nodal metastasis.
Figure S6.
Forest plots for the association between PD-L1 expression and age.
Figure S7.
Forest plots for the association between PD-L1 expression and EGFR mutation.
Figure S8.
Forest plots for the association between PD-L1 expression and ALK rearrangement.
Figure S9.
Forest plots for the association between PD-L1 expression and KRAS mutation.
Publication bias analysis
Begger’s funnel plot was employed to assess the publication bias in this meta-analysis; no publication bias was found in any of the studies, as evidenced by the symmetrical funnel plots (Figure 9).
Figure 9.
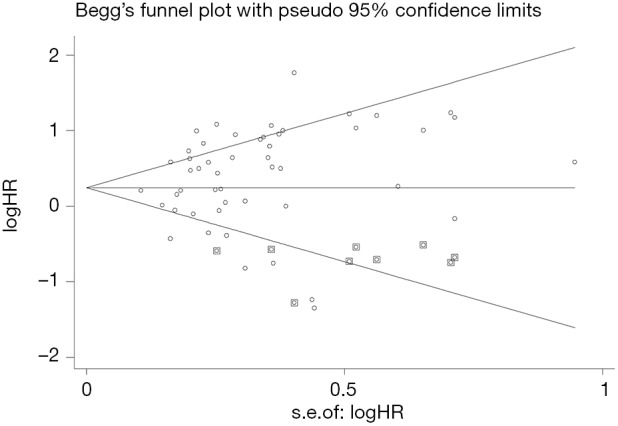
Funnel plots for publication bias.
Discussion
So far, the prognostic significance of PD-L1 expression has attracted much attention with the application of PD-L1/PD-1 inhibitors in NSCLC. Some studies reported that NSCLC patients with high PD-L1 expression had shorter OS when compared to those with negative PD-L1 expression (15,63,64), while other studies showed that PD-L1 expression correlated with better prognosis (59,65). With the emergence of more latest clinical data, we combined 50 eligible studies comprising a total of 11,383 patients to evaluate the relationship between PD-L1 expression level and the prognosis of lung cancer patients.
In our study, the pooled results indicated that increased PD-L1 expression contributed to the poor survival of lung cancer patients, which is consistent with the study of Zhang et al. (64). The results of subgroup analyses revealed that patients with high PD-L1 expression had shorter OS in NSCLC, ADC, SCC and LELC, while no significant difference was observed in SCLC. Furthermore, PD-L1/PD-1 inhibitors have shown improved survival in patients with locally advanced and metastatic NSCLC (66,67). There have also been studies evaluating the use of immunotherapy in early stage of lung cancer (68). Thus, the prognostic significance of PD-L1 expression in the early stage of lung cancer has attracted extensive attention. In our meta-analysis, PD-L1 expression was negatively correlated with the prognosis of NSCLC patients in early stage (I–III) or Asian populations, while it may not serve as a prognostic factor for the survival of stage IV or non-Asian NSCLC patients. Moreover, in the previous meta-analyses, the effects of sample type and the cutoff value of PD-L1 positive expression were not analyzed. As surgical resections and biopsy specimens can be taken from different sites within the tumor, the expression of PD-L1 detected by IHC may also demonstrate heterogeneity. In our study, we found that PD-L1 expression detected by surgical resections was related to worse prognosis, while PD-L1 expression detected by biopsy specimens was not associated with shorter OS. Relative subgroup analyses were also performed to find uniform cutoff values. The pooled results suggested that patients with positive PD-L1 expression had decreased OS when studies used 5% as the cutoff value, while there was no significant difference when studies used 1% or 50% as the cutoff value. We also discovered that positive expression of PD-L1 by the SP142 antibody, the E1L3N antibody or the 28-8 antibody was associated with poor prognosis, while PD-L1 overexpression by the ab58810, 22C3 or SP263 antibody showed no predictive value. This result may be due to the diversity of PD-L1 IHC staining, the sensitivity of the antibody, multiple cut-off standards and different instrument platforms (69-71). As 22C3, 28-8, SP263, SP142 antibodies have been widely used in clinical trials, and recent harmonized studies have found that 22C3, 28-8 and SP263 assays are interchangeable, while SP142 is less sensitive than other assays, we tended to believe that PD-L1 antibody has no association with the prognosis of lung cancer patients. In a word, the conclusions of this subgroup analysis of PD-L1 IHC assay need to be treated with caution, and more clinical studies are needed to verify this view (69,72,73).
The identification of predictive biomarkers for immunotherapy may be valuable for treatment selection and cost saving as well as avoidance of toxicity and quality of time. Several studies have reported that high PD-L1 expression is associated with more clinical benefits in cancer patients treated with anti-PD-1 or anti-PD-L1 monoclonal antibodies (74). It is particularly vital to select patients who will likely benefit from immunotherapy through biomarker assessments and predict the prognosis of the disease in accordance with the goal of the individualized precision medicine. Our study investigated the relationship between PD-L1 expression and clinicopathological parameters, and the pooled results revealed that positive PD-L1 expression was more frequently seen in male, smokers, and patients with poor tumor differentiation, large tumour size, and/or positive lymph nodal metastasis. These patients are more likely to benefit from anti-PD-1/PD-L1 therapy, while the pooled subgroup results indicated no significant correlation between PD-L1 expression and age.
With more and more evidence revealing the relationship between PD-L1 expression and driver oncogene mutations, the association of EGFR mutations and PD-L1 expression in lung cancer is still controversial. Some studies revealed that PD-L1 was highly expressed in patients with EGFR mutations (17), some showed that PD-L1 had a higher positive rate in EGFR wild-type (45), and others indicated no association between PD-L1 expression and EGFR mutations (48). Our analysis showed that high PD-L1 expression was associated with EGFR wild-type. Calles A et al. reported that KRAS mutations were generally identified in NSCLC patients with significant smoking history that may be associated with high tumor mutation burden/a large number of tumor antigens leading to higher PD-L1 expression. In addition, PD-L1 is induced in tumor cells via Th1 pathway activation and IFN-γ secretion, which were associated with inflammatory response induced by smoking (75). Chen et al. (76) stated that PD-L1 was up-regulated by KRAS mutation through p-ERK signaling and KRAS-mediated upregulation of PD-L1 can induce apoptosis of CD3-positive T cells and immune escape in lung ADC cells. Our study observed increased PD-L1 expression was associated with KRAS mutations in lung cancer, which is consistent with the findings above. Moreover, we found no association between increased PD-L1 and ALK rearrangements. In a word, PD-L1 expression may be influenced by both intrinsic and extrinsic/acquired mechanisms and is possibly less stable than genomic changes such as amplification. A recent study has found that structural variation leads to a significant increase of aberrant PD-L1 transcripts (77). The monitoring of biological effects of PD-L1 may take several omics studies.
There are some limitations in our study. First, the number of studies for SCLC, LELC, and metastatic tumors (stage IV) included in this meta-analysis was relatively small. Thus, the prognostic role of PD-L1 expression in these lung cancer subtypes need to be further evaluated in large sample size. Second, different studies used different PD-L1 antibodies, staining methods, and cut-off values that might have affected the PD-L1 IHC results. It is necessary to use a single IHC assay to unify the detection of PD-L1 expression in tumor cells to obtain more accurate results. Third, we did not evaluate the expression of other predictive biomarkers such as PD-L1 expression on infiltrating immune cells in this study. Fourth, in some studies, the HRs and their 95% CIs were estimated from Kaplan-Meier curves as they were not reported directly, which may reduce the accuracy of the results.
Conclusions
Our meta-analysis demonstrated that high PD-L1 expression by IHC was significantly associated with poor OS for patients with lung cancer, especially for Asian patients with surgically resected, early stage I-III tumors and using 5% as the cutoff value. Moreover, positive PD-L1 expression was associated with male, smokers, poor tumor differentiation, large tumor size, positive lymph nodal metastasis, EGFR wild-type status, and KRAS mutations. These results may further help predicting the survival of lung cancer patients and screening appropriate patients for anti-PD-1/PD-L1 treatment.
Acknowledgments
Funding: This work was supported by grants from the National Natural Science Foundation of China (grant number 81401903, 81572937 and 81572273); China Postdoctoral Science Foundation 64th batch (Postdoctoral number: 45786); Jiangsu Provincial Postdoctoral Science Foundation in 2018; the Natural Science Foundation of Jiangsu province (grant number BK20180139 and BK20161386); Jiangsu Provincial Medical Youth Talent (grant number QNRC2016125), and the Nanjing Medical Science and Technology Development Project (No. ZKX17044), the Jiangsu Provincial Key Research and Development Program (No. BE2016721). The authors would like to thank Mari Mino-Kenudson at Massachusetts General Hospital, Boston, USA, for critical review of the manuscript.
Ethical Statement: The authors are accountable for all aspects of the work in ensuring that questions related to the accuracy or integrity of any part of the work are appropriately investigated and resolved.
Footnotes
Conflicts of Interest: The authors have no conflicts of interest to declare.
References
- 1.Siegel RL, Miller KD, Jemal A. Cancer statistics, 2018. CA Cancer J Clin 2018,68:7-30. 10.3322/caac.21442 [DOI] [PubMed] [Google Scholar]
- 2.Chen W, Zheng R, Baade PD, et al. Cancer statistics in China, 2015. CA Cancer J Clin 2016,66:115-32. 10.3322/caac.21338 [DOI] [PubMed] [Google Scholar]
- 3.Miller KD, Siegel RL, Lin CC, et al. Cancer treatment and survivorship statistics, 2016. CA Cancer J Clin 2016,66:271-89. 10.3322/caac.21349 [DOI] [PubMed] [Google Scholar]
- 4.Paesmans M, Sculier JP, Libert P, et al. Prognostic factors for survival in advanced non-small-cell lung cancer: univariate and multivariate analyses including recursive partitioning and amalgamation algorithms in 1,052 patients. The European Lung Cancer Working Party. J Clin Oncol. 1995;13:1221-30. 10.1200/JCO.1995.13.5.1221 [DOI] [PubMed] [Google Scholar]
- 5.Zou W, Wolchok JD, Chen L. PD-L1 (B7-H1) and PD-1 pathway blockade for cancer therapy: Mechanisms, response biomarkers, and combinations. Sci Transl Med 2016;8:328rv4. 10.1126/scitranslmed.aad7118 [DOI] [PMC free article] [PubMed] [Google Scholar]
- 6.Gatalica Z, Snyder C, Maney T, et al. Programmed cell death 1 (PD-1) and its ligand (PD-L1) in common cancers and their correlation with molecular cancer type. Cancer Epidemiol Biomarkers Prev 2014;23:2965-70. 10.1158/1055-9965.EPI-14-0654 [DOI] [PubMed] [Google Scholar]
- 7.Ameratunga M, Asadi K, Lin X, et al. PD-L1 and Tumor Infiltrating Lymphocytes as Prognostic Markers in Resected NSCLC. PLoS One 2016;11:e0153954. 10.1371/journal.pone.0153954 [DOI] [PMC free article] [PubMed] [Google Scholar]
- 8.Topalian SL, Taube JM, Anders RA, et al. Mechanism-driven biomarkers to guide immune checkpoint blockade in cancer therapy. Nature Reviews Cancer 2016,16:275-87. 10.1038/nrc.2016.36 [DOI] [PMC free article] [PubMed] [Google Scholar]
- 9.Ma W, Gilligan BM, Yuan J, et al. Current status and perspectives in translational biomarker research for PD-1/PD-L1 immune checkpoint blockade therapy. J Hematol Oncol 2016;9:47. 10.1186/s13045-016-0277-y [DOI] [PMC free article] [PubMed] [Google Scholar]
- 10.Parmar MK, Torri V, Stewart L. Extracting summary statistics to perform meta-analyses of the published literature for survival endpoints. Stat Med. 1998;17:2815-34. [DOI] [PubMed] [Google Scholar]
- 11.Stang A. Critical evaluation of the Newcastle-Ottawa scale for the assessment of the quality of nonrandomized studies in meta-analyses. Eur J Epidemiol 2010;25:603-5. 10.1007/s10654-010-9491-z [DOI] [PubMed] [Google Scholar]
- 12.Higgins JP, Thompson SG, Deeks JJ, et al. Measuring inconsistency in meta-analyses. BMJ 2003,327:557-60. 10.1136/bmj.327.7414.557 [DOI] [PMC free article] [PubMed] [Google Scholar]
- 13.Begg CB, Mazumdar M. Operating characteristics of a rank correlation test for publication bias. Biometrics. 1994,50:1088-101. 10.2307/2533446 [DOI] [PubMed] [Google Scholar]
- 14.Mu CY, Huang JA, Chen Y, et al. High expression of PD-L1 in lung cancer may contribute to poor prognosis and tumor cells immune escape through suppressing tumor infiltrating dendritic cells maturation. Med Oncol 2011;28:682-8. 10.1007/s12032-010-9515-2 [DOI] [PubMed] [Google Scholar]
- 15.Chen YB, Mu CY, Huang JA. Clinical significance of programmed death-1 ligand-1 expression in patients with non-small cell lung cancer: a 5-year-follow-up study. Tumori 2012;98:751-5. 10.1177/030089161209800612 [DOI] [PubMed] [Google Scholar]
- 16.Azuma K, Ota K, Kawahara A, et al. Association of PD-L1 overexpression with activating EGFR mutations in surgically resected non small-cell lung cancer. Ann Oncol 2014;25:1935-40. 10.1093/annonc/mdu242 [DOI] [PubMed] [Google Scholar]
- 17.D'Incecco A, Andreozzi M, Ludovini V, et al. PD-1 and PD-L1 expression in molecularly selected non-small-cell lung cancer patients. Br J Cancer 2015;112:95-102. 10.1038/bjc.2014.555 [DOI] [PMC free article] [PubMed] [Google Scholar]
- 18.Mao Y, Li W, Chen K, et al. B7-H1 and B7-H3 are independent predictors of poor prognosis in patients with non-small cell lung cancer. Oncotarget 2015;6:3452-61. 10.18632/oncotarget.3097 [DOI] [PMC free article] [PubMed] [Google Scholar]
- 19.Cooper WA, Tran T, Vilain RE, et al. PD-L1 expression is a favorable prognostic factor in early stage non-small cell carcinoma. Lung Cancer 2015;89:181-8. 10.1016/j.lungcan.2015.05.007 [DOI] [PubMed] [Google Scholar]
- 20.Schmidt LH, Kümmel A, Görlich D, et al. PD-1 and PD-L1 Expression in NSCLC Indicate a Favorable Prognosis in Defined Subgroups. PLoS One 2015;10:e0136023. 10.1371/journal.pone.0136023 [DOI] [PMC free article] [PubMed] [Google Scholar]
- 21.Tang Y, Fang W, Zhang Y, et al. The association between PD-L1 and EGFR status and the prognostic value of PD-L1 in advanced non-small cell lung cancer patients treated with EGFR-TKIs. Oncotarget 2015;6:14209-19. 10.18632/oncotarget.3694 [DOI] [PMC free article] [PubMed] [Google Scholar]
- 22.Chen Z, Mei J, Liu L, et al. PD-L1 expression is associated with advanced non-small cell lung cancer. Oncol Lett 2016;12:921-7. 10.3892/ol.2016.4741 [DOI] [PMC free article] [PubMed] [Google Scholar]
- 23.Inoue Y, Yoshimura K, Mori K, et al. Clinical significance of PD-L1 and PD-L2 copy number gains in non-small-cell lung cancer. Oncotarget 2016;7:32113-28. 10.18632/oncotarget.8528 [DOI] [PMC free article] [PubMed] [Google Scholar]
- 24.Ji M, Liu Y, Li Q, et al. PD-1/PD-L1 expression in non-small-cell lung cancer and its correlation with EGFR/KRAS mutations. Cancer Biol Ther 2016;17:407-13. 10.1080/15384047.2016.1156256 [DOI] [PMC free article] [PubMed] [Google Scholar]
- 25.Shimoji M, Shimizu S, Sato K, et al. Clinical and pathologic features of lung cancer expressing programmed cell death ligand 1 (PD-L1). Lung Cancer 2016;98:69-75. 10.1016/j.lungcan.2016.04.021 [DOI] [PubMed] [Google Scholar]
- 26.Sorensen SF, Zhou W, Dolled-Filhart M, et al. PD-L1 Expression and Survival among Patients with Advanced Non-Small Cell Lung Cancer Treated with Chemotherapy. Transl Oncol 2016;9:64-9. 10.1016/j.tranon.2016.01.003 [DOI] [PMC free article] [PubMed] [Google Scholar]
- 27.Sun JM, Zhou W, Choi YL, et al. Prognostic Significance of PD-L1 in Patients with Non-Small Cell Lung Cancer: A Large Cohort Study of Surgically Resected Cases. J Thorac Oncol 2016;11:1003-11. 10.1016/j.jtho.2016.04.007 [DOI] [PubMed] [Google Scholar]
- 28.Teng F, Meng X, Wang X, et al. Expressions of CD8+TILs, PD-L1 and Foxp3+TILs in stage I NSCLC guiding adjuvant chemotherapy decisions. Oncotarget 2016;7:64318-29. 10.18632/oncotarget.11793 [DOI] [PMC free article] [PubMed] [Google Scholar]
- 29.Tokito T, Azuma K, Kawahara A, et al. Predictive relevance of PD-L1 expression combined with CD8+ TIL density in stage III non-small cell lung cancer patients receiving concurrent chemoradiotherapy. Eur J Cancer 2016;55:7-14. 10.1016/j.ejca.2015.11.020 [DOI] [PubMed] [Google Scholar]
- 30.Igawa S, Sato Y, Ryuge S, et al. Impact of PD-L1 Expression in Patients with Surgically Resected Non-Small-Cell Lung Cancer. Oncology 2017;92:283-90. 10.1159/000458412 [DOI] [PubMed] [Google Scholar]
- 31.Okita R, Maeda A, Shimizu K, et al. PD-L1 overexpression is partially regulated by EGFR/HER2 signaling and associated with poor prognosis in patients with non-small-cell lung cancer. Cancer Immunol Immunother 2017;66:865-76. 10.1007/s00262-017-1986-y [DOI] [PMC free article] [PubMed] [Google Scholar]
- 32.Pan Y, Zheng D, Li Y, et al. Unique distribution of programmed death ligand 1 (PD-L1) expression in East Asian non-small cell lung cancer. J Thorac Dis 2017;9:2579-86. 10.21037/jtd.2017.08.61 [DOI] [PMC free article] [PubMed] [Google Scholar]
- 33.Takada K, Toyokawa G, Okamoto T, et al. A Comprehensive Analysis of Programmed Cell Death Ligand-1 Expression With the Clone SP142 Antibody in Non-Small-Cell Lung Cancer Patients. Clin Lung Cancer 2017;18:572-582.e1. 10.1016/j.cllc.2017.02.004 [DOI] [PubMed] [Google Scholar]
- 34.Tsao MS, Le Teuff G, Shepherd FA, et al. PD-L1 protein expression assessed by immunohistochemistry is neither prognostic nor predictive of benefit from adjuvant chemotherapy in resected non-small cell lung cancer. Ann Oncol 2017;28:882-9. [DOI] [PMC free article] [PubMed] [Google Scholar]
- 35.Zhou C, Tang J, Sun H, et al. PD-L1 expression as poor prognostic factor in patients with non-squamous non-small cell lung cancer. Oncotarget 2017;8:58457-68. [DOI] [PMC free article] [PubMed] [Google Scholar]
- 36.Yang H, Shi J, Lin D, et al. Prognostic value of PD-L1 expression in combination with CD8+TILs density in patients with surgically resected non-small cell lung cancer. Cancer Med 2018;7:32-45. 10.1002/cam4.1243 [DOI] [PMC free article] [PubMed] [Google Scholar]
- 37.Yang CY, Lin MW, Chang YL, et al. Programmed cell death-ligand 1 expression in surgically resected stage I pulmonary adenocarcinoma and its correlation with driver mutations and clinical outcomes. Eur J Cancer 2014;50:1361-9. 10.1016/j.ejca.2014.01.018 [DOI] [PubMed] [Google Scholar]
- 38.Zhang Y, Wang L, Li Y, et al. Protein expression of programmed death 1 ligand 1 and ligand 2 independently predict poor prognosis in surgically resected lung adenocarcinoma. Onco Targets Ther 2014;7:567-73. 10.2147/OTT.S59959 [DOI] [PMC free article] [PubMed] [Google Scholar]
- 39.Lin C, Chen X, Li M, et al. Programmed Death-Ligand 1 Expression Predicts Tyrosine Kinase Inhibitor Response and Better Prognosis in a Cohort of Patients With Epidermal Growth Factor Receptor Mutation-Positive Lung Adenocarcinoma. Clin Lung Cancer 2015;16:e25-35. 10.1016/j.cllc.2015.02.002 [DOI] [PubMed] [Google Scholar]
- 40.Cha YJ, Kim HR, Lee CY, et al. Clinicopathological and prognostic significance of programmed cell death ligand-1 expression in lung adenocarcinoma and its relationship with p53 status. Lung Cancer 2016;97:73-80. 10.1016/j.lungcan.2016.05.001 [DOI] [PubMed] [Google Scholar]
- 41.Huynh TG, Morales-Oyarvide V, Campo MJ, et al. Programmed Cell Death Ligand 1 Expression in Resected Lung Adenocarcinomas: Association with Immune Microenvironment. J Thorac Oncol 2016;11:1869-78. 10.1016/j.jtho.2016.08.134 [DOI] [PubMed] [Google Scholar]
- 42.Inamura K, Yokouchi Y, Sakakibara R, et al. Relationship of tumor PD-L1 expression with EGFR wild-type status and poor prognosis in lung adenocarcinoma. Jpn J Clin Oncol 2016;46:935-41. 10.1093/jjco/hyw087 [DOI] [PubMed] [Google Scholar]
- 43.Song Z, Yu X, Cheng G, et al. Programmed death-ligand 1 expression associated with molecular characteristics in surgically resected lung adenocarcinoma. J Transl Med 2016;14:188. 10.1186/s12967-016-0943-4 [DOI] [PMC free article] [PubMed] [Google Scholar]
- 44.Mori S, Motoi N, Ninomiya H, et al. High expression of programmed cell death 1 ligand 1 in lung adenocarcinoma is a poor prognostic factor particularly in smokers and wild-type epidermal growth-factor receptor cases. Pathol Int 2017;67:37-44. 10.1111/pin.12489 [DOI] [PubMed] [Google Scholar]
- 45.Toyokawa G, Takada K, Okamoto T, et al. Relevance Between Programmed Death Ligand 1 and Radiologic Invasiveness in Pathologic Stage I Lung Adenocarcinoma. Ann Thorac Surg 2017;103:1750-7. 10.1016/j.athoracsur.2016.12.025 [DOI] [PubMed] [Google Scholar]
- 46.Uruga H, Bozkurtlar E, Huynh TG, et al. Programmed Cell Death Ligand (PD-L1) Expression in Stage II and III Lung Adenocarcinomas and Nodal Metastases. J Thorac Oncol 2017;12:458-66. 10.1016/j.jtho.2016.10.015 [DOI] [PubMed] [Google Scholar]
- 47.Wu S, Shi X, Sun J, et al. The significance of programmed cell death ligand 1 expression in resected lung adenocarcinoma. Oncotarget 2017;8:16421-9. [DOI] [PMC free article] [PubMed] [Google Scholar]
- 48.Hirai A, Yoneda K, Shimajiri S, et al. Prognostic impact of programmed death-ligand 1 expression in correlation with human leukocyte antigen class I expression status in stage I adenocarcinoma of the lung. J Thorac Cardiovasc Surg 2018;155:382-392.e1. 10.1016/j.jtcvs.2017.05.106 [DOI] [PubMed] [Google Scholar]
- 49.Kim MY, Koh J, Kim S, et al. Clinicopathological analysis of PD-L1 and PD-L2 expression in pulmonary squamous cell carcinoma: Comparison with tumor-infiltrating T cells and the status of oncogenic drivers. Lung Cancer 2015;88:24-33. 10.1016/j.lungcan.2015.01.016 [DOI] [PubMed] [Google Scholar]
- 50.Ilie M, Falk AT, Butori C, et al. PD-L1 expression in basaloid squamous cell lung carcinoma: Relationship to PD-1+ and CD8+ tumor-infiltrating T cells and outcome. Mod Pathol 2016;29:1552-64. 10.1038/modpathol.2016.149 [DOI] [PubMed] [Google Scholar]
- 51.Guo Q, Sun Y, Yu S, et al. Programmed cell death-ligand 1 (PD-L1) expression and fibroblast growth factor receptor 1 (FGFR1) amplification in stage III/IV lung squamous cell carcinoma (SQC). Thorac Cancer 2017;8:73-9. 10.1111/1759-7714.12399 [DOI] [PMC free article] [PubMed] [Google Scholar]
- 52.Takada K, Okamoto T, Toyokawa G, et al. The expression of PD-L1 protein as a prognostic factor in lung squamous cell carcinoma. Lung Cancer 2017;104:7-15. 10.1016/j.lungcan.2016.12.006 [DOI] [PubMed] [Google Scholar]
- 53.Zhang M, Wang D, Sun Q, et al. Prognostic significance of PD-L1 expression and 18F-FDG PET/CT in surgical pulmonary squamous cell carcinoma. Oncotarget 2017,8:51630-40. [DOI] [PMC free article] [PubMed] [Google Scholar]
- 54.Ishii H, Azuma K, Kawahara A, et al. Significance of programmed cell death-ligand 1 expression and its association with survival in patients with small cell lung cancer. J Thorac Oncol 2015;10:426-30. 10.1097/JTO.0000000000000414 [DOI] [PubMed] [Google Scholar]
- 55.Chang YL, Yang CY, Huang YL, et al. High PD-L1 expression is associated with stage IV disease and poorer overall survival in 186 cases of small cell lung cancers. Oncotarget 2017;8:18021-30. [DOI] [PMC free article] [PubMed] [Google Scholar]
- 56.Miao L, Lu Y, Xu Y, et al. PD-L1 and c-MET expression and survival in patients with small cell lung cancer. Oncotarget 2017;8:53978-88. [DOI] [PMC free article] [PubMed] [Google Scholar]
- 57.Fang W, Hong S, Chen N, et al. PD-L1 is remarkably over-expressed in EBV-associated pulmonary lymphoepithelioma-like carcinoma and related to poor disease-free survival. Oncotarget 2015;6:33019-32. 10.18632/oncotarget.5028 [DOI] [PMC free article] [PubMed] [Google Scholar]
- 58.Jiang L, Wang L, Li PF, et al. Positive expression of programmed death ligand-1 correlates with superior outcomes and might be a therapeutic target in primary pulmonary lymphoepithelioma-like carcinoma. Onco Targets Ther 2015; 8:1451-7. [DOI] [PMC free article] [PubMed] [Google Scholar]
- 59.Vieira T, Antoine M, Hamard C, et al. Sarcomatoid lung carcinomas show high levels of programmed death ligand-1 (PD-L1) and strong immune-cell infiltration by TCD3 cells and macrophages. Lung Cancer 2016; 98:51-58. 10.1016/j.lungcan.2016.05.013 [DOI] [PubMed] [Google Scholar]
- 60.Inamura K, Yokouchi Y, Kobayashi M, et al. Relationship of tumor PD-L1 (CD274) expression with lower mortality in lung high-grade neuroendocrine tumor. Cancer Med 2017;6:2347-56. 10.1002/cam4.1172 [DOI] [PMC free article] [PubMed] [Google Scholar]
- 61.Chang YL, Yang CY, Lin MW, et al. High co-expression of PD-L1 and HIF-1α correlates with tumour necrosis in pulmonary pleomorphic carcinoma. Eur J Cancer 2016;60:125-35. 10.1016/j.ejca.2016.03.012 [DOI] [PubMed] [Google Scholar]
- 62.Yvorel V, Patoir A, Casteillo F, et al. PD-L1 expression in pleomorphic, spindle cell and giant cell carcinoma of the lung is related to TTF-1, p40 expression and might indicate a worse prognosis. PLoS One 2017;12:e0180346. 10.1371/journal.pone.0180346 [DOI] [PMC free article] [PubMed] [Google Scholar]
- 63.Pan ZK, Ye F, Wu X, et al. Clinicopathological and prognostic significance of programmed cell death ligand1 (PD-L1) expression in patients with non-small cell lung cancer: a meta-analysis. J Thorac Dis 2015;7:462-70. [DOI] [PMC free article] [PubMed] [Google Scholar]
- 64.Zhang M, Li G, Wang Y, et al. PD-L1 expression in lung cancer and its correlation with driver mutations: a meta-analysis. Sci Rep 2017;7:10255. 10.1038/s41598-017-10925-7 [DOI] [PMC free article] [PubMed] [Google Scholar]
- 65.Yang CY, Lin MW, Chang YL, et al. Programmed cell death-ligand 1 expression is associated with a favourable immune microenvironment and better overall survival in stage I pulmonary squamous cell carcinoma. Eur J Cancer 2016;57:91-103. 10.1016/j.ejca.2015.12.033 [DOI] [PubMed] [Google Scholar]
- 66.Herbst RS, Baas P, Kim DW, et al. Pembrolizumab versus docetaxel for previously treated, PD-L1-positive, advanced non-small-cell lung cancer (KEYNOTE-010): a randomised controlled trial. Lancet 2016;387:1540-50. 10.1016/S0140-6736(15)01281-7 [DOI] [PubMed] [Google Scholar]
- 67.Langer CJ, Gadgeel SM, Borghaei H, et al. Carboplatin and pemetrexed with or without pembrolizumab for advanced, non-squamous non-small-cell lung cancer: a randomised, phase 2 cohort of the open-label KEYNOTE-021 study. Lancet Oncol 2016;17:1497-508. 10.1016/S1470-2045(16)30498-3 [DOI] [PMC free article] [PubMed] [Google Scholar]
- 68.Ghysen K, Vansteenkiste J. Immunotherapy in patients with early stage resectable nonsmall cell lung cancer. Curr Opin Oncol 2019;31:13-7. [DOI] [PubMed] [Google Scholar]
- 69.Ancevski Hunter K, Socinski MA, Villaruz LC. PD-L1 Testing in Guiding Patient Selection for PD-1/PD-L1 Inhibitor Therapy in Lung Cancer. Mol Diagn Ther 2018;22:1-10. 10.1007/s40291-017-0308-6 [DOI] [PMC free article] [PubMed] [Google Scholar]
- 70.Ma J, Li J, Qian M, et al. PD-L1 expression and the prognostic significance in gastric cancer: a retrospective comparison of three PD-L1 antibody clones (SP142, 28-8 and E1L3N). Diagn Pathol 2018;13:91. 10.1186/s13000-018-0766-0 [DOI] [PMC free article] [PubMed] [Google Scholar]
- 71.Mahoney KM, Sun H, Liao X, et al. PD-L1 Antibodies to Its Cytoplasmic Domain Most Clearly Delineate Cell Membranes in Immunohistochemical Staining of Tumor Cells. Cancer Immunol Res 2015;3:1308-15. 10.1158/2326-6066.CIR-15-0116 [DOI] [PMC free article] [PubMed] [Google Scholar]
- 72.Tsao MS, Kerr KM, Kockx M, et al. PD-L1 Immunohistochemistry Comparability Study in Real-Life Clinical Samples: Results of Blueprint Phase 2 Project. J Thorac Oncol 2018;13:1302-11. 10.1016/j.jtho.2018.05.013 [DOI] [PMC free article] [PubMed] [Google Scholar]
- 73.Chan AWH, Tong JHM, Kwan JSH, et al. Assessment of programmed cell death ligand-1 expression by 4 diagnostic assays and its clinicopathological correlation in a large cohort of surgical resected non-small cell lung carcinoma. Mod Pathol 2018;31:1381-90. 10.1038/s41379-018-0053-3 [DOI] [PubMed] [Google Scholar]
- 74.Meng X, Huang Z, Teng F, et al. Predictive biomarkers in PD-1/PD-L1 checkpoint blockade immunotherapy. Cancer Treatment Reviews 2015;41:868-76. 10.1016/j.ctrv.2015.11.001 [DOI] [PubMed] [Google Scholar]
- 75.Calles A, Liao X, Sholl LM, et al. Expression of PD-1 and Its Ligands, PD-L1 and PD-L2, in Smokers and Never Smokers with KRAS-Mutant Lung Cancer. J Thorac Oncol 2015;10:1726-35. 10.1097/JTO.0000000000000687 [DOI] [PubMed] [Google Scholar]
- 76.Chen N, Fang W, Lin Z, et al. KRAS mutation-induced upregulation of PD-L1 mediates immune escape in human lung adenocarcinoma. Cancer Immunol Immunother 2017;66:1175-87. 10.1007/s00262-017-2005-z [DOI] [PMC free article] [PubMed] [Google Scholar]
- 77.Kataoka K, Shiraishi Y, Takeda Y, et al. Aberrant PD-L1 expression through 3'-UTR disruption in multiple cancers. Nature 2016;534:402-6. 10.1038/nature18294 [DOI] [PubMed] [Google Scholar]


