Abstract
Multi-wavelength photoplethysmography (MW-PPG) sensing technology has been known to be superior to signal-wavelength photoplethysmography (SW-PPG) sensing technology. However, limited by the availability of sensing detectors, many prior studies can only use conventional bulky and pricy spectrometers as the detectors, and hence cannot bring the MW-PPG technology to daily-life applications. In this study we developed a chip-scale MW-PPG sensor using innovative on-chip spectrometers, aimed at wearable applications. Also in this paper we present signal processing methods for robustly extracting the PPG signals, in which an increase of up to 50% in the signal-to-noise ratio (S/N) was observed. Example measurements of saturation of peripheral blood oxygen (SpO2) and blood pressure were conducted.
Keywords: multi-wavelengths, MW-PPG, on-chip spectrometers
1. Introduction
Photoplethysmography (PPG) has been a commonly-used optical sensing method that collects light reflected or transmitted through skin so as to noninvasively monitor the pulsation of blood flow in subcutaneous blood vessels. Since blood flow pulsations can reflect the operating conditions of the circulatory and respiratory systems of the human body, PPG signals can be used as indicators for many diseases, such as endothelial dysfunction, sympathetic neuropathy, cardiac arrhythmia, vasospasm, microcirculation, autonomic neuropathy, orthostatic hypotension, migraine, and peripheral artery disease [1,2,3,4]. Due to the simple measurement structure, PPG sensing technology has been widely used in wearable devices to achieve heart rate detection in recent years [5,6,7,8,9,10]. In 2018, the penetration rate of PPG sensing technology in wearable devices reached 98% and it is expected to reach 100% by 2020 [11]. It is expected that the global net profit of wearable devices will reach 52.5 billion U.S. dollars in 2024 [12].
Currently, PPG sensing devices using single-wavelength (SW) light sources have been the main stream on the market. Many studies have focused on reducing the effects of motion artifacts, mostly by using accelerometers to build up compensation signals, hence improving the signal-to-noise ratio (S/N) of the PPG signals [13,14,15]. However, heart rate measurement error can be still up to 10% using the single-wavelength PPG (SW-PPG) sensing technology. Besides, the SW-PPG sensing technology may also suffer from many other factors during measurement, such as skin color, skin surface temperature and sensor contact pressure, resulting in a poor quality of PPG signals.
Accordingly, multi-wavelength PPG (MW-PPG) sensing technology has gradually attracted the attention of many scholars in recent years, and has been considered a robust PPG signal measurement method [16,17]. In earlier studies [18,19], it has been noted that PPG sensing light sources at different wavelengths are recommended for the subjects with different skin colors. In applying multi-wavelength photoplethysmography (MW-PPG) sensing technology, the most suitable wavelength can be chosen to pick the PPG signals of best quality. This can effectively improve the accuracy of heart rate sensing by 15%. In the literature [20,21], experimental results show that under low-temperature conditions the blood perfusion decreases, resulting in the decrease of S/N of the PPG signal. While, if the MW-PPG sensing technology is applied, the best wavelengths can be selected for users at different skin temperatures, and hence the S/N of the PPG signal can be significantly increased by 50%. Besides, it is noted that wearing the PPG sensing devices will unavoidably cause contact pressure on the skin surface, which will cause different degrees of occlusion phenomenon for the microvascular and arterioles. In other earlier studies [22,23], the authors pointed out that PPG sensing light sources at different wavelengths can be used at different degrees of occlusion phenomenon, to achieve the best S/N of the PPG signals. By using the MW-PPG sensing devices, a better S/N of the PPG signals can be obtained. Besides, since PPG signals at different wavelengths can reflect the PPG signals measured from different depths of the body, the pulse transit time (PTT) derived from PPG signals at different wavelengths can also be obtained by using MW-PPG sensing technology. It was shown that the correlation coefficient R between the PTT and blood pressure can reach more than 0.9, demonstrating the feasibility of using MW-PPG signals for blood pressure measurement [24,25].
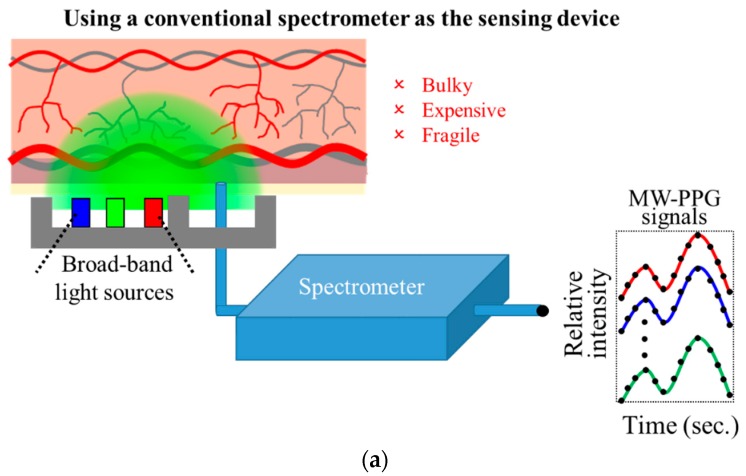
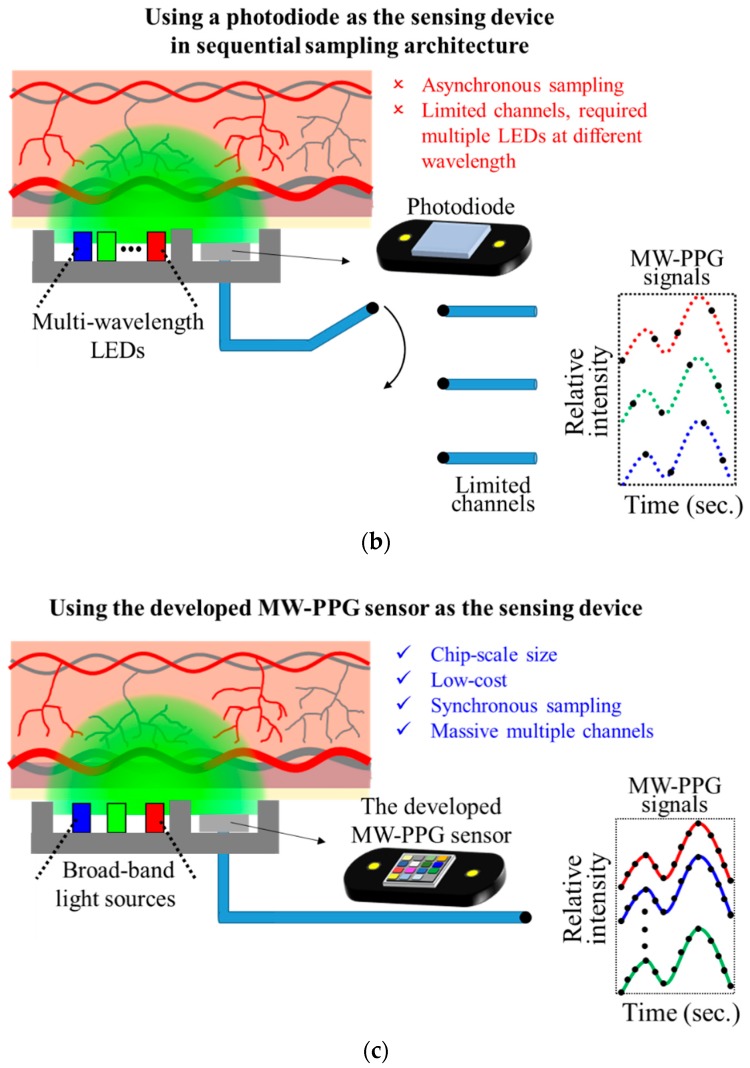
However, in many prior studies, as illustrated in Figure 1a, spectrometers were used as the sensing devices for sensing MW-PPG signals [21,22]. We note that not only the large size of the conventional spectrometer leads to inconvenience in the measurement setup, but the high price of the conventional spectrometer also leads this approach unable to be integrated in the daily applications. Some scholars have tried to use photodiodes (PDs) such as AFE4404 chip of Texas Instruments (TI) [26], BH1790GLC chip of ROHM Semiconductor [27], and MAX30102 chip of Maxim Integrated [28], to collect PPG signals of different wavelengths, as shown in Figure 1b. This approach can effectively reduce the size and cost of the MW-PPG sensing devices. However, for example, to acquire N different wavelength PPG signals through this sequential sampling architecture, not only will the sampling rate of PPG signals at each wavelength be reduced by 1/N, but it will also require light sources of N different wavelengths. We note that when N is large, this architecture would become difficult in implementation. For practical considerations, only N = 2 or 3 are implemented in general.
Figure 1.
Illustration of multi-wavelength photoplethysmography (MW-PPG) sensing technologies: (a) prior works using a conventional spectrometer as the sensing device; (b) prior works using a photodiode as the sensing device in sequential sampling architecture; (c) the proposed work using the developed chip-scale MW-PPG sensors as the sensing device.
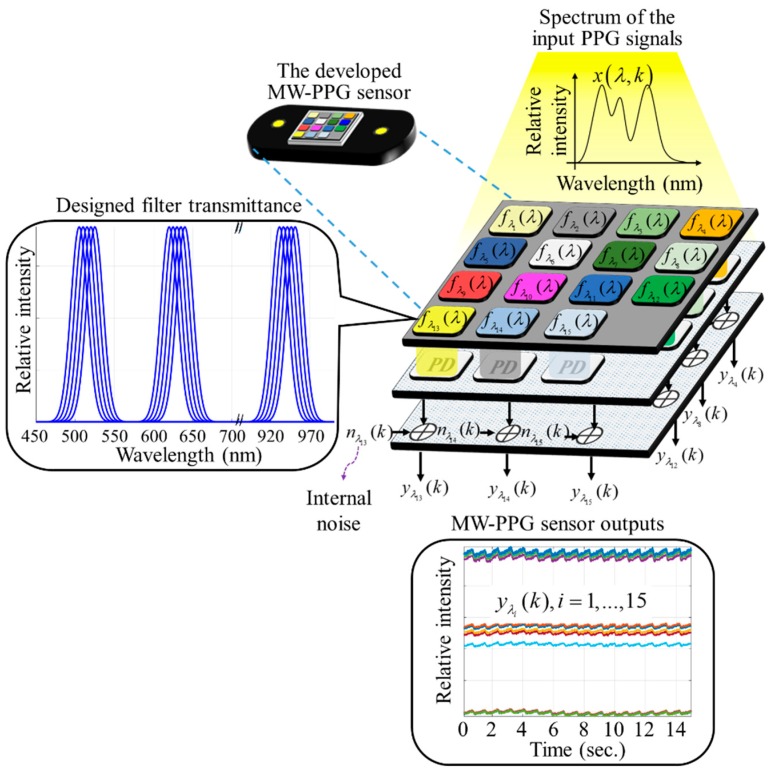
In this study, we developed a chip-scale MW-PPG sensor using innovative an on-chip spectrometer approach, as shown in Figure 1c. The MW-PPG sensor developed is only several square micrometers. It is compact, robust, and lightweight. To provide a large number of PPG signals at different wavelengths, only one broad spectrum light-emitting diode (LED) or a few LEDs covering broad spectrum are required. Furthermore, signal processing algorithms were developed to robustly extract PPG signals using this developed MW-PPG sensing device. Experimental results show that the S/N of the maximal-ratio combined (MRC) MW-PPG signals, namely MRC-MW-PPG signals, can be increased by up to 50%, compared to those acquired from the conventional single wavelength approach. Besides, we were able to successfully demonstrate simultaneous heart rate measurement, SpO2 measurement and blood pressure measurement using this MW-PPG sensor developed.
The organization of the rest of this paper is stated as follows. Section 2 introduces hardware designing of the MW-PPG sensor developed. The mathematical model of the MW-PPG sensor developed and the signal processing algorithms for obtaining robust PPG signals, SpO2 and blood pressure are presented in Section 3. Section 4 discusses the experimental results, and we draw a conclusion in Section 5.
2. Design of the Developed MW-PPG Sensor
The scheme of the chip-scale MW-PPG sensor developed is shown in Figure 2. The core technology of this sensor is based on plasmonic filters which can be integrated onto a regular photo-detector such as a complementary metal–oxide–semiconductor (CMOS) imager. By introducing nanoscale structures on metal films, plasmonic filters can provide a unique way to control polarization and wavelength of light passing through the structures. One of the significant differences of the plasmonic filters is that the transmission wavelength can be controlled only by the lateral structures on a single layer. This makes it possible to produce a device containing different filter channels in a cost-effective manner. The single layer plasmonic metal structures can be monolithically fabricated using the standard semiconductor wafer process such as nanoimprint lithography and etching processes, which enables the low manufacturing cost for the volume applications. We note that the fabrication cost of the plasmonic filters can be as low as a few dollars at volume. It is one of the most advanced processes in making on-chip spectrometers, as reported in our previous work [29,30].
Figure 2.
Schematic structure and mathematical model of the proposed MW-PPG sensor.
In this work, we utilized the same concept, but made a chip-scale MW-PPG sensor to synchronously detect MW-PPG signals at 15 wavelengths, including: 505 nm, 510 nm, 515 nm, 520 nm, 525 nm, 620 nm, 625 nm, 630 nm, 635 nm, 640 nm, 930 nm, 935 nm, 940 nm, 945 nm, and 950 nm. The 15 wavelengths were grouped into three regions with three major center wavelengths: 515 nm, 630 nm and 940 nm. By using the red region PPG signals centered at 630 nm and the infrared region PPG signals centered at 940 nm, the R-values could be obtained for the SpO2 measurement. Furthermore, by using the green region PPG signals centered at 515 nm and the infrared region PPG signals centered at 940 nm, the PTT could be extracted for the blood pressure measurements.
In the following, it is shown how the raw MW-PPG signals, the PTTs of the raw MW-PPG signals, and the PTT-compensated PPG signals are extracted from the MW-PPG sensor we developed. We note that these quantities will be used in the sequel for robust PPG measurement, SpO2 measurement, and blood pressure measurement. Let denote the spectrum reflected from tissues emitted by the designed light sources, as shown in Figure 2. Assume is shining into the developed chip-scale MW-PPG sensor, where k is the discrete time index. Let be the transfer function of the i-th filter in the developed chip-scale MW-PPG sensor. The raw PPG signals from the i-th filter can be represented as
| (1) |
where is the signal component, is Gaussian noise component, and are the raw PPG signals at wavelengths 505 nm, 510 nm, 515 nm, 520 nm, 525 nm, 620 nm, 625 nm, 630 nm, 635 nm, 640 nm, 930 nm, 935 nm, 940 nm, 945 nm, and 950 nm, respectively. In the design, 505 nm PPG signal is used as a reference, and the PTT of the i-th PPG signal is expressed as
| (2) |
where is the cross-correlation function between and , is the discrete index displacement, and is the sampling rate of the developed MW-PPG sensor. As reported in [31], skin is a layer structure and blood vessels are located in different layers, for example, small arteries are located in hypodermis layer which is the innermost layer of skin, arterioles are located in dermis layer and capillaries are located in the epidermis layer. When the blood pulse generated by the heart, it will arrive at small arteries, arterioles, and capillaries in order at different times. Since light with different wavelengths can penetrate into different depths of skin, MW-PPG signals at different wavelengths reflect the signals probing to different depths of blood vessels. In other words, MW-PPG signals carry the information of pulse arrival time at different depths of blood vessels. Conventionally, pulse transit time (PTT) is considered to be the time delay between the peak of PPG signals against the R peaks of electrocardiogram (ECG) signals [32]. In this work, the pulse transit time (PTT) is defined as the time shifting between MW-PPG signals at different wavelengths, also known as local PTT [33]. The PTT-compensated PPG signals are then expressed as
| (3) |
where and .
3. Methods for Extraction Robust PPG Signals, SpO2, and Blood Pressure Measurement
Firstly, the MRC algorithm for deriving robust PPG signals from the MW-PPG signals is presented. Secondly, the method of obtaining R-values from the PTT-compensated MW-PPG signals for SpO2 measurement is introduced. Third, the method of using for blood pressure measurement is explained.
3.1. MW-PPG Signals Combining Methods for Extracting Robust PPG Signals
Assume the MW-PPG signals from the developed MW-PPG sensor is quasi-steady, where . Assume the noise of the i-th filter is Gaussian with zero-mean and variation . The S/N of the i-th filter can be defined as
| (4) |
Assume the weights to the MW-PPG signals at different wavelengths are . The MRC-MW-PPG signal from the PTT-compensated MW-PPG signals can be expressed as
| (5) |
where , . We assume that the signal power and noise power of the MRC-MW-PPG signals can be expressed respectively as
| (6) |
Therefore, the S/N of the MRC-MW-PPG signals is defined as . According to the well-known Cauchy-Schwarz inequality and the MRC signal combination algorithm [34], it can be shown that
| (7) |
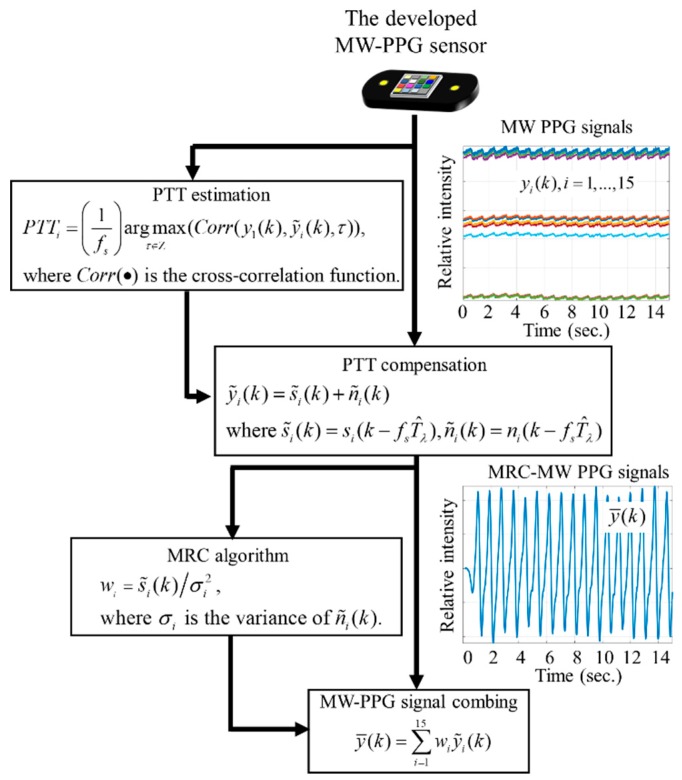
can be maximized at with the optimal weights . The flowchart shown in Figure 3 summarizes the algorithms for obtaining the robust MRC-MW-PPG signals. We note that the computational cost of the MRC algorithm is low and is linear scaling with respective to the number of selected components. In other words, the computational complexity of the MRC algorithm implemented was O(n), where n is the number of the picked wavelengths on the multi-wavelength PPG signals acquired by the developed MW-PPG sensor.
Figure 3.
The developed signal processing flowchart for extracting robust maximal-ratio combined (MRC)-MW-PPG signals.
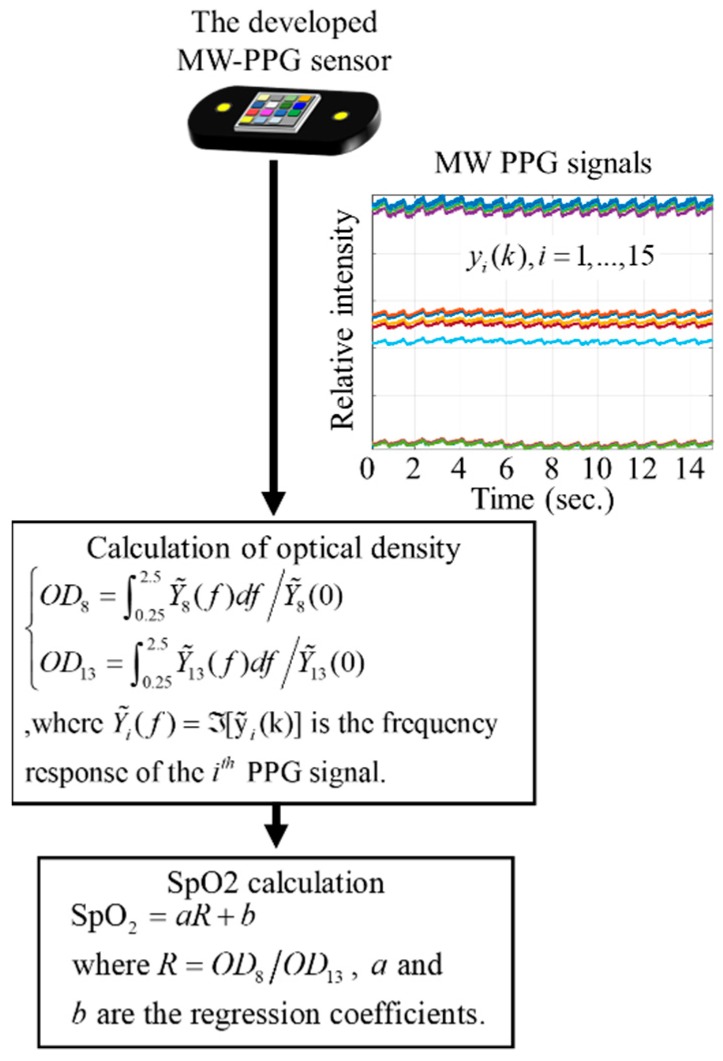
3.2. MW-PPG Signal Processing Methods for SpO2 Measurement
SpO2 is defined as the measurement of the amount of oxygen dissolved in blood. Light at different wavelengths can be used to probe the absorption level of Oxygen-bound Hemoglobin (HbO2) and Hemoglobin (Hb). It has been widely reported that the attenuations by Hb and HbO2 are largely different at wavelength 660 nm, and are nearly the same at 940 nm. In other words, if using the signal at 940 nm as a normalizer, the absorption level can be clearly distinguished by watching the signal at 660 nm. 660 nm and 940 nm are then widely used for SpO2 measurement in the research fields as well as in industries [35,36,37,38]. From Equation (3), we note that and are the PPG signals at 660 nm and 940 nm, respectively. According to the Beer–Lambert law, the optical density (OD) of and can be defined respectively as
| (8) |
where is the frequency response of the i-th PPG signal, and is a Fourier transform. The R-values can be associated by . SpO2 can be approximated by
| (9) |
where, a and b are regression coefficients of the linear models. The signal processing procedure of SpO2 measurement using the developed MW-PPG sensor is summarized in Figure 4.
Figure 4.
Signal processing procedure of SpO2 measurement using the MW-PPG sensor developed.
3.3. MW-PPG Signals Processing Methods for Blood Pressure Measurement
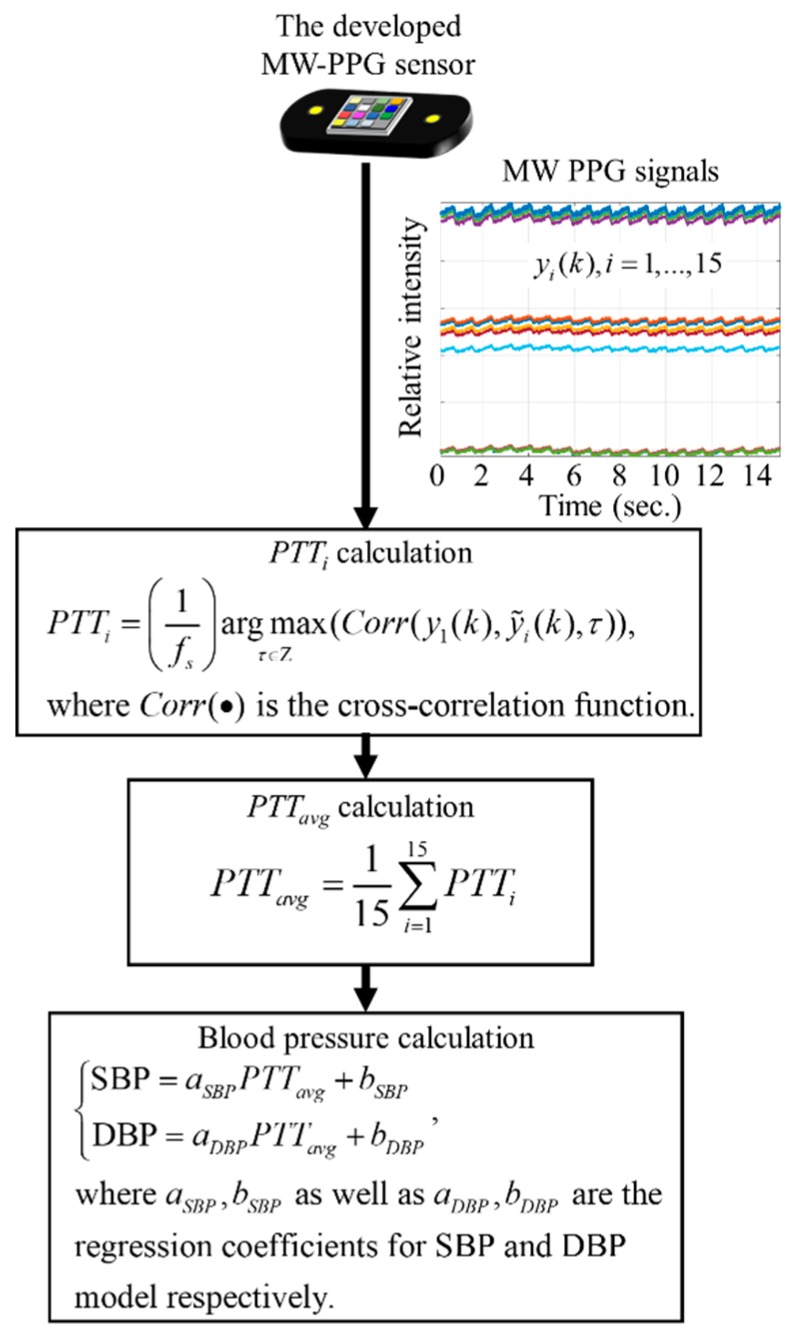
According to the literature [33,39,40], the of Equation (2) can have a high correlation with diastolic blood pressure (DBP) and systolic blood pressure (SBP). The relationship of and blood pressure can be established by using a linear regression model.
In this work, we computed the averaged PTT by . We associated with DBP as well as with SBP as follows:
| (10) |
where , and , are the regression coefficients of the linear models for DBP and SBP, respectively. The signal processing procedure of SBP and DBP measurement using the developed MW-PPG sensor is summarized in Figure 5.
Figure 5.
Signal processing procedure of blood pressure measurement using the MW-PPG sensor developed.
4. Experiment Results
Figure 6a shows the MW-PPG sensing device developed. Part a is the developed chip-scale MW-PPG sensor introduced in Section 2. Parts b and d are green LEDs with a center wavelength at 515 nm. Parts c and e are red and infrared LEDs with center wavelengths at 630 nm and 940 nm, respectively. The LEDs’ spectra measured by a Spectrometer (Ocean Optics, USB4000) are shown in Figure 6b.
Figure 6.
The MW-PPG sensing device we developed: (a) snapshot of the developed sensing device; (b) spectra of the light sources.
In this section, we aim to verify the functionalities of the developed chip-scale MW-PPG sensor, yet aiming at extensive medical proof. For the purposes of verification, we only acquired 10 subjects, whose ages ranged from 20 to 60 and the ratio of men to women was 7:3, with males ranging from 160 to 180 centimeters in height and females ranging from 155 to 170 centimeters in height. To demonstrate the advantages of the chip-scale MW-PPG sensor developed, a SW-PPG sensor representing a conventional signal-wavelength PPG detector was used as a reference device. To compare the stability of the PPG signals, each subject was asked to use both the MW-PPG sensor developed and the SW-PPG sensor to acquire 15 second signals. Also, to conduct a correlation analysis between the SpO2 and the R-values extracted from the developed MW-PPG sensing device, a blood oximetry meter (TRUST, TD-8250A) [41] was used as a reference instrument. Besides, to perform the correlation analysis between SBP, DBP against the extracted from the developed chip-scale MW-PPG sensor, an upper arm blood pressure monitor (Omron, HEM-7121) [42] was used as the reference instrument. It is worth mentioning that while considering the frequency of the human heart rate pulse signal is normally around 0.25–2.5 (Hz), we used Parks-McClellan algorithm to design a 64-degree band-pass filter (BPF), with a passband of 0.3–4.0 Hz, to eliminate the out of band noise [43].
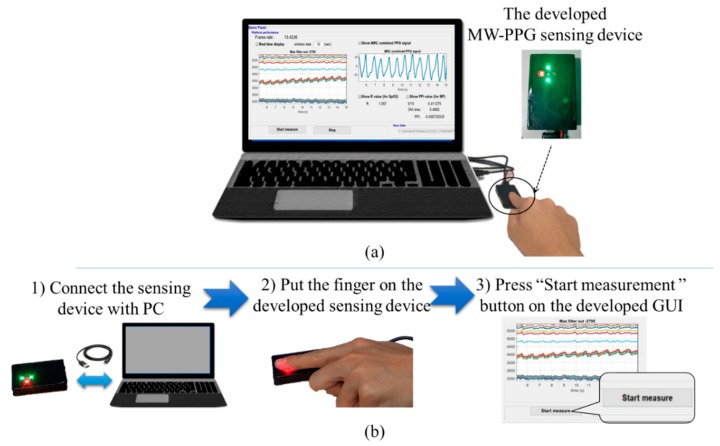
The MW-PPG signal measurement via the innovative and fully-integrated, MW-PPG sensing device we developed is illustrated in Figure 7a. To collect the MW-PPG signals, as shown in Figure 7b, firstly connect the sensing device with PC via USB cable, put the index finger on the sensing devices, and then press the “start measurement” button on the developed graphical user interface (GUI), which is based on the MATLAB R2017a platform. 15 seconds of raw MW-PPG signals will be recorded. By using Equations (2) and (3), each PPG signals’ PTT and each PTT-compensated PPG signal can be extracted from . Besides, the MRC-MW-PPG signal can be obtained from using the presented MRC signal combining the algorithm introduced in Section 3, Part A. Besides, the R-values are calculated from the 660 nm and 940 nm PPG signal, and , based on the algorithm presented in Section 3, Part B. Also, the is calculated from according to the algorithm introduced in Section 3, Part C.
Figure 7.
Operation of the developed MW-PPG prototype sensing device. (a) Snapshot of the MW-PPG measurement setup; (b) Illustration of the operation sequence.
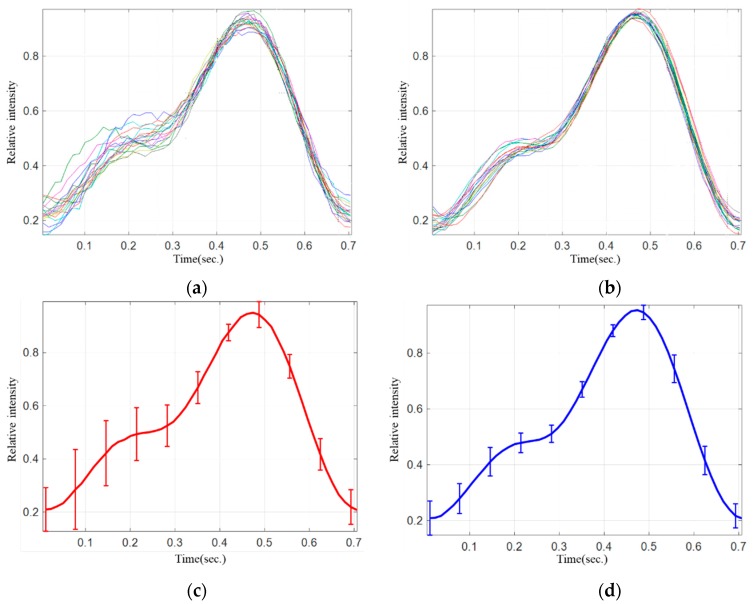
Figure 8 shows the comparison of stability of the PPG signals from a subject using the MW-PPG sensing device developed against the SW-PPG sensing device. The curves in Figure 8a,b show the overlapped PPG waveforms collected by: (i) using the SW-PPG sensing device; and (ii) using the developed MW-PPG sensing device. For better clarity, to understand the variation of the PPG waveforms at different time segments, the averaged curve and the error bar, which is the standard deviation at the certain time segment, of the overlapped PPG waveforms in Figure 8a,b, were then computed and are shown in Figure 8b,d.We observe that the averaged variation of SW PPG signal was 0.142, whereas that of MRC-MW-PPG signals was only 0.077. Compared to the reference SW-PPG sensor, the MW-PPG sensor developed could effectively reduce the averaged variation by around 50%.
Figure 8.
Waveform and variation of the PPG signals: (a,c) are measured by the reference SW-PPG sensing device, (b,d) measured by the MW-PPG sensing device developed.
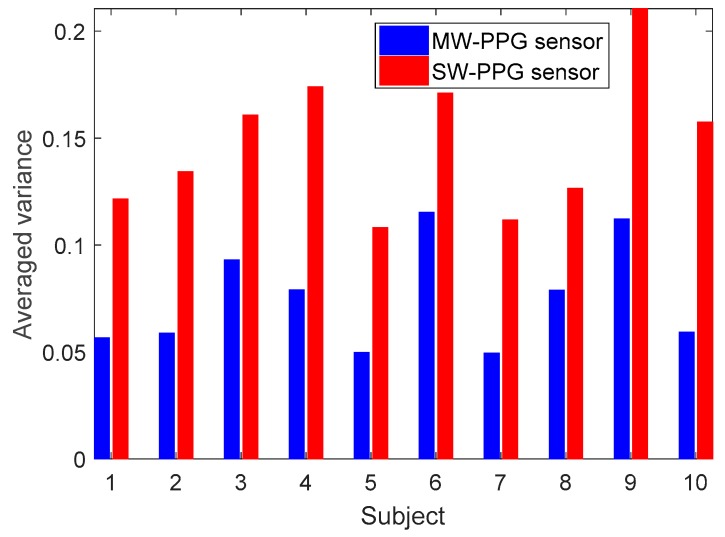
Furthermore, Figure 9 shows the comparison of stability of the PPG signals among the 10 subjects, where the red and blue bars are the averaged variation of PPG signals derived from the SW-PPG sensing device and that from the MW-PPG sensing device, respectively. It shows that, in general, compared to the SW-PPG sensing device, around 50% variation reduction could be obtained in using the developed MW-PPG sensing device.
Figure 9.
Averaged variation of 10 subjects. Red bar is derived from the reference signal-wavelength photoplethysmography (SW-PPG) sensing device, whereas blue bar is derived from the developed MW-PPG sensing device.
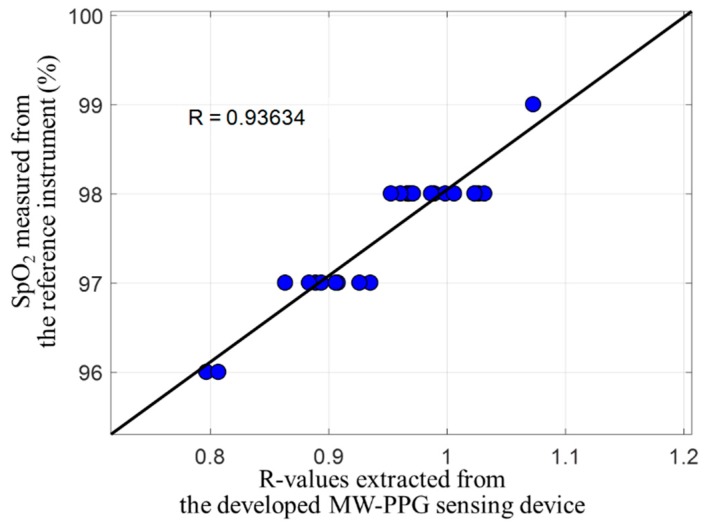
Figure 10 shows the correlation between SpO2 and R-values extracted from the MW-PPG sensing device developed, where the x-axis represents the R-values extracted from the MW-PPG sensor and the y-axis represents the SpO2 measured by the reference instrument. From the preliminary experimental results, we see that the R-value against the SpO2 value can deliver a high correlation coefficient up to 0.93, which matches the experimental result reported in [24]. It shows the potential of SpO2 measurement using the MW-PPG sensing device developed.
Figure 10.
Correlation analysis between SpO2 and R-values extracted from the MW-PPG sensing device developed.
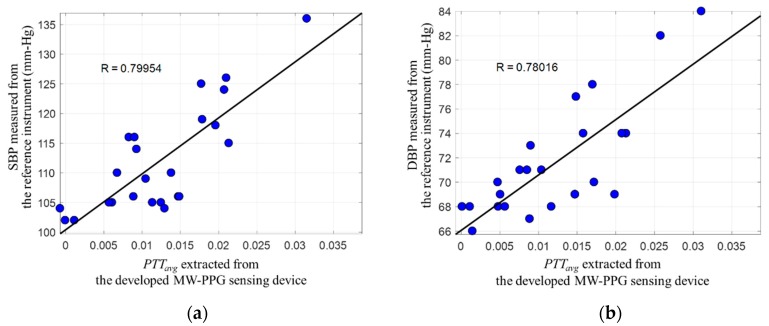
Figure 11 shows the correlation between SBP and DBP, against which is extracted from the MW-PPG sensing device developed. In Figure 11a,b, the x-axis represents the and the y-axis represents SBP and DBP, respectively. In this paper, we initiate the research to build an innovative chip-scale MW-PPG sensor for synchronously sensing MW-PPG signals. To quickly assess the potential capabilities of the device developed, rather than conducting a comprehensive medical case study which involves larger-scale budgets and time, only a simple correlation analysis was conducted as for pre-screening. Correlation coefficients R = 0.79 between and SBP, and correlation coefficients R = 0.78 between and DBP were observed. The extracted from the MW-PPG sensing device developed show a sufficient high correlation on blood pressure, which matches the experimental results reported in [25]. The extracted from the MW-PPG sensing device was useable to estimate SBP and DBP via a simple linear regression model.
Figure 11.
Correlation analysis between the blood pressure measured by the reference instrument against the extracted from the developed MW-PPG sensing device: (a) systolic blood pressure (SBP); (b) diastolic blood pressure (DBP).
We note that as mentioned in Section 1, the current available PPG sensing devices on the market are not in the structure of synchronous MW-PPG sensing, and the main functionality is for heart rate detection. Our innovative, chip-scale and fully-integrated MW-PPG sensing devices not only have the potential to provide a more stable and robust PPG signals, from the benefits of the MRC signal combining algorithm, for accurate heart rate detection, but also can simultaneously provide both R-values, for SpO2 detection, and , potentially for blood pressure detection.
As shown in Table 1, It is worth mentioning that multi-channel optical sensors are emerging on the market. For example, AMS AG recently announced low-cost optical sensors (model: AS73210) to simultaneously detect up to six wavelengths [44]. The chip-scale MW-PPG sensor developed is superior in detecting up to 15 wavelengths, and is designed for blood pressure and SpO2 measurements. Besides, if compared to the sequential sampling architecture currently available on the market [26,27,28], the MW-PPG sensor developed is capable of synchronously sampling PPG signals of a large number wavelengths from a full-wavelength LED or few single-wavelength LEDs. If compared to conventional spectrometers, such as using Ocean Optics STS Microspectrometer (model: STS-VIS) [45], used by the early researchers for constructing primitive MW-PPG measurement platforms with synchronous sampling architecture, the MW-PPG sensor developed can provide a competitive advantage in size and cost for daily applications.
Table 1.
Comparison of the proposed approach against other available solutions on the market if adapted for MW-PPG sensing.
| Sensor Venders | # of Channels | Synchronous/Sequential Measurement | Cost | Size |
|---|---|---|---|---|
| The developed MW-PPG sensor |
15 | Synchronous | Low | Small |
| AFE4404 (Texas Instruments) [26] |
3 | Sequential | Low | Small |
| BH1790GLC (ROHM Semiconductor) [27] |
1 | Sequential | Low | Small |
| MAX30102 (Maxim Integrated) [28] |
2 | Sequential | Low | Small |
| AS73210 (AMS AG) [44] |
6 | Synchronous | Low | Small |
| STS-VIS (Ocean Optics) [45] |
>100 | Synchronous | Very high | Very large |
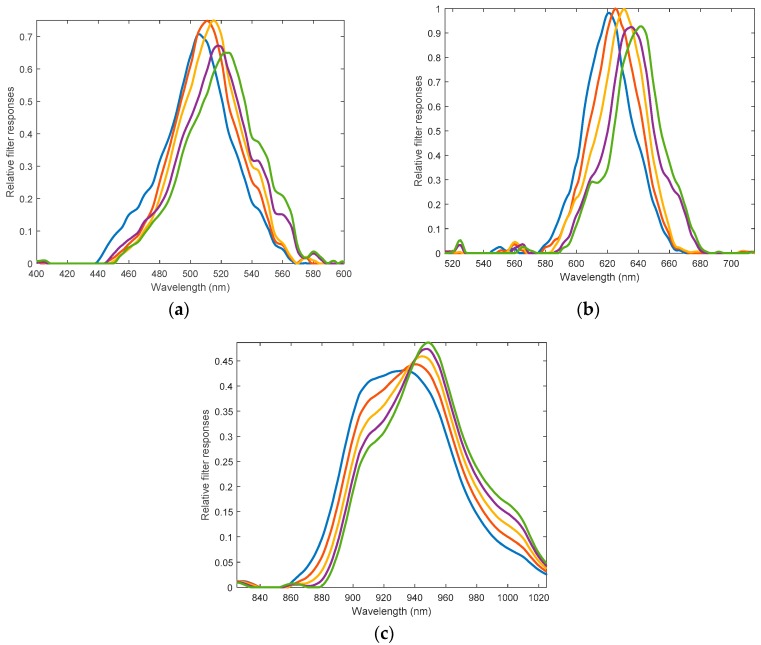
Note that the filter responses of the MW-PPG sensor developed are shown in Figure 12, peaks at 505 nm, 510 nm, 515 nm, 520 nm, 525 nm, 620 nm, 625 nm, 630 nm, 635 nm, 640 nm, 930 nm, 935 nm, 940 nm, 945 nm, and 950 nm, with full width at half maximum (FWHM) around 40~60 nm. While achieving the channel selection purpose, cross-talk among adjacent channels is unavoidable since these filters are broad and overlapped. However, the side-lobes of these filters are well suppressed, so that a full-wavelength light source or few single-wavelength LEDs can be used. 15 PPG signals corresponding to these regions of different wavelengths can then be acquired. We note that the wavelengths of the light sources picked need to cover the sensitivity region of the implemented filters. In this work, to focus on demonstrating applications of SpO2 measurement and blood pressure measurement, LEDs of blue green, and the IR region were implemented as for a practical and cost-efficient implementation.
Figure 12.
Filter responses of the 15 filters fabricated in the MW-PPG sensors developed: (a) in blue region; (b) in green region, and (c) in IR region.
5. Conclusions
In this work, we initiated the development of multi-wavelength photoplethysmogram (MW-PPG) sensors, in view of lacking this kind of sensor available in the research field or on the market. Three spectral regions centered at 515 nm, 630 nm and 940 nm were used to synchronously obtain 15 PPG signals corresponding to these regions of different wavelengths, by means of fabricating cost-efficient plasmonic filters. By utilizing the maximal-ratio combined (MRC) algorithm, the proposed approach showed a 50% variation reduction when compared with the single-wavelength reference sensor. Besides, both the R-values for the SpO2 measurement by using the red and infrared regions, and the pulse transit time (PTT) for the blood pressure measurement by using the green and infrared regions were investigated. Preliminary experimental results showed that the correlation coefficient between the R-values and the SpO2 could be as high as R = 0.93. The correlation coefficients between the PTT against systolic blood pressure (SBP) and diastolic blood pressure (DBP) could reach R = 0.79 and R = 0.78, respectively. The MW-PPG sensing device developed has full potential not only in conventional PPG measurement and SpO2 measurement, but also in emerging blood pressure measurement for wearable devices, all in a synchronous and simultaneous manner.
Author Contributions
Conceptualization, C.-C.C. and B.I.C.; Methodology, C.-C.C. and T.-J.F.; Project administration, C.-C.C.; Supervision, C.-C.C.; Writing—review & editing, C.-C.C.; Investigation, C.-T.W.; Software, C.-T.W.; Writing—original draft, C.-T.W.; Formal analysis, C.-T.W.; Funding acquisition, B.I.C.
Funding
This research was funded by the Ministry of Science and Technology of R.O.C. under grant number MOST 107-2221-E-027-084-MY2.
Conflicts of Interest
The authors declare no conflict of interest
References
- 1.Buchs A., Slovik Y., Rapoport M., Rosenfeld C., Khanokh B., Nitzan M. Right-left correlation of the sympathetically induced fluctuations of photoplethysmographic signal in diabetic and non-diabetic subjects. Med. Biol. Eng. Comput. 2005;43:252–257. doi: 10.1007/BF02345963. [DOI] [PubMed] [Google Scholar]
- 2.Nasimi S.G., Mearns A.J., Harness J.B., Heath I. Quantitative measurement of sympathetic neuropathy in patients with diabetes mellitus. J. Biomed. Eng. 1991;13:203–208. doi: 10.1016/0141-5425(91)90127-S. [DOI] [PubMed] [Google Scholar]
- 3.Allen J., Murray A. Similarity in bilateral photoplethysmographic peripheral pulse wave characteristics at the ears, thumbs and toes. Physiol. Meas. 2000;21:369–377. doi: 10.1088/0967-3334/21/3/303. [DOI] [PubMed] [Google Scholar]
- 4.Avnon Y., Nitzan M., Sprecher E., Rogowski Z., Yarnitsky D. Different patterns of parasympathetic activation in uni- and bilateral migraineurs. Brain J. Neurol. 2003;126:1660–1670. doi: 10.1093/brain/awg158. [DOI] [PubMed] [Google Scholar]
- 5.Apple Watch Series 3 Teardown. [(accessed on 8 May 2018)]; Available online: https://www.ifixit.com/Teardown/Apple+Watch+Series+3+Teardown/97521.
- 6.HUAWEI Band 2 Pro. [(accessed on 8 May 2019)]; Available online: https://consumer.huawei.com/tw/wearables/band2-pro/
- 7.Amazfit. [(accessed on 10 June 2019)]; Available online: http://cn.amazfit.com/
- 8.Vivofit 4. [(accessed on 8 June 2019)]; Available online: https://explore.garmin.com/en-US/vivo-fitness/
- 9.Liquid Leap+ Fitness Watch. [(accessed on 8 May 2018)]; Available online: https://us-store.acer.com/wearables/liquid-leap-plus-fitness-watch.
- 10.Gear Sport. [(accessed on 8 May 2019)]; Available online: https://www.samsung.com/us/mobile/wearables/smartwatches/gear-sport-blue-sm-r600nzbaxar/
- 11.Measuring Heart Rates with Light Technology Applications Expands in Wearables and Potentially Home Healthcare Applications, Says LED Inside. [(accessed on 24 December 2017)]; Available online: https://www.ledinside.com/intelligence/2016/5/measuring_heart_rates_with_light_technology_applications_expands_in_wearables_and_potentially_home_healthcare_applications_says.
- 12.Global Smart Wearable Device Market to Grow at a CAGR of over 16% through 2016–2024 Research Nester. [(accessed on 24 December 2017)]; Available online: https://medium.com/@Mresearchnester/global-smart-wearable-device-market-to-grow-at-a-cagr-of-over-16-through-2016-2024-research-nester-3d4178d05a99.
- 13.Lee J., Matsumura K., Yamakoshi K.I., Rolfe P., Tanaka S., Yamakoshi T. Comparison between red, green and blue light reflection photoplethysmography for heart rate monitoring during motion; Proceedings of the IEEE EMBS; Osaka, Japan. 3–7 June 2013; pp. 1724–1727. [DOI] [PubMed] [Google Scholar]
- 14.Matsumura K., Rolfe P., Lee J., Yamakoshi T. iPhone 4s photoplethysmography: Which light color yields the most accurate heart rate and normalized pulse volume using the iPhysioMeter application in the presence of motion artifact? PLoS ONE. 2014;9:e91205. doi: 10.1371/journal.pone.0091205. [DOI] [PMC free article] [PubMed] [Google Scholar]
- 15.Asare L., Ozols M., Rubins U., Rubenis O., Spigulis J. Clinical measurements with multi-spectral photoplethysmography sensors; Proceedings of the SPIE; Brussels, Belgium. 12–16 April 2010; pp. 842734.1–842734.5. [Google Scholar]
- 16.Asare L., Kviesis-Kipge E., Grabovskis A., Rubins U., Erts R., Spigulis J. Multi-spectral photoplethysmography biosensor; Proceedings of the SPIE; Prague, Czech Republic. 19–20 April 2011; pp. 80731Z.1–80731Z.6. [Google Scholar]
- 17.Kumar M., Veeraraghavan A., Sabharwal A. DistancePPG: Robust non-contact vital signs monitoring using a camera. Biomed. Opt. Express. 2015;6:1565–1588. doi: 10.1364/BOE.6.001565. [DOI] [PMC free article] [PubMed] [Google Scholar]
- 18.Yan L., Hu S., Alzahrani A., Alharbi S., Blanos P. A multi-wavelength opto-electronic patch sensor to effectively detect physiological changes against human skin types. Biosensors. 2017;7:22. doi: 10.3390/bios7020022. [DOI] [PMC free article] [PubMed] [Google Scholar]
- 19.Jeong C., Yoon H., Kang H., Yeom H. Effects of skin surface temperature on photoplethysmograph. J. Healthc. Eng. 2014;5:429–438. doi: 10.1260/2040-2295.5.4.429. [DOI] [PubMed] [Google Scholar]
- 20.Maeda Y., Sekine M., Tamura T. The advantages of wearable green reflected photoplethysmography. J. Med. Syst. 2011;35:829–834. doi: 10.1007/s10916-010-9506-z. [DOI] [PubMed] [Google Scholar]
- 21.Spigulis J., Gailite L., Lihachev A., Erts R. Simultaneous recording of skin blood pulsations at different vascular depths by multiwavelength photoplethysmography. Appl. Opt. 2007;46:1754–1759. doi: 10.1364/AO.46.001754. [DOI] [PubMed] [Google Scholar]
- 22.Spigulis J., Gailite L., Erts R., Lihachev A. Contact probe pressure effects in skin multi-spectral photoplethysmography; Proceedings of the SPIE Diagnostic Optical Spectroscopy in Biomedicine; Munich, Germany. 11 July 2007; pp. 1–8. [Google Scholar]
- 23.Anderson R., Parrish J. The optics of human skin. J. Investig. Dermatol. 1981;77:13–19. doi: 10.1111/1523-1747.ep12479191. [DOI] [PubMed] [Google Scholar]
- 24.Vahdani-Manaf N. Biological assessments by innovative use of multi-wavelength photoplethysmographic signals time differences. J. Appl. Sci. 2015;15:1312–1317. doi: 10.3923/jas.2015.1312.1317. [DOI] [Google Scholar]
- 25.Asare L., Kviesis-Kipge E., Rubins U., Rubenis O., Spigulis J. Multi-spectral photoplethysmography technique for parallel monitoring of pulse shapes at different tissue depths; Proceedings of the SPIE Clinical and Biomedical Spectroscopy and Imaging; Munich, Germany. 10 June 2011; pp. 1–6. [Google Scholar]
- 26.AFE4404. [(accessed on 8 May 2018)]; Available online: http://www.ti.com/product/AFE4404.
- 27.Optical Sensor for Heart Rate Monitor—BH1790GLC. [(accessed on 8 May 2018)]; Available online: http://www.rohm.com.tw/web/taiwan/products/-/product/BH1790GLC.
- 28.MAX30102, High-Sensitivity Pulse Oximeter and Heart-Rate Sensor for Wearable Health. [(accessed on 8 May 2018)]; Available online: https://www.maximintegrated.com/en/products/sensors-and-sensor-interface/MAX30102.html.
- 29.Kurokawa U., Choi B.I., Chang C.C. Filter-based miniature spectrometers: Spectrum reconstruction using adaptive regularization. IEEE Sens. J. 2011;11:1556–1563. doi: 10.1109/JSEN.2010.2103054. [DOI] [Google Scholar]
- 30.Chang C.C., Lin H.Y. Spectrum reconstruction for on-chip spectrum sensor array using a novel blind nonuniformity correction method. IEEE Sens. J. 2012;12:2586–2592. doi: 10.1109/JSEN.2012.2197609. [DOI] [Google Scholar]
- 31.Lokharan M., Lokesh K.C., Kumar V., Kumar H., Kayalvizhi N., Aryalekshmi R., Goli S., Jayanthi T. Measurement of pulse transit time (PTT) using photoplethysmography; Proceedings of the 16th International Conference on Biomedical Engineering; Singapore. 30 June 2017; pp. 130–131. [Google Scholar]
- 32.Yoon Y., Toon G. Nonconstrained blood pressure measurement by photoplethysmography. J. Opt. Soc. Korea. 2016;10:91–95. doi: 10.3807/JOSK.2006.10.2.091. [DOI] [Google Scholar]
- 33.Liu J., Yan B.P., Zhang Y.T., Ding X.R., Su P., Zhao N. Multi-wavelength photoplethysmography enabling continuous blood pressure measurement with compact wearable electronics. IEEE Trans. Biomed. Eng. 2018;66:1514–1525. doi: 10.1109/TBME.2018.2874957. [DOI] [PubMed] [Google Scholar]
- 34.Maximal-Ratio Combining. [(accessed on 16 June 2018)]; Available online: https://en.wikipedia.org/wiki/Maximal-ratio_combining.
- 35.Yang D., Zhu J., Zhu P. SpO2 and heart rate measurement with wearable watch based on PPG; Proceedings of the 2015 IET International Conference on Biomedical Image and Signal Processing; Beijing, China. 19 November 2015. [Google Scholar]
- 36.Carni D.L., Grimaldi D., Sciammarella P.F., Lamonaca F., Spagnuolo V. Setting-up of PPG scaling factors for SpO2% evaluation by smartphone; Proceedings of the 2016 IEEE International Symposium on Medical Measurements and Applications; Benevento, Italy. 15–18 May 2016. [Google Scholar]
- 37.Subhagya D.S., Keshava M.C., Aruna N., Janardhan L., Ramakrishna H.S. Case study on measurement of SpO2 from PPG Signals in the presence of motion artifact; Proceedings of the 2017 International Conference on Recent Advances in Electronics and Communication Technology; Bangalore, India. 16–17 March 2017. [Google Scholar]
- 38.Mishra D., Priyadarshini N., Chakraborty S., Sarkar M. Blood oxygen saturation measurement using polarization-dependent optical sectioning. IEEE Sens. 2017;17:3900–3908. doi: 10.1109/JSEN.2017.2698520. [DOI] [Google Scholar]
- 39.Fung P., Dumont G., Ries C., Mott C., Ansermino M. Cuff less continuous non-invasive blood pressure. measurement using pulse transit time measurement; Proceedings of the 26th Annual International Conference of the IEEE Engineering in Medicine and Biology Society; San Francisco, CA, USA. 1–5 September 2004; pp. 1–5. [DOI] [PubMed] [Google Scholar]
- 40.Liu J., Yan B.P.Y., Dai W.X., Ding X.-R., Zhang Y.T., Zhao N. Multi-wavelength photoplethysmography method for skin arterial pulse extraction. Biomed. Opt. Express. 2016;7:4313–4326. doi: 10.1364/BOE.7.004313. [DOI] [PMC free article] [PubMed] [Google Scholar]
- 41.V-TRUST Oxymeter TD-8250A Pulse. [(accessed on 16 June 2018)]; Available online: https://www.goapotik.com/pulse-oxymeter-v-trust-td-8250a.html.
- 42.Omron HEM-7121 Standard Blood Pressure Monitor. [(accessed on 16 June 2019)]; Available online: https://www.omronhealthcare.com.hk/en/product/ins.php?index_prm_id=15&index_id=12&pr_show_status=1.
- 43.Thomas P.W., Burrus C.S. Digital Filter Design. John Wiley & Sons; New York, NY, USA: 1987. p. 83. [Google Scholar]
- 44.AMS-AS7265X Smart Spectral Sensor. [(accessed on 16 June 2018)]; Available online: https://ams.com/as7265x.
- 45.STS-VIS Data Sheet. [(accessed on 16 June 2018)]; Available online: http://oceanoptics.com/product/sts-vis-microspectrometer/


