

Abstract
Objective
Microbiome analyses now allow precise determination of the sinus microbiota of patients with exacerbations of chronic rhinosinusitis (CRS). The aim of this report is to describe the sinus microbiota of acute exacerbations in CRS clinical subgroups (with nasal polyps [CRSwNP], without nasal polyps [CRSsNP], and allergic fungal rhinosinusitis [AFRS]).
Study Design
Retrospective chart review.
Setting
Tertiary rhinology practice.
Subjects and Methods
A retrospective review was performed of all patients whose sinus microbiota were assayed via a commercially available microbiome technology during an acute CRS exacerbation during the 2-year period ending December 31, 2016. All samples were sinus aspirates collected under endoscopic visualization in clinic.
Results
Samples from a total of 134 patients (65 CRSsNP, 55 CRSwNP, and 14 AFRS) were reviewed. The observed richness (number of taxa >2% relative abundance) ranged between 1 and 11 taxa, with an average of 3 taxa per specimen. The most common bacteria in all groups were Staphylococcal spp (including Staphylococcus aureus), Streptococcus spp, Pseudomonas spp, and Escherichia spp. S aureus had an increased prevalence in CRSsNP and AFRS as compared with CRSwNP. Otherwise, the sinus microbiota were markedly similar among all 3 clinical subgroups.
Conclusions
Many bacterial types are identified during acute CRS exacerbation according to DNA-based detection techniques. Bacterial richness was remarkably low in all samples. Few differences in the patterns among clinical subgroups were observed. Further investigation is warranted to determine the clinical significance of these observations and their role in current clinical algorithms.
Keywords: sinusitis, chronic rhinosinusitis, bacteria, microbiome, 16S rRNA, culture
Chronic rhinosinusitis (CRS) has been divided into the phenotypic subgroups of CRS with nasal polyps (CRSwNP), CRS without nasal polyps (CRSsNP), and allergic fungal rhinosinusitis (AFRS). The pathophysiology of CRS, including the role of microbes in driving the inflammatory process, remains an area of active research.1-3 Microbiome bioinformatics technology now allows for direct identification and quantification of bacteria.4-6 This technology has been used to characterize the sinus microbiota in healthy and various disease states.3 The primary advantage of these molecular techniques is more precise and comprehensive identification of microbes, even in small samples. Practicing clinicians have had access to commercially available laboratories that use DNA-based detection techniques for bacterial identification; however, such assays have not become routine components of the clinical algorithm, possibly owing to the poor understanding of sinus microbiota during acute exacerbations, as well as a lack of evidence confirming improvements from treatment based on such techniques.
The aim of this retrospective report is to report a single rhinology center’s experience with microbiome detection techniques for bacterial identification in a cross section of patients with CRS during acute exacerbation, in an effort to highlight differences among groups as determined by an assay more sensitive than traditional culture.
Methods
Study Design and Population
A retrospective review was performed of microbiome detection results on samples obtained via sinus aspirates at the rhinology clinic during January 1, 2015, to December 31, 2016. The indication for testing in all patients was an acute exacerbation of CRS (defined as the presence of purulence on endoscopy during a symptomatic exacerbation of CRS).7 During this period, parallel conventional cultures were not performed on these patients.
The Committee for the Protection of Human Subjects of The University of Texas Health Science Center at Houston approved the protocol.
Sample Acquisition
All samples were obtained via aspiration of purulent secretions under endoscopic visualization from within the middle meatus or previously opened sinus. To minimize contamination, suction devices were passed through the anterior nasal cavity and directed to their sample site under direct endoscopic visualization, and only then was aspiration performed. After collection, specimens were aseptically transferred to a sterile Dry Transport System tube without media (Puritan Medical Products Company, Guilford, Maine) and shipped via overnight delivery to a CLIA-certified commercial laboratory (Clinical Laboratory Improvement Amendments; MicroGen Diagnostics, formerly Pathogenius, Lubbock, Texas).
16S Sequencing and Data Analysis
This microbiome assay used automated polymerase chain reaction technology to amplify the 16S ribosomal RNA (for bacteria), as previously described (personal communication, Jennifer White and Rick Martin; MicroGen Diagnostics; June 9 and August 3, 2018). Specific methodology is summarized as follows.
Sequencing was performed with the Ion Torrent Personal Genome Machine. Primers 28F GAGTTTGATCNTGGCTCAG and 388R GCTGCCTCCCGTAGGAGT were used to sequence the V1-V2 portion of the bacterial 16S rRNA gene. Amplified DNAs were then pooled and purified by removing small fragments with a column and bead–based method. Purified DNAs were added to the Ion Sphere particles and enriched for sequencing on the Ion Torrent Personal Genome Machine sequencer. Once sequences were obtained, an in-house data pipeline developed at MicroGen Diagnostics processed the FASTQ file. The data analysis pipeline consisted of 2 major stages: the denoising and chimera detection stage and the microbial diversity analysis stage. Denoising was performed by first trimming all sequences back with an internally developed quality trimming algorithm, ensuring that each read had a running average taken across the sequence and was trimmed back at the last base where the total average was >Q25. Prefix-based dereplication was then performed with the USEARCH algorithm,8 and the resulting clusters were cleaned to ensure that each clustered sequence was a minimum of 100 base pairs in length. Operational taxonomic unit (OTU) clustering at 6% divergence was performed on the clusters with the USEARCH algorithm, and each cluster with at least 2-member sequences was compressed to a single representative consensus sequence. The formation of chimeric sequences occurred when an aborted sequence extension was misidentified as a primer and was extended on incorrectly in subsequent polymerase chain reaction cycles.9 Because amplification produced chimeric sequences that stemmed from the combination of ≥2 original sequences, MicroGen Diagnostics performed chimera detection with the de novo method built into UCHIME.10 All chimeric sequences were removed, and base correction was then performed by comparing all raw reads to their nonchimeric consensus cluster. The corrected sequences were then demultiplexed with an internally developed algorithm that ensured that the barcode for each sequence was a 100% match; any sequence that did not contain a valid barcode was removed. These demultiplexed sequences then went through OTU selection process.11 OTU clusters were globally aligned with USEARCH against a database of high-quality sequences derived from the NCBI database.12,13 The output was then analyzed with MicroGen Diagnostics’ internally developed algorithm that assigned taxonomic information to each sequence and then computed and wrote the final analysis files.
Statistical Analysis
Some patients had >1 specimen during the study period; only the first specimen for a patient was included in this review.
Prevalence, abundance, and relative abundance were calculated for identified bacterial genera or species calculated for each clinical subgroup. Prevalence was defined as the percentage of samples with identification of a specific bacterial taxa or species. Since relative abundance was based on the quantity of a specific bacterium in the sample once it was identified, relative abundance was calculated by averaging the load of each bacterial taxon or species only in those samples in which it was identified.
Statistical analysis was performed with R 3.4.2 for analysis and ggplot2 for figure generation,14,15 phyloseq16 to generate alpha diversity metric estimates stratified by diagnosis, and vegan17 to conduct multivariate assessments of the microbial communities stratified by diagnosis. The alpha diversity metrics calculated were observed diversity, Shannon diversity, and inverse Simpson diversity.18 The Kruskal-Wallis test was used to assess differences in alpha diversity among groups, and permutational multivariate analysis of variance was used with the Bray-Curtis distance metric to test if the diagnosis groups had different centroids in multidimensional ordinal space and if the dispersion of the groups was statistically different. Analysis of similarities was used to assess if the similarity among groups was greater than the similarity within groups. The Wilcoxon rank sum test was used to assess for differences in relative abundance of specific taxa.
Results
A total of 206 specimens were collected in 134 patients (75 men and 59 women; mean age, 52.7 years) ( Table 1 ). Only the first specimen from each patient was used in this analysis (n = 134). The primary diagnosis was CRSsNP in 65 patients (48.5%), CRSwNP in 55 patients (41.0%), and AFRS in 14 patients (10.4%). Reported comorbid conditions included allergy in 66 patients (48.9%), asthma in 56 patients (41.5%), and aspirin sensitivity in 9 patients (6.7%). Oral antibiotics were used in the 4 weeks prior to when the sample was taken in 43 patients (31.9%), and topical antibiotic irrigations were reported in 21 patients (15.6%) in the 4 weeks prior to sample collection.
Table 1.
Patient Demographics.a
| All Patients | AFRS | CRSwNP | CRSsNP | |
|---|---|---|---|---|
| Age, y | 52.7 ± 17.2 | 36.1 ± 16.4 | 53.2 ± 15.8 | 55.9 ± 16.8 |
| Male:female, n | 75:59 | 6:8 | 33:22 | 36:29 |
| Allergy | 48.9 | 71.4 | 60.0 | 36.4 |
| Asthma | 41.5 | 35.7 | 69.1 | 19.7 |
| Aspirin sensitivity | 6.7 | 0 | 12.7 | 3.0 |
| Previous sinus surgery | ||||
| At any time | 91.9 | 100 | 98.2 | 86.2 |
| During the prior month | 8.2 | 0 | 10.9 | 7.7 |
| Antibiotics during the prior month | ||||
| Oral | 31.9 | 35.7 | 30.9 | 31.8 |
| Topical | 15.6 | 7.1 | 18.2 | 15.2 |
| Steroids during the prior month | ||||
| Oral | 11.9 | 28.6 | 10.9 | 9.2 |
| Topical sprays | 29.9 | 28.6 | 34.5 | 26.2 |
| Topical irrigations | 25.4 | 28.6 | 40.0 | 12.3 |
Abbreviations; AFRS, allergic fungal rhinosinusitis; CRSsNP, chronic rhinosinusitis without nasal polyps; CRSwNP, chronic rhinosinusitis with nasal polyps.
Values are presented as percentages unless noted otherwise.
Twenty-eight distinct taxa were identified, with 27 taxa resolved to the genus level and 1 taxon resolved to the order level; some genera, such as Staphylococcus spp, were further identified to the species level. Additionally, categories designated “unknown bacteria,” “unknown anaerobe,” and “unknown aerobe” were utilized when the bacterial taxonomy could not be identified to the order level. Any bacterial taxa present within a sample at <2% was collapsed into a category labeled “rare taxa” (present in 97.8% of samples). These rare taxa accounted for an average of 8.8% of samples.
Among all samples ( Figure 1 ), staphylococci were the most prevalent (37.0%), with a mean relative abundance of 21.3%. The bacterial taxa with the highest prevalence overall were Streptococcus spp (31.1%), Pseudomonas spp (20.0%), Staphylococcus aureus (20.0%), and Staphylococcus epidermidis (11.9%). Of the bacteria identified, those with the highest relative abundance were Staphylococcus spp (21.3%), Pseudomonas spp (15.0%), Streptococcus spp (14.4%), and S aureus (12.4%; Figure 2 ).
Figure 1.

Heat map of prevalence for detected bacterial taxa, stratified by clinical subgroup. AFRS, allergic fungal rhinosinusitis; CRSsNP, chronic rhinosinusitis without nasal polyps; CRSwNP, chronic rhinosinusitis with nasal polyps.
Figure 2.

Box and whisker plots of relative abundance, stratified by primary diagnosis and bacterial taxa. AFRS, allergic fungal rhinosinusitis; CRSsNP, chronic rhinosinusitis without nasal polyps; CRSwNP, chronic rhinosinusitis with nasal polyps.
No consistent differences among subgroups were noted; that is, the various bacterial taxa and species were present in all clinical subgroups ( Tables 2 and 3 , Figure 1 ). Additionally, the samples did not cluster by subgroup via principal component analysis ( Figure 3 ).
Table 2.
Prevalence of Bacterial Stratified by Clinical Subgroups.a
| Relative Abundance, % | |||
|---|---|---|---|
| Bacteria | AFRS | CRSsNP | CRSwNP |
| Acinetobacter spp | 3.00 | 1.80 | |
| Actinomyces spp | 1.80 | ||
| Anaerococcus spp | 7.10 | 1.50 | 1.80 |
| Bacillus spp | 3.60 | ||
| Burkholderiales order | 13.60 | 3.60 | |
| Clostridium spp | 3.00 | ||
| Corynebacterium spp | 7.10 | 10.60 | 10.90 |
| Enterobacter spp | 7.10 | 6.10 | 10.90 |
| Enterococcus spp | 1.50 | ||
| Escherichia spp | 21.40 | 12.10 | 7.30 |
| Finegoldia spp | 3.60 | ||
| Fusobacterium spp | 7.60 | 7.30 | |
| Haemophilus spp | 7.10 | 6.10 | 10.90 |
| Klebsiella spp | 3.00 | 5.50 | |
| Lactobacillus spp | 3.00 | 3.60 | |
| Moraxella | 14.30 | 4.50 | 7.30 |
| Neisseria spp | 3.00 | ||
| Other aerobes | 14.30 | 5.50 | |
| Other anaerobe | 7.10 | 3.00 | 1.80 |
| Peptostreptococcus spp | 1.50 | ||
| Porphyromonas spp | 6.10 | 1.80 | |
| Prevotella spp | 12.10 | 9.10 | |
| Propionibacterium spp | 7.60 | 7.30 | |
| Pseudomonas spp | 28.60 | 15.20 | 23.60 |
| Rare taxa | 100 | 97.00 | 98.20 |
| Rothia spp | 1.50 | ||
| Serratia spp | 4.50 | 7.30 | |
| Staphylococcus aureus | 28.60 | 22.70 | 14.50 |
| Staphylococcus epidermidis | 7.10 | 12.10 | 12.70 |
| Staphylococcus lugdunensis | 7.10 | 9.10 | 1098.00 |
| Staphylococcus sppb | 42.90 | 37.90 | 34.50 |
| Stenotrophomonas spp | 13.60 | 9.10 | |
| Unknown bacteria | 3.00 | 3.60 | |
| Vellionella spp | 3.00 | 1.80 | |
Abbreviations; AFRS, allergic fungal rhinosinusitis; CRSsNP, chronic rhinosinusitis without nasal polyps; CRSwNP, chronic rhinosinusitis with nasal polyps.
Relative abundance was calculated by averaging the load of a specific bacterial taxon in samples in which it was identified. Blank cells indicate not detected. Any bacterial taxon present within a sample at <2% was collapsed into a category labeled “rare taxa.”
Staphylococcus species includes S aureus, S epidermidis, and S lugdunensis.
Table 3.
Relative Abundance of Bacterial Taxa Stratified by Clinical Subgroup.a
| Relative Abundance, % | |||
|---|---|---|---|
| Bacteria | AFRS | CRSsNP | CRSwNP |
| Acinetobacter spp | 0.11 | 0.13 | |
| Actinomyces spp | 0.04 | ||
| Anaerococcus spp | 7.07 | 0.08 | 0.24 |
| Bacillus spp | 1.85 | ||
| Burkholderiales order | 4.57 | 1.09 | |
| Clostridium spp | 0.14 | ||
| Corynebacterium spp | 5.71 | 2.80 | 2.09 |
| Enterobacter spp | 0.86 | 2.00 | 2.40 |
| Enterococcus spp | 1.49 | ||
| Escherichia spp | 15.14 | 4.82 | 4.85 |
| Finegoldia spp | 0.36 | ||
| Fusobacterium spp | 1.54 | 1.71 | |
| Haemophilus spp | 1.43 | 3.20 | 6.45 |
| Klebsiella spp | 1.35 | 1.53 | |
| Lactobacillus spp | 0.98 | 0.15 | |
| Moraxella spp | 6.71 | 1.32 | 5.38 |
| Neisseria spp | 0.42 | ||
| Other aerobes | 1.21 | 0.35 | |
| Other anaerobe | 1.36 | 0.08 | 0.09 |
| Peptostreptococcus spp | 0.03 | ||
| Porphyromonas spp | 2.32 | 0.15 | |
| Prevotella spp | 3.48 | 2.56 | |
| Propionibacterium spp | 1.14 | 0.64 | |
| Pseudomonas spp | 20.29 | 12.08 | 17.11 |
| Rare taxa | 2.93 | 11.34 | 7.31 |
| Rothia spp | 0.17 | ||
| Serratia spp | 3.26 | 2.07 | |
| Staphylococcus aureus | 21.71 | 12.75 | 9.58 |
| Staphylococcus epidermidis | 2.21 | 3.45 | 4.20 |
| Staphylococcus lugdunensis | 0.14 | 4.75 | 4.51 |
| Staphylococcus spp other | 0.54 | 2.16 | |
| Staphylococcus sppb | 24.07 | 21.49 | 20.45 |
| Stenotrophomonas spp | 6.86 | 3.87 | |
| Streptococcus spp | 13.21 | 12.78 | 16.62 |
| Unknown bacteria | 0.06 | 0.35 | |
| Vellionella spp | 0.09 | 0.16 | |
Abbreviations: AFRS, allergic fungal rhinosinusitis; CRSsNP, chronic rhinosinusitis without nasal polyps; CRSwNP, chronic rhinosinusitis with nasal polyps.
Relative abundance was calculated by averaging the load of a specific bacterial taxon in samples in which it was identified. Blank cells indicate not detected. Any bacterial taxon present within a sample at <2% was collapsed into a category labeled “rare taxa.”
Staphylococcus species includes S aureus, S epidermidis, and S lugdunensis.
Figure 3.
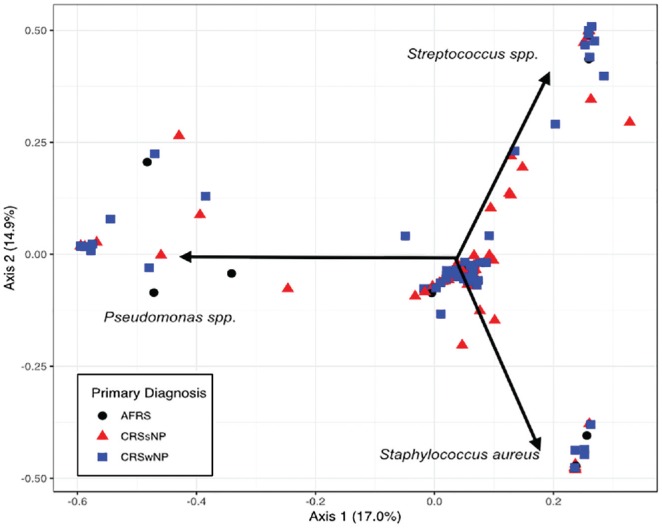
Ordination of samples by primary diagnosis. A Bray-Curtis dissimilarity matrix was used to generate a principal component analysis showing that the samples do not cluster by primary diagnosis. The primary bacterial drivers of variability within these samples were Pseudomonas spp, Streptococcus spp, and Staphylococcus aureus. AFRS, allergic fungal rhinosinusitis; CRSsNP, chronic rhinosinusitis without nasal polyps; CRSwNP, chronic rhinosinusitis with nasal polyps.
Staphylococcus spp had similar prevalence and relative abundance rates in the subgroups: AFRS (42.9% and 24.1%), CRSsNP (37.9% and 21.5%), and CRSwNP (34.5% and 20.5%). The prevalence of S aureus was similar in the AFRS (28.6%) and CRSsNP (22.7%) groups and less in the CRSwNP group (14.5%), whereas its relative abundance was greater in the AFRS group (21.7%) than in the CRSsNP (12.8%) and CRSwNP (9.6%) subgroups ( Figure 2 ). Pseudomonas spp had a greater prevalence and relative abundance in AFRS (prevalence, 28.6%; relative abundance, 20.3%) as compared with CRSsNP (prevalence, 15.2%; relative abundance, 12.1%) and CRSwNP (prevalence, 23.6%; relative abundance, 17.1%). Streptococcus spp had a relatively high prevalence in all subgroups (AFRS, 35.7%; CRSsNP, 27.3%; CRSwNP, 34.5%) but more modest relative abundance (AFRS, 13.2%; CRSsNP, 12.8%; CRSwNP, 16.6%). We did not observe a significant difference in the relative abundances of particular taxa when comparing groups with the Wilcoxon rank sum test. Additionally, we did not observe a significant difference in the dispersion (permutational multivariate analysis of variance; P = .779) or variance (analysis of similarities; P = .823) when comparing the 3 diagnosis groups.
The observed richness (the number of taxa observed >2%) for the samples ranged between 1 and 11 taxa. Most samples had between 1 and 4 observed taxa, with an average of 3 taxa per specimen isolated among all 3 subgroups. Low complexity of the samples was also seen in the other alpha diversity metrics with the Shannon diversity estimates, primarily <1.5, and the inverse Simpson estimates, primarily <2. Each of these metrics agrees with the observed diversity and the observation that most samples are dominated by a single taxon or a small consortium with the remaining taxa in the sample at low abundance ( Figure 4 ). We did not find any differences in the alpha diversity when comparing the 3 diagnosis groups, with P values of .93 (observed), .99 (Shannon), and .99 (inverse Simpson).
Figure 4.

Alpha diversity metrics stratified by clinical subgroup. AFRS, allergic fungal rhinosinusitis; CRSsNP, chronic rhinosinusitis without nasal polyps; CRSwNP, chronic rhinosinusitis with nasal polyps.
Discussion
This report summarizes the sinus microbiota identified with microbiome analyses from a commercially available laboratory in patients with acute exacerbations of CRS. Many bacterial taxa were identified; of note, no differences were noted among the clinical CRS subgroups characterized by the presence or absence of polyps or defining characteristics of AFRS. Unsurprisingly, S aureus and related staphylococcal species had a high prevalence but exhibited a comparatively lower level of relative abundance even in acute exacerbations. A key finding of this study was the low level of diversity in acute exacerbation CRS, wherein 1 or a few opportunistic pathogens appear to “bloom” or become overrepresented in the local microbiome, suggesting that the presence of a diverse healthy community may prevent acute exacerbations from occurring. Thus, this report begins to elucidate the microbiota of patients with CRS during acute exacerbations from a long-term clinical perspective.
Twenty years ago, Lanza and Kennedy described their experience with conventional cultures in a tertiary rhinology practice and emphasized emerging patterns of antibiotic resistance among bacterial isolates obtained with conventional microbiology techniques, which identified a relatively small number of bacterial pathogens (coagulase-negative Staphylococcus, 28%; Pseudomonas aeruginosa, 17%; S aureus, 13%; and others).19 Kingdom and Swain reported similar results in samples obtained from patients undergoing sinus surgery and observed a high prevalence of antimicrobial resistance in CRS.20 The high prevalence of S aureus, other Staphylococcus species, and Pseudomonas in the current report is consistent with prior reports based on conventional cultures. Hauser et al compared conventional cultures and 16S ribosomal RNA gene sequencing for identification of bacteria in patients undergoing sinus surgery and concluded that conventional cultures do not adequately describe the bacteria identified with molecular techniques.4 The current report is consistent with this observation, as a large number of bacterial taxa were identified across the entire patient population.
MicroGen Diagnostics provides species-level identification for S aureus, S epidermidis, and Staphylococcus lugdunensis through 16S rRNA sequencing, which is not often available in many bacterial microbiome pipelines. Staphylococcal speciation is possible under certain technical circumstances21; here, by spanning 2 variable regions (V1 and V2) of the 16S rRNA gene that can differentiate staphylococcal species, the laboratory’s sequencing methodology for identification at the species level has been validated by MicroGen Diagnostics with reverse transcription polymerase chain reaction.
S aureus has been implicated as a driver of CRSwNP through enterotoxins that function as superantigens that trigger and sustain an excessive inflammatory response.22 Similarly, S aureus has been associated as a factor in AFRS.23 In the current report, S aureus had an overall prevalence of only 20.0%, with greater prevalence in the AFRS subgroup (28.6%) and the CRSsNP subgroup (22.7%) as compared with the CRSwNP subgroup (14.5%). Other staphylococcal species were common in all 3 subgroups. The relatively low levels of S aureus suggest that its overgrowth by itself may not be the primary cause of acute exacerbations of CRS (or the CRS subgroups). Alternatively, S aureus may be pathoetiologic factor in a poorly defined subset of patients with CRS.
Abreu et al reported an increase in the relative abundance of Corynebacterium tuberculostearicum and a relative depletion of other lactic acid bacteria in patients with CRS; in a murine model, they confirmed the pathogenicity of this Corynebacterium species and showed protective effects for Lactobacillus sakei.24 In the current patient series, Corynebacterium species had an overall prevalence of only 10.4% and a relative abundance of only 2.8%. These results may be viewed as being inconsistent with Corynebacterium species playing a major role in acute CRS exacerbations, although we cannot exclude this role in select patients.
Interestingly, the AFRS clinical subgroup seemed to have differences when compared with the CRSwNP and CRSsNP subgroups. For instance, Burkholderiales order and Stenotrophomonas species were not detected in the AFRS group. This low prevalence is difficult to explain, especially since other gram-negative bacilli (including Pseudomonas species) were found in the AFRS group at a relatively high prevalence (28.6%). In addition, anaerobic bacteria were not detected in the AFRS subgroup. This finding may be explained by the fact that all of the patients with AFRS had prior surgery (and “large” sinus cavities); their “open” sinus anatomy would mitigate against the anaerobic microenvironments that anaerobes prefer.
An important aim of the current study was to assess the microbiome of acute exacerbations of CRSwNP, CRSsNP, and AFRS to examine differential patterns in each clinical subgroup. Clearly, no such pattern is apparent. Although the clinical phenotypes of CRSwNP, CRSsNP, and AFRS in chronic disease states are distinct, these defined clinical phenotypes share similar microbiologic profiles during acute exacerbations. Clinicians must tailor treatments to individual patients rather than the broad phenotype categories to which patients are assigned.
Practicing clinicians can correlate endoscopic findings (ie, purulence) with clinical symptoms (exacerbation of sinonasal symptoms) to diagnose acute exacerbations CRS and obtain samples for study, especially in patients who have undergone sinus surgery. Analysis of the microbiome offers a context in which to interpret a more comprehensive identification of putative pathogens in a specimen. These techniques provide relative abundance data that show the predominant organisms in each sample in contrast to the relatively crude semiquantitative reporting of conventional cultures. A criticism of molecular assays is the absence of functional assessment of antimicrobial resistance. Current molecular techniques can directly determine the presence of antibiotic resistance genes for many common antimicrobials, including vancomycin and methicillin. Detection of a resistance gene does not necessarily demonstrate expression of that gene. Regardless, clinicians may use these results for guidance in the selection of antimicrobial agents. It should be mentioned that the utility of such tests in the clinical management of acute CRS exacerbations has yet to be evaluated.
This retrospective report has several intrinsic limitations. As a retrospective cross-sectional study performed in a referral center, it required an abstraction of data from a patient cohort with complex and unique medical histories, including prior antibiotics in the months before presentation for an acute exacerbation. Samples were collected by 3 attending surgeons, who each may have a unique threshold for collecting a specimen. While the overall sample size is large (>100 patients), our clinical subgroups were much smaller; this has implications for comparisons among these subgroups, creating a potential for type II error, particularly in the assessment of low-abundance organisms. Species-level taxonomic assignments can be uncertain with current 16S-targeted sequence-based methodologies, as the 16S genes of bacteria within the same genus can be very similar and the regions of the 16S gene do not always cover the needed sequence variability to confidently differentiate closely related species. Therefore, assessment of Staphylococcus, Streptococcus, Pseudomonas, and Corynebacterium species are not often made. The data reported from similar microbiome studies are obtained and presented in many ways, making cross-study comparisons difficult. Furthermore, the results in this report were from a commercially focused laboratory; while this laboratory is CLIA licensed and appropriate quality control measures are mandated,25 it uses proprietary technology that cannot be freely accessed and reported. Finally, while microbiome technology provides extensive information about microbial gene presence, these techniques cannot distinguish between active, viable organisms and inactive or dead organisms.
Conclusion
This study describes the microbiome of sinus aspirates obtained during acute exacerbations of CRS. Many bacterial taxa were present, but no unique bacterial signatures among the clinical subgroups of CRSwNP, CRSsNP, and AFRS were identified. Thus, the microbiome of CRS exacerbations seems to be unique to each patient; for this reason, clinicians should consider tailoring antibiotic treatments to individual patients rather than make generalizations based on the phenotypes assigned to each patient. Further studies will be necessary to define the clinical significance of these observations.
Author Contributions
Laura J. Vandelaar, data acquisition, analysis and interpretation, revision and final approval of work; Blake Hanson, analysis and interpretation of work, revision and final approval of work; Michael Marino, conception and design of the work, data acquisition, interpretation of the data, revision and final approval of work; William C. Yao, acquisition of data, revision and final approval of work; Amber U. Luong, acquisition of data, revision and final approval of work; Cesar A. Arias, conception and design of the work, revision and final approval of work; Vijay Ramakrishnan, analysis and interpretation of data, revision and final approval of work; Martin J. Citardi, conception and design of the work, data acquisition, interpretation, drafting and revising the work, final approval.
Disclosures
Competing interests: William C. Yao, speaker for Optinose. Amber U. Luong, consultant for Aerin Medical, Arrinex, Lyra Therapeutics, Medtronic, and Stryker. She is on the advisory board for ENTvantage and 480 Biomedical. She has funding from Genetech/Roche and AstraZeneca and is part of the speaker’s bureau for Intersect ENT. Cesar A. Arias, grant support from Entasis, Merck, and MeMed Diagnostics. He receives chapter author royalties from UpToDate. Vijay Ramakrishnan, consultant for Medtronic, Inc, and Optinose, which are not affiliated with this investigation, and supported by a grant from the National Institute on Deafness and Other Communication Disorders, National Institutes of Health (K23DC014747). This funding organization did not contribute to the design or conduct of this study, preparation, review, approval, or decision to submit this manuscript for publication. Martin J. Citardi, consultant for Acclarent, Intersect ENT, Medical Metrics, and Stryker.
Sponsorships: None.
Funding source: None.
Acknowledgments
We acknowledge MicroGen Diagnostics (formerly Pathogenius) for its data download services and assistance with its description of its proprietary molecular diagnostic techniques.
Footnotes
Sponsorships or competing interests that may be relevant to content are disclosed at the end of this article.
References
- 1. Ramakrishnan VR, Hauser LJ, Feazel LM, Ir D, Robertson CE, Frank DN. Sinus microbiota varies among chronic rhinosinusitis phenotypes and predicts surgical outcome. J Allergy Clin Immunol. 2015;136:334-342.e1. [DOI] [PubMed] [Google Scholar]
- 2. Psaltis AJ, Wormald PJ. Therapy of sinonasal microbiome in CRS: a critical approach. Curr Allergy Asthma Rep. 2017;17:59. [DOI] [PubMed] [Google Scholar]
- 3. Ramakrishnan VR, Hauser LJ, Frank DN. The sinonasal bacterial microbiome in health and disease. Curr Opin Otolaryngol Head Neck Surg. 2016;24:20-25. [DOI] [PMC free article] [PubMed] [Google Scholar]
- 4. Hauser LJ, Feazel LM, Ir D, et al. Sinus culture poorly predicts resident microbiota. Int Forum Allergy Rhinol. 2015;5:3-9. [DOI] [PubMed] [Google Scholar]
- 5. Jervis Bardy J, Psaltis AJ. Next generation sequencing and the microbiome of chronic rhinosinusitis: a primer for clinicians and review of current research, its limitations, and future directions. Ann Otol Rhinol Laryngol. 2016;125:613-621. [DOI] [PubMed] [Google Scholar]
- 6. Feazel LM, Frank DN, Ramakrishnan VR. Update on bacterial detection methods in chronic rhinosinusitis: implications for clinicians and research scientists. Int Forum Allergy Rhinol. 2011;1:451-459. [DOI] [PubMed] [Google Scholar]
- 7. Orlandi RR, Kingdom TT, Hwang PH, et al. International consensus statement on allergy and rhinology: rhinosinusitis. Int Forum Allergy Rhinol. 2016;6:S22-S209. [DOI] [PubMed] [Google Scholar]
- 8. Edgar RC. Search and clustering orders of magnitude faster than BLAST. Bioinformatics. 2010;26:2460-2461. [DOI] [PubMed] [Google Scholar]
- 9. Haas BJ, Gevers D, Earl AM, et al. Chimeric 16S rRNA sequence formation and detection in Sanger and 454-pyrosequenced PCR amplicons. Genome Res. 2011;21:494-504. [DOI] [PMC free article] [PubMed] [Google Scholar]
- 10. Edgar RC, Haas BJ, Clemente JC, Quince C, Knight R. UCHIME improves sensitivity and speed of chimera detection. Bioinformatics. 2011;27:2194-200. [DOI] [PMC free article] [PubMed] [Google Scholar]
- 11. Edgar RC. UPARSE: highly accurate OTU sequences from microbial amplicon reads. Nat Methods. 2013;10(10):996-998. [DOI] [PubMed] [Google Scholar]
- 12. Benson DA, Karsch-Mizrachi I, Lipman DJ, Ostell J, Sayers EW. GenBank. Nucleic Acids Res. 2009;37(database issue):D26-D31. [DOI] [PMC free article] [PubMed] [Google Scholar]
- 13. Sayers EW, Barrett T, Benson DA, et al. Database resources of the National Center for Biotechnology Information. Nucleic Acids Res. 2009;37(database issue):D5-D15. [DOI] [PMC free article] [PubMed] [Google Scholar]
- 14. R Development Core Team. R: A Language and Environment for Statistical Computing. Vienna, Austria: R Foundation for Statistical Computing; 2013. [Google Scholar]
- 15. Wickham H. Ggplot2 Elegant Graphics for Data Analysis. Vol 35 New York, NY: Springer-Verlag; 2009. [Google Scholar]
- 16. McMurdie PJ, Holmes S. Phyloseq: an R package for reproducible interactive analysis and graphics of microbiome census data. PLoS One. 2013;8:e61217. [DOI] [PMC free article] [PubMed] [Google Scholar]
- 17. Dixon P. VEGAN: a package of R functions for community ecology. J Veg Sci. 2003;14:927-930. [Google Scholar]
- 18. Fisher RA, Corbet AS, Williams CB. The relation between the number of species and the number of individuals in a random sample of an animal population. J Anim Ecol. 1943;12:42-58. [Google Scholar]
- 19. Hsu J, Lanza DC, Kennedy DW. Antimicrobial resistance in bacterial chronic sinusitis. Am J Rhinol. 1998;12:243-248. [DOI] [PubMed] [Google Scholar]
- 20. Kingdom TT, Swain RE. The microbiology and antimicrobial resistance patterns in chronic rhinosinusitis. Am J Otolaryngol. 2004;25:323-328. [DOI] [PubMed] [Google Scholar]
- 21. Watts GS, Youens-Clark K, Slepian MJ, et al. 16S rRNA gene sequencing on a benchtop sequencer: accuracy for identification of clinically important bacteria. J Appl Microbiol. 2017;123:1584-1596. [DOI] [PMC free article] [PubMed] [Google Scholar]
- 22. Bachert C, Zhang N, Patou J, Van Zele T, Gevaert P. Role of staphylococcal superantigens in upper airway disease. Curr Opin Allergy Clin Immunol. 2008;8:34-38. [DOI] [PubMed] [Google Scholar]
- 23. Clark DW, Wenaas A, Luong A, Citardi MJ, Fakhri S. Staphylococcus aureus prevalence in allergic fungal rhinosinusitis vs other subsets of chronic rhinosinusitis with nasal polyps. Int Forum Allergy Rhinol. 2013;3:89-93. [DOI] [PubMed] [Google Scholar]
- 24. Abreu NA, Nagalingam NA, Song Y, et al. Sinus microbiome diversity depletion and Corynebacterium tuberculostearicum enrichment mediates rhinosinusitis. Sci Transl Med. 2012;4:151ra124. [DOI] [PMC free article] [PubMed] [Google Scholar]
- 25. MicroGen Diagnostics. About MicroGen DX. https://microgendx.com/about-microgen-dx/. Published 2018. Accessed February 28, 2018.