

Abstract
Several previous studies have linked the Parkinson’s disease (PD) gene LRRK2 to the biology of microglia cells. However, the precise ways in which LRRK2 affects microglial function have not been fully resolved. Here, we used the RNA-Sequencing to obtain transcriptomic profiles of LRRK2 wild-type (WT) and knock-out (KO) microglia cells treated with α-synuclein pre-formed fibrils (PFFs) or lipopolysaccharide (LPS) as a general inflammatory insult. We observed that, although α-synuclein PFFs and LPS mediate overlapping gene expression profiles in microglia, there are also distinct responses to each stimulus. α-Synuclein PFFs trigger alterations of oxidative stress-related pathways with the mitochondrial dismutase Sod2 as a strongly differentially regulated gene. We validated SOD2 at mRNA and protein levels. Furthermore, we found that LRRK2 KO microglia cells reported attenuated induction of mitochondrial SOD2 in response to α-synuclein PFFs, indicating a potential contribution of LRRK2 to oxidative stress-related pathways. We validate several genes in vivo using single-cell RNA-Seq from acutely isolated microglia after striatal injection of LPS into the mouse brain. Overall, these results suggest that microglial LRRK2 may contribute to the pathogenesis of PD via altered oxidative stress signaling.
Keywords: LRRK2, Microglia, α-Synuclein, Parkinson’s disease, Neuroinflammation, Oxidative stress
1. Introduction
Mutations in the gene encoding Leucine-rich repeat kinase-2 (LRRK2) cause a dominantly inherited form of Parkinson’s disease (PD) (Paisán-Ruíz et al., 2004; Zimprich et al., 2004). In addition, common variations in the LRRK2 locus act as risk factors for the development of PD (Simón-Sánchez et al., 2009). Due to the similarities in the clinical and neuropathological phenotypes of LRRK2-related and sporadic PD (Aasly et al., 2005; Haugarvoll et al., 2008), understanding the mechanisms behind mutant LRRK2 neurodegeneration may offer new insights into the pathological mechanisms underlying sporadic PD.
LRRK2 is expressed in the brain although it shows higher expression in organs such as lungs and kidneys (Biskup et al., 2007). At the cellular level, LRRK2 is expressed in both neuronal and non-neuronal cells including in microglia (Moehle et al., 2012). Microglia cells, the resident macrophages of the brain, are known to play important roles in neuroinflammation [reviewed in (Perry and Holmes, 2014)]. In response to a pathological stimulus, microglia switch from a resting state to an activated phenotype and release pro-inflammatory and reactive oxygen species (ROS) components to mediate the inflammatory response aimed at removing foreign materials or pathogens by phagocytosis (Garden and Möller, 2006). Although a well-regulated inflammatory process is essential for tissue repair and brain integrity, excessive and prolonged inflammation can lead to significant tissue and cellular damage (Gao and Hong, 2008). Increased numbers of reactive microglia have been observed in the vicinity of dopaminergic neurons in the substantia nigra pars compacta of PD post-mortem brains (McGeer et al., 1988; Mogi et al., 1994), suggesting that activated microglia cells contribute to neurodegeneration in PD. Given that LRRK2 is expressed in microglia, it is likely that this gene contributes to the PD pathogenesis via altered neuroinflammatory signaling [reviewed in (Russo et al., 2014; Tansey and Goldberg, 2010)].
Multiple lines of evidence suggest that a key trigger for neuroinflammation in PD is α-synuclein, which is also encoded by a gene for PD, SNCA. While α-synuclein is normally a synaptic protein, activation of microglia can be triggered by aggregated forms of α-synuclein released by degenerating neurons or actively secreted through exosomes by stressed neurons [reviewed in (Kim et al., 2013; Russo et al., 2012; Zhang et al., 2005). Several in vitro (Bliederhaeuser et al., 2016; Hoenen et al., 2016; Hoffmann et al., 2016; Russo et al., 2015) and in vivo (Sacino et al., 2014; Theodore et al., 2008) studies have demonstrated that extracellular pathological forms of α-synuclein can activate microglia cells and initiate the inflammatory process. However, the molecular pathways by which α-synuclein induces microglial activation remain poorly defined.
In an attempt to dissect novel LRRK2-related molecular pathways in microglia, we performed an RNA sequencing (RNA-Seq) analysis of LRRK2 wild-type (WT) and knock-out (KO) cells under basal conditions or after stimulation with α-synuclein pre-formed fibrils (PFFs) or with the more general inflammagen lipopolysaccharide (LPS). We found that, although LPS and α-synuclein PFFs have overlapping effects on gene expression, α-synuclein PFFs additionally induce a specific microglial response associated with oxidative stress. Specifically, we found that treatment with α-synuclein PFFs causes a significant induction of the antioxidant superoxide dismutase-2 (SOD2) enzyme in WT cells, which effect is attenuated in LRRK2 KO microglia cells. Thus, starting from an unbiased RNA-Seq approach, we reveal that α-synuclein PFFs activate oxidative stress-associated signaling and that LRRK2 positively contributes to this microglial process.
2. Materials and methods
2.1. Animals and primary microglia cultures
All animal procedures were carried out in strict accordance with the recommendations issued in the guidelines for the Care and Use of Laboratory Animals of the National Institutes of Health (NIH) for animals housed at NIH and for the European Community Council Directive 2010/63/UE for animals housed at University of Padova. The protocols were approved by the Institutional Animal Care and Use Committees of the US National Institute on Aging (Approval number 463-LNG-2018) and by Ethics Committee of the University of Padova (Project ID: 104½016-PR), respectively. Primary microglia were derived from postnatal days 1–4 (P1–4) LRRK2 WT and KO mice as recently described (Russo et al., 2015). We used two different LRRK2 KO mice, both bred to be congenic on a C57Bl6/J background. LRRK2 exon-2 KO mice (Parisiadou et al., 2009) were used for the initial RNA-Seq experiment, for technical validation experiments and to confirm time course data at the mRNA level. Additionally, LRRK2 exon-41 KO mice (Hinkle et al., 2012) were used to further validate time course data at protein level and differences between genotypes.
2.2. Inflammatory stimuli and cell treatments
Human α-synuclein PFFs were generated from recombinant α-synuclein produced by a lipid A mutant of Escherichia coli, BL21(DE3) with decreased endotoxin production as described (Russo et al., 2015). After purification, α-synuclein was incubated for 15 days to induce aggregation. α-Synuclein fibrils were then quantified in terms of monomer concentration. Specifically, the equivalent monomer concentration in the fibrils preparation was calculated by the difference between the starting monomer concentration and the residual supernatant monomer concentration after fibrillation. Successively, microglia were treated with 25 μM α-synuclein PFFs or LPS from Escherichia coli O111:B4 at 100 ng/ml (Sigma-Aldrich, L4391), both resuspended in phosphate-buffered saline (PBS). During treatments, primary microglia cells were cultured in medium containing 1% FBS.
To perform RNA-Seq, microglia cells were maintained for 8h with α-synuclein PFFs or 1 h with LPS treatment. This difference of timing is based on the different ability of the two stimuli to induce inflammation, as prior data shows that microglia treated with α-synuclein PFFs exhibited a delayed inflammatory response compared with cells treated with LPS priming (Russo et al., 2015). Treatments and genotypes were randomized across batches of primary cell preparations. For additional validation, time course experiments were performed where cells were treated for 0, 1, 4, 8 and 16 h (for mRNA analysis) and 0, 8 and 16 h (for protein analysis) with α-synuclein PFFs or LPS.
2.3. RNA extraction and sequencing
RNA extraction was performed as described (Russo et al., 2015). RNA quality was measured using a Agilent 2100 Bioanalyzer RNA 6000 Nano Chip (Agilent) and samples had a mean RNA integrity number of 9.0 (Supplementary Table 1). We purified rRNA depleted RNA starting from 1 μg total RNA, then synthesized cDNA libraries using TruSeq stranded Total RNA library prep kit (Illumina, RS-122–9008) following manufacturer’s instructions (https://support.illumina.com/content/dam/illumina-support/documents/documentation/chemistry_documentation/samplepreps_truseq/truseqstrandedtotalrna/truseqstranded-total-rna-sample-prep-ls-euc-ltf-15031060-e.pdf). Before sequencing, cDNA libraries were quantified by digital-PCR using a ddPCR Library quantification kit (Biorad). Subsequently, cDNA libraries were multiplexed with 4 samples per pool and 7pM of each pool hybridized to a flow cell following cluster generation using an Illumina cluster station. Libraries were sequenced on Illumina HiSeq2500 (Illumina) to generate ~35 million of 100-bp single end reads per library (Supplementary Table 1).
2.4. Statistical analysis of gene expression
RNA-Seq reads were aligned to the mouse reference genome (mm10) using STAR (Dobin et al., 2013) and expression counts per transcript quantified using eXpress (Roberts and Pachter, 2013). Preliminary inspection of the data identified expression of the astrocyte marker GFAP, likely due to small numbers of contaminating astrocytes in the microglial preparations. We therefore used population specific expression analysis [PSEA - (Kuhn et al., 2012)] to estimate the proportions of astrocytes per sample. From the raw counts per transcript, we used DESEQ2 (Love et al., 2014) to normalize data and estimate differential expression between groups using the generalized linear model:
Transcript Expression~group + shake + Pday + Astrocyte
where group represent the combined experimental variables of genotype and treatment while the remaining terms are technical variables describing the batch of cells used (shake), postnatal day of the animals in that batch (Pday) and the proportion of contaminating astrocytes from the PSEA analysis. We generated a table containing contrasts for all levels of group, ie for each treatment in each genotype, then filtered out any genes that showed significant (uncorrected p < .05) association with Astrocytes.
2.5. Gene expression validation by qRT-PCR
We synthesized cDNA from Trizol-extracted RNA using the SuperScript III First-Strand Synthesis System (Invitrogen). To analyze cDNA expression of the RNA-Seq top hits, we used the Applied Biosystems 7900HT Real-time PCR system with TaqMan probes and fast advanced master mix (Applied Biosystems) following the manufacturer’s instructions. We used the following probes: Lrrk2 (ID: Mm01304127_g1), Il-1β (ID: Mm00434228_m1), Sod2 (ID: Mm01313000_m1), C5ar2 (ID: Mm01267981_s1), H2-M2 (ID: Mm01279077_g1), Irg1 (ID: Mm01224532_m1), Txnip (ID: Mm01265659_g1) and NFKBiz (ID: Mm00600522_m1). We used Ppid (ID: Mm00835365_g1) as a reference gene for genes with low expression and Gapdh (ID: 99999915_g1) as a reference for genes with high expression.
2.6. Protein validation using immunoblotting
Cells were washed with PBS and solubilized with lysis buffer (20 mM Tris-HCl pH 7.5, 150 mM NaCl, 1mM EDTA, 2.5 mM sodium pyrophosphate, 1 mM β-glycerophosphate, 1 mM Na3VO4) supplemented with 1% triton X-100 (Sigma Aldrich) and protease inhibitor cocktail (Sigma Aldrich), and then cleared at 14000 g at 4 °C for 30 min. Protein concentrations were determined using the BCA protein concentration assay as manufacturer’s instructions (Thermo Scientific). Subsequently, proteins were separated by electrophoresis onto 4–20% SDS-PAGE gels and then transferred onto Immobilon-P membrane. Membranes were incubated 1 h at room temperature (RT) with the following antibodies: rabbit anti-SOD2 (1:20000, Prestige Sigma Aldrich), goat anti-IL-1β (1:2000, R&D system), rabbit anti-phospho Ser935 LRRK2 (1:300, Abcam), rabbit-anti total LRRK2 (1:300, Abcam) and mouse anti-GAPDH (1:20000, Prestige Sigma Aldrich). Subsequently, membranes were incubated 1 h at RT with HRP-conjugated secondary antibodies (Sigma Aldrich) and finally incubated with ECL western blot substrate (GE Healthcare).
2.7. Mouse cytokine screen (16-plex)
Cytokines released into the supernatant of primary microglia were analyzed according to manufacturer’s instructions by Q-Plex Mouse Cytokine screen (Quansys), measuring IL-1α, IL-1β, IL-2, IL-3, IL-4, IL-5, IL-6, IL-10, IL-12p70, IL-17, MCP-1, IFNγ, TNFα, MIP-1α, GMCSF, RANTES by quantitative ELISA-based chemiluminescent assay.
2.8. Statistical analysis of validation data
All quantitative data are expressed as mean ± SEM and represent at least three independent sets of experiments. Statistical significance was assessed using two-way ANOVA followed by Bonferroni’s post-hoc test for the comparison of the two variables (genotype and treatment) and by one-way ANOVA followed Tukey’s post-hoc test for comparison of multiple groups in the time course experiments. Data were analyzed using Prism (GraphPad) and the statistical significance was taken at p < .05.
2.9. Stereotaxic surgery for LPS stimulation in vivo
All experimental procedures performed were approved by the NIH/ NIA Animal Care & Use Committee. Cx3r-GFP mice [https://www.ncbi.nlm.nih.gov/pubmed/10805752] on a C57BL6/J background were housed in standardized conditions at 2–5 animals per cage and with ad libitum access to food and water on a 12 h light-dark cycle. For LPS stimulation by stereotactic injection, 6-month old mice were initially anesthetized by 5% isoflurane and kept under anesthesia using 1–2% isoflurane. The tooth bar was adjusted to –5.0 mm. Mice were placed into a stereotaxic frame and eyes were covered with ointment. The top of the head was shaved and sterilized using 70% Ethanol. An incision was made above the midline and skull was exposed using cotton tips. At anteroposterior +0.2 mm, mediolateral ± 2.0 mm from bregma (bilateral injection), a hole was drilled into the skull and the last thin layer was removed using a forceps to not damage the dura. A pulled glass capillary (blunt) attached to a 5 μl Hamilton syringe was used for injection. First, an air bubble of 1 μl was pulled in followed by 1 μl of either PBS or 5 mg/ml LPS solution. The capillary was lowered to dorsoventral −3.2 mm from bregma into the dorsal striatum. The solution was delivered at a rate of 0.1 μl per 10sec. After the injection, the capillary was held in place for 2 min, retracted 0.1 μm and another min was waited before it was slowly withdrawn from the brain. The head wound was closed using surgical staples. Ketoprofen solution at 5 mg/kg was administered subcutaneously as analgesic treatment for the following 3 days.
3. Histology
Animals were sacrificed 3 days after surgery. Mice were deeply anesthetized with an intraperitoneal. Injection of 200ul of 10% ketamine and the thoracic cavity was opened to expose the heart. Blood was flushed out using 10 ml of 0.9% NaCl for 2 min. Brains were removed, the left hemisphere was used for single-cell RNA-Seq (scRNA-Seq) and the right hemisphere was fixed in 4% PFA for 48 h. After 2 days, brains were transferred to 30% sucrose solution for cryoprotection and sectioning was started once brains had sunk to the bottom. The brains were then cut into 30 μm thick coronal sections - 6 series - and stored in antifreeze solution (0.5 M phosphate buffer, 30% glycerol, 30% ethylene glycol) at − 20 °C until further processed. Sections were washed with PBS, mounted on glass slides and coverslips applied using Prolong Gold Antifade mounting media (Invitrogen). GFP expressing microglia were imaged using a Zeiss microscope.
3.1. Acutely isolated adult brain microglia and single cell RNA-sequencing
Immediately following perfusion, brains were quickly dissected and placed in ice-cold Hank’s balanced salt solution (HBSS) then dissociated using the Adult Brain Dissociation kit (Miltenyi Biotech, Cat#130–107-677), which combines gentle mechanical and enzymatic degradation, following by demyelination with Debris Removal Solution according to manufacturer’s recommendation. The cell suspensions were labelled with CD11b microbeads (Miltenyi Biotech, Cat#130–093-634) and loaded onto MACS columns (cat#130–042-201). CD11b+ were enriched and eluted as the positively selected cell fraction using MACS separator. Single cell suspension generated from the half-brain sample were then subjected to scRNA-Seq using a 10× genomics Chromium analyzer at the NCI single cell analysis facility, Bethesda MD. The standard 10× genomics pipeline was used to align reads to the Mus musculus Genome Reference Consortium Build 38 (mm10). Output from the 10× genomics platform was analyzed using the R package Seurat (version 3, PMIDS: 26000488, 29608179). Briefly, single cell data from PBS or LPS treated animals were combined into a single Seurat object and filtered for cells that had > 800 but < 6000 features and had < 0.1% of reads mapped to the mitochondrial genome. After log-normalization and scaling, data were reduced using the first 50 principal components then cells were mapped to two-dimensional space using t-distributed stochastic neighbor embedding (tSNE). We removed any cells that were positive for Mrc1 (macrophages; approximately 9.6% of all cells), Cldn5 (endothelial cells; ~1.2% of all cells) or Aqp4 (astrocytes; ~1.2% of all cells). We then re-clustered the remaining presumptive microglia and identified seven clusters of cells, with 705 cells from PBS-treated animals and 3005 cells from LPS stimulated animals. We used levels of the pro-inflammatory cytokine gee IL-1β to assign clusters to different levels of activation and visualized gene expression within Seurat.
4. Results
4.1. Differential gene expression after inflammatory treatments
To dissect LRRK2 related molecular pathways in microglia, we used RNA-Seq to generate a high-resolution transcriptome profile of LRRK2 WT and KO microglia cells that were either untreated or treated with α-synuclein PFFs. Additionally, to determine whether such responses were specific to α-synuclein, we used LPS as a more general inflammatory stimulus. We confirmed that fibrils preparation was free of bacteria endotoxin contamination derived from α-synuclein purification by analysis of IL-1β protein in primary microglia treated with vehicle PBS, α-synuclein monomer and PFFs at 25 μM for 24 h (Supplementary Fig. 1).
We obtained a high-quality RNA-Seq dataset, with an average of 30,902,421 uniquely mapped reads (range 22,388,606–44,910,295) per sample (Supplementary Table 1). Hierarchical clustering of the aligned and normalized read counts indicated that the three treatments (control, LPS and α-synuclein PFFs) separated the samples whereas genotype had a subtler effect on overall gene expression (Fig. 1a). Similarly, the first principal component of the overall gene expression profile separated LPS from the other two treatment groups while the second principal component separated α-synuclein PFFs from controls (Fig. 1b). These results demonstrate that both α-synuclein PFFs and LPS induce gene expression responses but that these differ from each other.
Fig. 1.
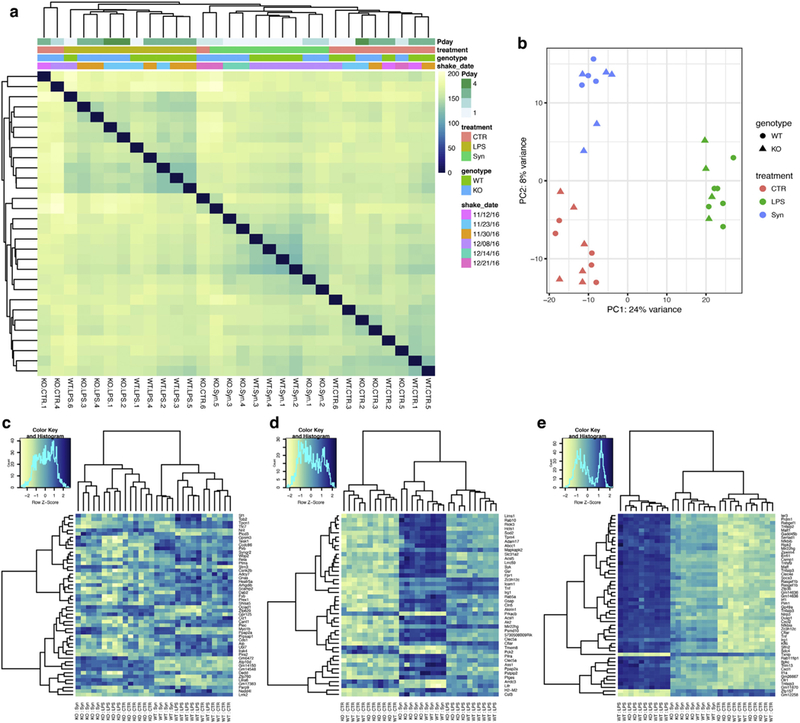
RNA-Seq profiling of WT and LRRK2 KO microglia after inflammatory stimulation. (a) Hierarchical clustering and heatmap of all samples used in this study. Colors in the heatmap represent the Euclidean distance between samples in a pairwise manner, scaled as shown on the upper right yellow-blue scale. Above the heatmap is a color representation of the model variables, which included two technical variables (Pday, for postnatal day of the pups and shake-Date for the date when the microglia were isolated from initial mixed glia cultures), and two biological variables, treatment and genotype. Note that samples separate largely by treatment and to a lesser extent by genotype. CTR = control, untreated cells. (b) First two principal components of the same data as in (a) confirms separation of the three treatment groups (colors) but less efficient separation by genotype (shapes). (c-e) Heatmaps for the top 50 most statistically significant genes associated with genotype (c) or treatments with α-synuclein PFFs (d) or LPS (e). Each gene on the right side of each heatmap is colored by Z (normalized standard deviations from the mean) for expression relative to the overall mean expression for that gene and samples are listed below each heatmap.
We therefore looked next at differential gene expression that would reflect the three major experimental manipulations in the model, namely genotype (Fig. 1c) and treatments with α-synuclein PFFs (Fig. 1d) or LPS (Fig. 1e). While the latter two groupings provided clear separation between all three treatment groups, the effect of genotype was subtle, although, as expected, LRRK2 was recovered as differentially expressed. However, we noted that within treatment groups, gene expression separated out by genotype (Fig. 1d, e). This data suggests that while Lrrk2 genetic deletion has only a subtle influence on basal gene expression, it might have measurable effects on inflammatory responses.
4.2. Gene ontology analysis of differentially expressed genes between Lrrk2 genotype and inflammagen treatments
To gain insights into the molecular mechanisms and pathways associated with gene expression responses we performed gene ontogeny enrichment for genes that were significantly differentially expressed (adjusted p < .05 and 2-fold difference) for each factor in the model (Fig. 2). For genotype (Fig. 2a), the most enriched categories included G0:0031982 for the GO term “vesicle” (p = 2.96 × 10⁻⁵). Other terms in this enrichment included extracellular exosomes (G0:0070062, p = 3.7 × 10⁻⁴) and regulation of response to stimulus (G0:0048583, p = 5.5 × 10⁻⁴). The enrichment of this set of genes demonstrates that while Lrrk2 deficiency overall has generally modest effects on gene expression, there are subtle differences between genotypes that likely reflect the known biology of LRRK2 in relation to the endo-lysosomal system [reviewed in (Roosen and Cookson, 2016)].
Fig. 2.
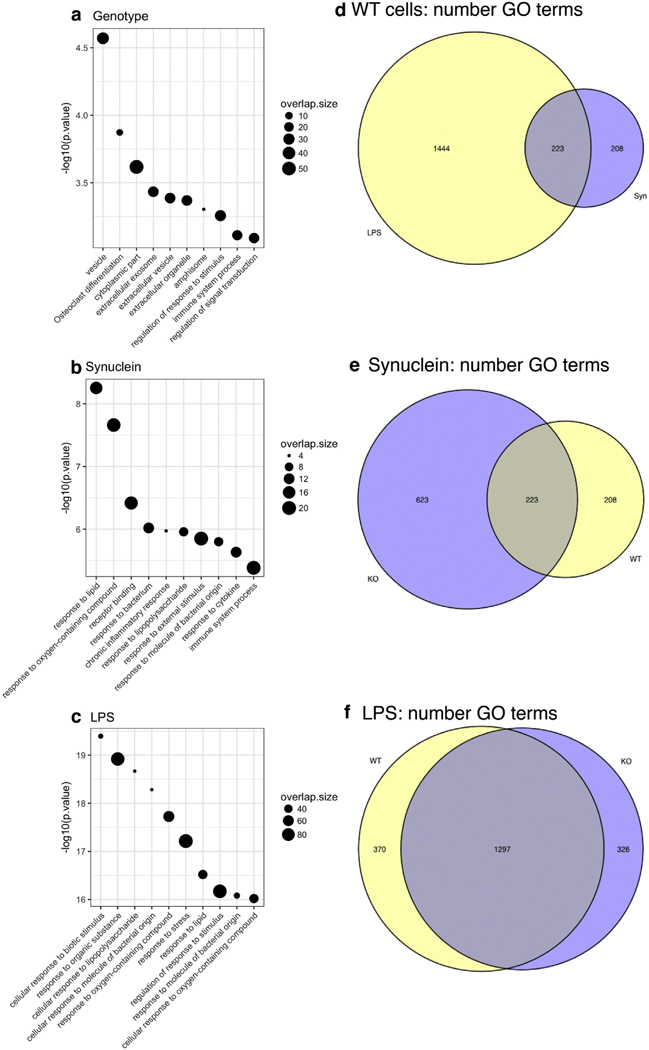
Gene ontology (GO) categorization of differentially expressed genes between LRRK2 genotype and inflammagen treatments. (a-c) Plots of significant GO terms associated with LRRK2 genotype in untreated cells (a) or after exposure to α-synuclein PFFs (b) or LPS (c) in wild type cells. For each plot, the top 10 GO categories by p-value are shown with -log10 adjusted p on the y axes and GO term.id on the x axes. Each point is scaled to overlap size, ie the number of genes in the dataset also found in a given GO category. (d-f) Euler diagrams showing numbers of significant (p adjusted < 0.05) GO terms in comparing the two treatments in WT cells (d) or treatments with α-synuclein PFFs (e) or LPS (f) in the two genotypes.
Similar analyses for α-synuclein PFFs (Fig. 2b) or LPS (Fig. 2c) in WT cells showed, as expected, a number of responses related to inflammation. Intriguingly, although the responses to each inflammagen overlapped, each set had unique elements, with LPS having many more identified GO categories (Fig. 2d). Specifically, LPS exposure resulted in alterations of categories including G0:0051171 “regulation of nitrogen compound metabolic process” (p = 3.56 × 10⁻¹⁶) that contained the Thioredoxin Interacting Protein (Txnip), which is known to regulate metabolism and ER stress. Conversely, the G0:200037 category “regulation of reactive oxygen species metabolic process” was present in the α-synuclein PFFs-exposed cells (p = .000359) but not in the LPS-exposed cells and included the mitochondrial dismutase Sod2. The separation of G0 categories between LPS and α-synuclein PFFs (Fig. 2b-d) combined with the overall separation of gene expression between treatments (Fig. 1), suggest that exposure to LPS or α-synuclein PFFs induce distinct and specific effects on gene expression.
We also examined how genotype affected pathways of gene expression identified by G0 profiling. Plotting the number of significant G0 terms by genotype showed that K0 cells, had a greater number of identified G0 terms than WT after exposure to α-synuclein PFFs (Fig. 2e) but that LPS evoked similar pathways in both genotypes (Fig. 2f). To understand what might drive the differences in G0 categorization, we plotted the density of overlap size (ie the number of differentially expressed genes in the dataset assigned to each G0 category) for shared G0 terms vs G0 terms recovered only in WT or K0 cells. We found that distribution of overlap size for differentially expressed genes after α-synuclein exposure showed a peak at lower overlap size in K0 cells compared to WT (Supplementary Fig. 2a, b), indicating that although K0 cells have more G0 categories they tend to have fewer genes in each category. To explore possible reasons for this difference, we looked at subsets of G0 terms in the WT and K0 cells. We noted that genes regulated by the transcription factors c-Rel and NFκb, both associated with inflammation, were enriched in WT cells but not in K0 cells (Supplementary Fig. 2c). This data suggests that regulation of transcription may be influenced by LRRK2 upstream of NF-κB and other transcription factors.
4.3. Validation of differential gene expression
We next performed technical validation of our RNA-Seq data set using qRT-PCR. First, we confirmed that LRRK2 expression was, as expected, significantly lower in the K0 animals compared to WT (Fig. 3a). Moreover, we measured the expression levels of IL-1β, a pro-inflammatory cytokine, whose expression we recently reported to be increased after 90 min of LPS treatment and attenuated in LRRK2 K0 microglia cells isolated from Lrrk2 exon-41 K0 mice (Russo et al., 2015). In agreement with our previous work, we confirmed that IL-1β was also increased by LPS treatment and lower in microglia from exon-2 K0 animals as used in the current study (Fig. 3b). These data validate the cells used here and suggest that responses to LPS are conserved across two different K0 models and, therefore, are due to Lrrk2 deficiency.
Fig. 3.
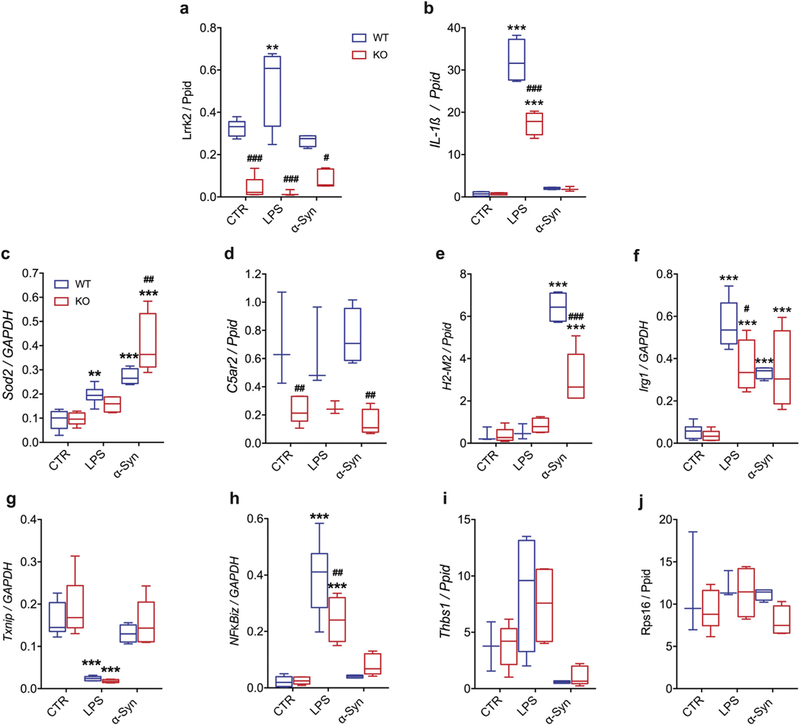
Technical validation of RNA-Seq top hits. Quantification of relative gene expression of the RNA-Seq top hits in LRRK2 WT and KO microglia cells (generated from Lrrk2-exon 2 KO mice) unstimulated and stimulated with α-synuclein PFFs or LPS priming. Ppid was used as reference gene for lowly and moderately-expressed genes, while GAPDH for highly expressed genes. The results are expressed as the mean ± SE (WT-CTR n = 4, WT-LPS n = 5, WT-α-synuclein n = 4, KO-CTR n = 5, KO-LPS n = 4 and KO-α-synuclein n = 5). Data were analyzed using two-way ANOVA followed by Bonferroni’s post-hoc test. ** p < .01 and ***p < .001, LPS or α-synuclein treated vs. untreated cells (for both genotypes); #p < .05, ##p < .01 and ###p < .001,WTvs. Lrrk2 KO cells (for untreated, LPS and α-synuclein treated cells).
We next attempted to validate a set of genes that showed a range of expression levels with an enrichment for genotype or the two inflammatory stimuli with > 2-fold differential expression and adjusted p value < .05 in the RNA-Seq dataset. For high expression genes, we selected Txnip (downregulated by LPS; p adjusted = 3.6 × 10⁻²⁶ in WT cells and 1.0 × 10⁻²⁶ in K0 cells), Sod2 (upregulated by LPS, p adjusted = 1.64 × 10⁻¹³, and by α-synuclein PFFs, p adjusted = 4.35 × 10−51), Irg1 (upregulated by LPS, p adjusted = 2.64 × 10⁻²⁴, and by α-synuclein PFFs, p adjusted = 1.38 × 10⁻¹⁵), and NFKBiz (upregulated after LPS treatment, p adjusted = 2.05 × 10−41). We also selected a moderately expressed gene Thbs1 (upregulated by LPS, p adjusted = 2.66 × 10⁻⁶) and two low expression genes, C5ar2 (lower in Lrrk2 K0 cells after α- synuclein treatment, p = .0262) and H2-M2 (upregulated by α-synucleinPFFs, p adjusted = 3.0 × 10⁻¹²). We selected two reference genes that displayed low variance and were not differentially expressed between groups, Ppid for low and moderately expressed genes and Gapdh for highly expressed genes. Six out of the seven genes we assayed (Sod2, C5ar2, H2-M2, Irg1, Txnip and NFKBiz) were detected by qRT-PCR in the identical pattern as determined by RNA-Seq (Fig. 3c-h). However, although we replicated that the mean expression of Thbsl was higher after LPS exposure, consistent with the direction of effect in the RNA-Seq experiment, the differences were not statistically significant (Fig. 3i), resulting in an overall validation rate of 86%.
4.4. Biological validation and timecourse of microglial responses to α-synuclein PFFs
As discussed above, LPS and α-synuclein PFFs induce overlapping as well as distinct effects on gene expression profile of WT microglia cells. However, in order to maximize the responses to each inflammagen, we used different timepoints for LPS and α-synuclein PFFs. To establish whether the observed differences in gene expression between LPS and α-synuclein PFFs were dependent on the differential time of treatments used for the RNA-Seq experiment (LPS 1 h and α-synuclein PFFs 8 h), we performed a timecourse experiment where microglia cells were treated for 0, 1, 4, 8 and 16 h with α-synuclein PFFs or LPS. Complementary ELISA experiments confirmed that LPS and α-synuclein PFFs mediate a differential and specific inflammatory response as shown by the profile of activated cytokines secreted after treatment with the two inflammagens (Supplementary Fig. 3). We then analyzed mitochondrial antioxidant S0D2, one of the most differentially expressed genes in WT cells in response to α-synuclein PFFs (2.5-fold, adjusted p = 4.3 × 10−51). We found that α-synuclein PFFs trigger a robust induction of S0D2 mRNA starting at 1 h, which continues to significantly increase at 8 h and 16 h of treatment compared with un-treated cells (Fig. 4a; 35-fold at 8h vs. control, ***p < 0,001, to 60-fold at 16 h vs. control, ***p < 0,001; 1,7-fold 8h vs. 16 h, #p < 0,05). As expected, LPS also induce an increase in S0D2 mRNA at 16 h of treatment (31-fold at 16 h vs. control, ***p < 0,001), how-ever, its levels are half of the amount expressed by microglia in response to α-synuclein PFFs (~2-fold α-synuclein PFFs vs. LPS at 16 h, §§p < 0,01). These data therefore confirm that there are quantitative differences in gene expression between cells exposed to LPS or α-synuclein PFFs.
Fig. 4.
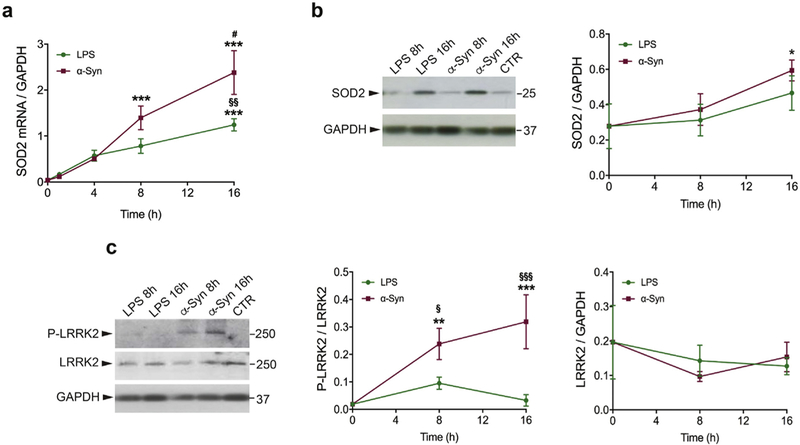
Timecourse of microglial responses to α-synuclein PFFs. (a) SOD2 mRNA analysis ofWT microglia cells treated for 0,1,4, 8 and 16h with α-synuclein PFFs or LPS priming using qRT-PCR. GAPDH was used ad reference gene. The results are expressed as the mean ± SE (0h n = 8, LPS 1hn = 5, LPS 4hn = 5, LPS 8h n = 5, LPS 16h n = 4, α-synuclein 1h n = 5, α-synuclein 4h n = 5, α-synuclein 8hn = 5, α-synuclein 16hn = 4). Datawere analyzed using one-way ANOVA followed by Tukey’s post-hoc test. ***p < .001, LPS or α-synuclein treated (8h, 16h) vs. untreated cells (0h). #p < .05, α-synuclein 16h vs. α-synuclein 8h; §§p < .01, LPS treated vs. α-synuclein treated cells. (b) SOD2 protein expression of WT microglia cells treated for 0, 8 and 16h with α-synuclein PFFs or LPS priming. GAPDH was used ad reference gene. The results are expressed as the mean ± SE (n = 3 per each group). Data were analyzed using one-way ANOVA followed by Tukey’s post-hoc test. *p < .05, α-synuclein 16h vs. untreated cells (0h). (c) P-LRRK2 and LRRK2 protein expression of WT microglia cells treated for 0, 8 and 16h with α-synuclein or LPS priming. GAPDH was used ad reference gene for LRRK2 expression. The results are expressed as the mean ± SE (n = 3 per each group). Data were analyzed using one-way ANOVA followed by Tukey’s post-hoc test. **p < .01 and ***p < .001, α-synuclein treated vs. untreated cells (0h). §p < .05 and §§§p < .001, α-synuclein treated vs. LPS treated cells.
To further validate α-synuclein PFFs -mediated SOD2 induction, we investigated whether the changes in SOD2 mRNA expression had an impact also on protein levels. To this end, we performed a timecourse experiment where microglia were treated for 0, 8 and 16 h with α-synuclein PFFs or LPS (Fig. 4b). We found that although both inflammatory insults induce an increase in SOD2 at the protein level, the increase was higher with α-synuclein PFFs (~2-fold α-synuclein PFFs 16 h vs. control, *p < .05).
Since multiple studies showed that inflammatory stimuli result in increased LRRK2 Ser935 phosphorylation in microglia (Marker et al., 2012; Puccini et al., 2015; Schapansky et al., 2014), we investigated the effect of LPS and α-synuclein PFFs on stimulating LRRK2 phosphorylation after 8 and 16 h of α-synuclein PFFs or LPS treatment (Fig. 4c). Interestingly, α-synuclein PFFs trigger a robust increase of pS935-LRRK2 at 8h (12-fold, 8h vs. control, **p < 0,01) and 16 h of treatment compared to untreated cells (16-fold, 16 h vs. control, ***p < 0,001). Although LPS priming caused a mild increase of pS935-LRRK2 after 8h of treatment, the increase was not statistically significant. Moreover, LPS and α-synuclein PFFs do not induce significant changes in LRRK2 total levels up to 16 h of treatment, (Fig. 4c), confirming our previous findings (Russo et al., 2015) although we note that other studies have seen an effect on total LRRK2 (Cook et al., 2017; Moehle et al., 2012). Overall, these results confirm the RNA-Seq data that α-synuclein PFFs trigger a microglial response that is distinct from that induced by LPS.
4.5. α-synuclein PFFs-mediated SOD2 induction is attenuated in LRRK2 KO microglia
Multiple studies using different experimental approaches and models support the hypothesis that LRRK2 is a key modulator of microglial-associated inflammation, although the detailed molecular mechanisms are unresolved (Kim et al., 2012; Ma et al., 2016; Marker et al., 2012; Moehle et al., 2012; Russo et al., 2018, 2015). Inflammation is strongly correlated with an oxidative stress response. Activated microglia secrete multiple toxic factors including IL-1β, tumor necrosis factor-α as well as ROS (Lull and Block, 2010). In our RNA-Seq data, we noted upregulation of the mitochondrial antioxidant SOD2. To validate this observation, we treated LRRK2 WT and KO microglia with α-synuclein PFFs at 0, 8 and 16 h (Fig. 5). After confirmation of Lrrk2 genetic deletion by immunoblotting in LRRK2 KO microglia cells (Fig. 5a, b), we analyzed SOD2 expression. While α-synuclein PFFs induce a significant increase of SOD2 protein after 16 h treatment in WT cells (~2-fold at 16 h vs. control, *p < .05), the increment of SOD2 expression after 16 h of treatment in KO cells was not statistically significant, suggesting an attenuated response under Lrrk2 deficiency (Fig. 5a, c). In the same experiment, we measured IL-1β levels and found that α-synuclein PFFs cause an increment of IL-1β in WT cells (~38-fold, 16 h vs. control, *p < .05) but not in KO cells up to 16 h of treatment (Fig. 5a, d).
Fig. 5.
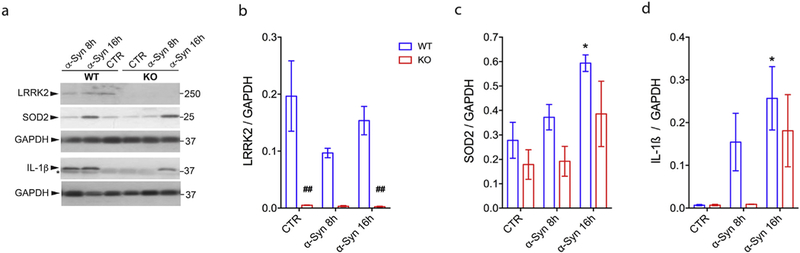
LRRK2 controls α-synuclein PFFs-mediated SOD2 induction. (a) LRRK2 WT and KO microglial lysates (generated from Lrrk2-exon 41 KO mice) treated for 0, 8 and 16 h with α-synuclein PFFs were subjected to LRRK2, SOD2, IL-1β and GAPDH immunoblotting. Quantification of LRRK2 (b), SOD2 (c) or IL-1β (d) is normalized for GAPDH protein. The results are expressed as the mean ± SEM (n = 3 per genotype/timepoint). Data were analyzed using two-way ANOVA followed by Bonferroni’s post-hoc test. *p < .05, α-synuclein treated vs. untreated cells (0h). ##p < .01, LRRK2 WT vs. KO cells (for untreated and α-synuclein treated cells).
Taken together these data indicate a diminished responsiveness or might suggest a delayed response of LRRK2 KO microglia after an inflammatory stimulus compared to WT cells and reveal that LRRK2 contribute to α-synuclein PFFs -mediated SOD2 induction.
4.6. Additional validation of LPS-induced gene expression in microglia in vivo using scRNA-Seq
These results nominate several genes that are regulated by exposure to LPS or PFFs in cell culture, of which we were able to validate several at the protein level. However, it is uncertain as to whether gene expression changes seen in cell culture are also representative of similar effects in vivo. Given the highly heterogenous cellular composition of the brain, we decided that we should use scRNA-Seq to examine some of the candidate genes found from cell culture, noting that some of these genes including Sod2 are expressed in both microglia and many other cell types and might not be seen to be regulated by inflammatory stimuli in bulk tissue.
We chose to perform single intrastriatal injections of LPS, or PBS as a vehicle control, which after three days induced widespread activation of microglia including in the cerebral cortex, striatum and midbrain (Fig. 6a). After single step immunoseparation of cells using Cd11b and bioinformatic removal of cell profiles from non-microglial cells (see Materials and methods), tSNE embedding identified seven clusters of microglia (Fig. 6b), of which six were predominantly from LPS treated animals and one from PBS treated animals (Fig. 6c). We interpret the uneven number of cells in the two groups to be due to microglial proliferation in response to inflammagen stimulation. Using this dataset, we were able to validate the proposed increase in Sod2 expression (Fig. 6d) and decrease in Txnip (Fig. 6e) in LPS-stimulated cells. Furthermore, examining IL-1β expression suggested that clustering of scRNA-Seq data represents levels of activation of microglia and using these categorizations, we were able to demonstrate that several additional genes nominated from the cell culture experiments including Irg1, NFKBiz, Saa3 and Cd83 also correlated with activation state (Fig. 6f). Collectively, these data suggest that we can validate at least a subset of gene expression changes with LPS nominated from cell culture experiments in vivo.
Fig. 6.
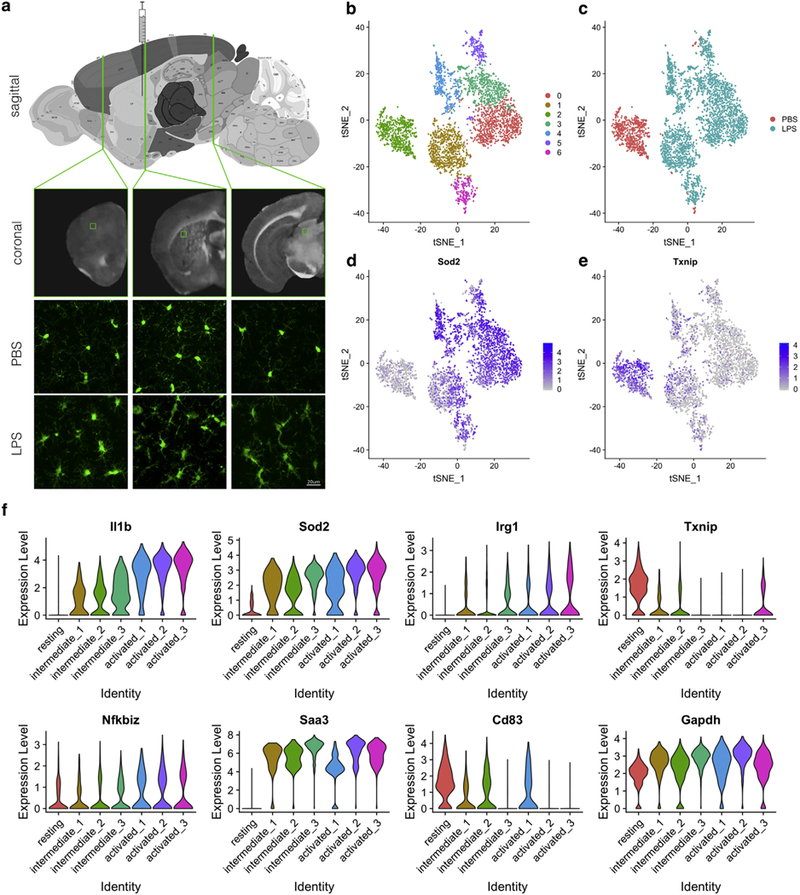
Validation of cell culture gene expression changes in vivo. (a) Schematic of the experimental paradigm. Upper panel shows a map of the adult mouse brain (http://atlas.brain-map.org/atlas?atlas=2#atlas=2&plate=100883770&structure=343&x=7800.011737530048&y=4023.96733210637&zoom=−3&resolution=16.11&z=5) with the position of the needle used to inject PBS or LPS into the striatum indicated. Lower panels show fluorescent images from coronal sections of Cx3Cr1-GFP mice at the indicated levels of the brain which are, from left to right, the frontal portion of the cerebral cortex, the striatum and the midbrain. In PBS-treated animals, microglia had a fine branched morphology whereas after LPS injection, ramified microglia with thicker processes were seen throughout the brain. There was also an apparent increase in the number of Cx3Cr1-GFP positive cells. Scale bar indicates 20 μm. (b-e) t-Distributed stochastic neighbor embedded (tSNE) visualization of scRNA-Seq analysis from mouse brain. In each plot, each point is a single cell plotted in two tSNE dimensions and colored by clusters ordered by cells in each cluster (b) or by whether each cell came from a PBS or LPS-treated animal (c). Additionally, scaled expression for two nominated differentially expressed genes, Sod2 (d) or Txnip (e) that were up-and down-regulated respectively. Scales on the right of each graph are log2 normalized and scaled gene expression. (f) Violin plots of gene expression in clusters ordered by expression of IL-1β (top left) for nominated differentially expressed genes Sod2, Irg1, Txnip, NFKBiz, Saa3 and Cd83. For comparison, the reference gene Gapdh is shown in the bottom right corner.
5. Discussion
Prior studies have emphasized a connection between LRRK2 activity and the biology of microglia [reviewed in (Dzamko, 2017; Russo et al., 2014)]. Dissecting the LRRK2 role(s) in brain immune cells, both under resting and inflammatory conditions, is crucial to understand whether deregulated LRRK2 activity in these cells has an indirect and harmful impact on neuronal functions. Here, we analyzed the transcriptome profiles of LRRK2 WT and KO microglia either under basal conditions or after treatments with PD-related α-synuclein PFFs or with LPS. We found that, although exposure to α-synuclein PFFs or LPS mediate overlapping gene expression profiles in WT microglia, the microglial responses are also distinct. These observations are likely explained by the recruitment of specific receptors in response to the different inflammatory insults. While it is well-established that LPS activates microglia through the engangment of Toll-like receptor 4 (TLR4) (Lien et al., 2000), the receptors and/or mechanisms involved in responding to α-synuclein aggregated forms are largely unknown. It is unclear whether there is a single specific receptor or multiple receptors with different functions and responses, and whether there are receptors specific for modified or aggregated forms of α-synuclein. Multiple lines of evidence suggest that α-synuclein might induce microglial-associated inflammation through phagocytosis (Hoffmann et al., 2016), receptor-mediated endocytosis (Lee et al., 2008) and/or ligand-receptor interaction including TLRs or scavenger receptors (Béraud and Maguire-Zeiss, 2012; Daniele et al., 2015). TLR1, 2 and 4 have been all proposed to mediate responses to α-synuclein pathological forms both in vitro (Fellner et al., 2013; Kim et al., 2013; Roodveldt et al., 2013) and in vivo (Kim et al., 2013; Watson et al., 2012) as well as in post-mortem PD brains (Dzamko et al., 2017). In addition, Kim and colleagues proposed that TLR-ligand activity of α-synuclein may be conformation-sensitive, showing that only oligomeric species can interact and activate microglial TLR2 (Kim et al., 2013). Mac-1 (Zhang et al., 2007) and CD36 (Su et al., 2008) scavenger receptors have also been proposed to be involved in α-synuclein-mediated microglial activation, making the scenario even more complex. In this study, we found that, in addition to modulate the expression of a set of inflammatory genes also activated by LPS priming, α-synuclein PFFs trigger specific molecular pathways that include complex and heterogeneous response that microglial cells undergo in response to this specific inflammagen. Of interest, analyses of GO pathways associated to microglial responses reveal that α-synuclein PFFs alter specifically the “regulation of reactive oxygen species metabolic process” category, which includes the mitochondrial dis-mutase Sod2. We technically and biologically validated α-synuclein PFFs-mediated SOD2 induction. We showed that SOD2 transcript and protein is increased after both α-synuclein PFFs and LPS priming, but that levels are enhanced upon α-synuclein PFFs, indicating that α-synuclein PFFs mediate a microglial response with an higher oxidative stress component compared to LPS.
SOD2 plays a crucial role in clearing mitochondrial ROS and protecting cells against oxidative stress and damage. Mitochondrial SOD2 transforms toxic superoxide anion into hydrogen peroxide, which both at low doses are indispensable in many intracellular signaling, however, at high doses, especially superoxide anion, result in oxidative stress and cellular damage [reviewed in (Fukai and Ushio-Fukai, 2011)]. In this context, multiple studies highlight that pathological species of α-synuclein are associated to increased oxidative stress [reviewed in (Dias et al., 2013; Roberts and Brown, 2015)]. It has been reported that α-synuclein toxic species may disturb mitochondrial respiration and/or uncouple oxidative phosphorylation leading to accumulation of ROS [reviewed in (Nakamura, 2013)]. In addition to mitochondrial stress, α-synuclein aggregates have been correlated even to cytosolic ROS generated by NADPH enzyme (Cremades et al., 2012). Overall, these observations suggest that microglia cells in response to α-synuclein PFFs exhibit an alteration of ROS-related pathways and may recruit antioxidant enzymes including SOD2 to protect the cell against oxidative stress and damage.
Intriguingly, we found that LRRK2 KO microglia cells displayed attenuated induction of mitochondrial SOD2 in response to α-synuclein PFFs. This observation might indicate that the response of LRRK2 KO microglia after α-synuclein PFFs insult is either delayed or reduced in amplitude compared to WT cells. In this regard, several studies have associated LRRK2 with oxidative stress (Heo et al., 2010; Liou et al., 2008; Pereira et al., 2014). Interestingly, in agreement with our results, it has been showed that microglia with LRRK2 knock-down (Kim et al., 2012) or kinase inhibition (Moehle et al., 2012) expressed lower ROS components, including inducible nitric oxide synthase, after LPS priming. Taken together, these results indicate that LRRK2 confers a greater susceptibility to some inflammatory insults. Supporting a key role of LRRK2 in microglial biology, we also found that upon α-synu-clein PFFs microglia reported a robust increased of LRRK2 phosphorylation at S935 compared with untreated cells, further confirming that LRRK2 is influenced by intracellular signaling of microglia after a PD-related insult.
A concern with studies using cultured microglia is that the process of isolation and culture might induce baseline activation that could mask gene expression changes that would be seen in vivo. To examine this, we used single LPS injections and scRNA-Seq to determine that at least a subset of the key changes validated in our in vitro studies can be confirmed in vivo. For example, we were able to confirm a substantial upregulation of Sod2 in this model. Of note, it is unlikely that this could have been detected from bulk RNA-Seq in brain samples as many cells other than microglia express this antioxidant gene. Future studies will extend this model to include multiple genotypes so that we can assess the contribution of Lrrk2 to microglial gene expression under inflammatory conditions in vivo.
In conclusion, in this study by using RNA-Seq technology we showed that although LPS and α-synuclein PFFs have overlapping effects on gene expression, α-synuclein PFFs additionally trigger a microglial response with a specific entity and elements. We reveal that microglia cells exhibited alterations of oxidative stress-related pathways and an enhanced induction of anti-oxidant SOD2 enzyme upon α-synuclein PFFs. Furthermore, we found that LRRK2 KO microglia cells reported attenuated induction of mitochondrial SOD2 in response to α-synuclein PFFs, indicative of a reduced susceptibility to the insult compared to WT cells and of an active contribution of LRRK2 to oxidative stress-related pathways. Overall, these results suggest that LRRK2 may widely contribute to pathogenesis of PD via altered neuroinflammatory signaling in microglia cells.
Supplementary Material
Acknowledgements
Digital droplet PCR was conducted at the CCR Genomics Core at the National Cancer Institute, NIH, Bethesda, MD 20892. We thank Dr. Heather Kalish, NIBIB (NIH) Core-Facility Unit Chief for assistance with the multiplex ELISA experiments. The NCI-CCR Single Cell Analysis Facility, Cancer Research Technology Program at the Frederick National Lab for Cancer Research critically assisted with single cell RNA-Seq analysis.
Funding
This research was supported in part by the Intramural Research Program of the NIH, National Institute on Aging (Z01-AG000937), by the Michael J Fox Foundation for Parkinson’s Research (grant 12080), by the EU Joint Programme in Neurogenerative Disease Research JPND (InCure), by the University of Padova (STARS Grants, LRRKing-Role of the Parkinson’s disease kinase LRRK2 in shaping neurites and synapses, funding: Euros 139848) and by Cariplo Foundation (grant 2016–0428). IR was also supported by a short-term EMBO fellowship (ASTF 439–2015/Award).
Abbreviations:
- WT
wild-type
- KO
knock-out
- PFFs
pre-formed fibrils
- LPS
lipopolysaccharide
- LRRK2
Leucine-rich repeat kinase-2
- PD
Parkinson’s disease
- ROS
reactive oxygen species
- RNA-Seq
RNA sequencing
- SOD2
superoxide dismutase-2
- RT
room temperature
- Txnip
Thioredoxin Interacting Protein
- TLR4
Toll-like receptor 4
- scRNA-Seq
single-cell RNA Sequencing
Footnotes
Supplementary data to this article can be found online at https://doi.org/10.1016/j.nbd.2019.05.012.
References
- Aasly JO, Toft M, Fernandez-Mata I, Kachergus J, Hulihan M, White LR, Farrer M, 2005. Clinical features ofLRRK2-associated Parkinson’s disease in Central Norway. Ann. Neurol. 57, 762–765. 10.1002/ana.20456. [DOI] [PubMed] [Google Scholar]
- Béraud D, Maguire-Zeiss KA, 2012. Misfolded α-synuclein and toll-like receptors: therapeutic targets for Parkinson’s disease. Parkinsonism Relat. Disord. 18, S17–S20. 10.1016/S1353-8020(11)70008-6. [DOI] [PMC free article] [PubMed] [Google Scholar]
- Biskup S, Moore DJ, Rea A, Lorenz-Deperieux B, Coombes CE, Dawson VL, Dawson TM, West AB, 2007. Dynamic and redundant regulation of LRRK2 and LRRK1 expression. BMC Neurosci. 8, 102 10.1186/1471-2202-8-102. [DOI] [PMC free article] [PubMed] [Google Scholar]
- Bliederhaeuser C, Grozdanov V, Speidel A, Zondler L, Ruf WP, Bayer H, Kiechle M, Feiler MS, Freischmidt A, Brenner D, Witting A, Hengerer B, Fändrich M, Ludolph AC, Weishaupt JH, Gillardon F, Danzer KM, 2016. Age-dependent defects of alpha-synuclein oligomer uptake in microglia and monocytes. Acta Neuropathol. 131, 379–391. 10.1007/s00401-015-1504-2. [DOI] [PubMed] [Google Scholar]
- Cook DA, Kannarkat GT, Cintron AF, Butkovich LM, Fraser KB, Chang J, Grigoryan N, Factor SA, West AB, Boss JM, Tansey MG, 2017. LRRK2 levels in immune cells are increased in Parkinson’s disease. NPJ Park. Dis. 3,11 10.1038/s41531-017-0010-8. [DOI] [PMC free article] [PubMed] [Google Scholar]
- Cremades N, Cohen SIA, Deas E, Abramov AY, Chen AY, Orte A, Sandal M, Clarke RW, Dunne P, Aprile FA, Bertoncini CW, Wood NW, Knowles TPJ, Dobson CM, Klenerman D, 2012. Direct observation of the interconversion of normal and toxic forms of α-synuclein. Cell 149, 1048–1059. 10.1016/j.cell.2012.03.037. [DOI] [PMC free article] [PubMed] [Google Scholar]
- Daniele SG, Béraud D, Davenport C, Cheng K, Yin H, Maguire-Zeiss KA, 2015. Activation of MyD88-dependent TLR½ signaling by misfolded α-synuclein, a protein linked to neurodegenerative disorders. Sci. Signal. 8, ra45. 10.1126/scisignal.2005965. [DOI] [PMC free article] [PubMed] [Google Scholar]
- Dias V, Junn E, Mouradian MM, 2013. The role of oxidative stress in Parkinson’s disease. J. Park. Dis. 3, 461–491. 10.3233/JPD-130230. [DOI] [PMC free article] [PubMed] [Google Scholar]
- Dobin A, Davis CA, Schlesinger F, Drenkow J, Zaleski C, Jha S, Batut P, Chaisson M, Gingeras TR, 2013. STAR: ultrafast universal RNA-seq aligner. Bioinformatics 29, 15–21. 10.1093/bioinformatics/bts635. [DOI] [PMC free article] [PubMed] [Google Scholar]
- Dzamko N, Gysbers A, Perera G, Bahar A, Shankar A, Gao J,Fu Y, Halliday GM, 2017. Toll-like receptor 2 is increased in neurons in Parkinson’s disease brain and may contribute to alpha-synuclein pathology. Acta Neuropathol. 133, 303–319. 10.1007/s00401-016-1648-8. [DOI] [PMC free article] [PubMed] [Google Scholar]
- Dzamko NL, 2017. LRRK2 and the immune system. Adv. Neurobiol. 14, 123–143. 10.1007/978-3-319-49969-7_7. [DOI] [PubMed] [Google Scholar]
- Fellner L, Irschick R, Schanda K, Reindl M, Klimaschewski L, Poewe W, Wenning GK, Stefanova N, 2013. Toll-like receptor 4 is required for α-synuclein dependent activation of microglia and astroglia. Glia 61, 349–360. 10.1002/glia.22437 . [DOI] [PMC free article] [PubMed] [Google Scholar]
- Fukai T, Ushio-Fukai M, 2011. Superoxide Dismutases: role in redox signaling, vascular function, and diseases. Antioxid. Redox Signal. 15, 1583–1606. 10.1089/ars.2011.3999. [DOI] [PMC free article] [PubMed] [Google Scholar]
- Gao H-M, Hong J-S, 2008. Why neurodegenerative diseases are progressive: uncontrolled inflammation drives disease progression. Trends Immunol. 29, 357–365. 10.1016/j.it.2008.05.002. [DOI] [PMC free article] [PubMed] [Google Scholar]
- Garden GA, Möller T, 2006. Microglia biology in health and disease. J. NeuroImmune Pharmacol. 1, 127–137. 10.1007/s11481-006-9015-5. [DOI] [PubMed] [Google Scholar]
- Haugarvoll K, Rademakers R, Kachergus JM, Nuytemans K, Ross OA, Gibson JM, Tan E-K, Gaig C, Tolosa E, Goldwurm S, Guidi M, Riboldazzi G, Brown L, Walter U, Benecke R, Berg D, Gasser T, Theuns J, Pals P, Cras P, De Deyn PP, Engelborghs S, Pickut B, Uitti RJ, Foroud T, Nichols WC, Hagenah J, Klein C, Samii A, Zabetian CP, Bonifati V, Van Broeckhoven C, Farrer MJ, Wszolek ZK, 2008. Lrrk2 R1441C parkinsonism is clinically similar to sporadic Parkinson disease. Neurology 70, 1456–1460. 10.1212/01.wnl.0000304044.22253.03 . [DOI] [PMC free article] [PubMed] [Google Scholar]
- Heo HY, Park J-M, Kim C-H, Han BS, Kim K-S, Seol W, 2010. LRRK2 enhances oxidative stress-induced neurotoxicity via its kinase activity. Exp. Cell Res. 316, 649–656. 10.1016/j.yexcr.2009.09.014. [DOI] [PubMed] [Google Scholar]
- Hinkle KM, Yue M, Behrouz B, Dächsel JC, Lincoln SJ, Bowles EE, Beevers JE, Dugger B, Winner B, Prots I, Kent CB, Nishioka K, Lin W-L, Dickson DW, Janus CJ, Farrer MJ, Melrose HL, 2012. LRRK2 knockout mice have an intact dopaminergic system but display alterations in exploratory and motor co-ordination behaviors. Mol. Neurodegener. 7, 25 10.1186/1750-1326-7-25. [DOI] [PMC free article] [PubMed] [Google Scholar]
- Hoenen C, Gustin A, Birck C, Kirchmeyer M, Beaume N, Felten P, Grandbarbe L, Heuschling P, Heurtaux T, 2016. Alpha-Synuclein proteins promote pro-inflammatory cascades in microglia: stronger effects of the A53T mutant. PLoS One 11, e0162717. 10.1371/journal.pone.0162717. [DOI] [PMC free article] [PubMed] [Google Scholar]
- Hoffmann A, Ettle B, Bruno A, Kulinich A, Hoffmann A-C, von Wittgenstein J, Winkler J, Xiang W, Schlachetzki JCM, 2016. Alpha-synuclein activates BV2 microglia dependent on its aggregation state. Biochem. Biophys. Res. Commun. 479, 881–886. 10.1016/j.bbrc.2016.09.109. [DOI] [PubMed] [Google Scholar]
- Kim B, Yang M-S, Choi D, Kim J-H, Kim H-S, Seol W, Choi S, Jou I, Kim E-Y, Joe E-H, 2012. Impaired inflammatory responses in murine Lrrk2-knockdown brain microglia. PLoS One 7, e34693. 10.1371/journal.pone.0034693. [DOI] [PMC free article] [PubMed] [Google Scholar]
- Kim C, Ho D-H, Suk J-E, You S, Michael S, Kang J, Joong Lee S, Masliah E, Hwang D, Lee H-J, Lee S-J, 2013. Neuron-released oligomeric α-synuclein is an endogenous agonist of TLR2 for paracrine activation of microglia. Nat. Commun. 4, 1562 10.1038/ncomms2534. [DOI] [PMC free article] [PubMed] [Google Scholar]
- Kuhn A, Kumar A, Beilina A, Dillman A, Cookson MR, Singleton AB, 2012. Cell population-specific expression analysis of human cerebellum. BMC Genomics 13, 610 10.1186/1471-2164-13-610. [DOI] [PMC free article] [PubMed] [Google Scholar]
- Lee H-J, Suk J-E, Bae E-J, Lee S-J, 2008. Clearance and deposition of extracellular α-synuclein aggregates in microglia. Biochem. Biophys. Res. Commun. 372, 423–428. 10.1016/j.bbrc.2008.05.045. [DOI] [PubMed] [Google Scholar]
- Lien E, Means TK, Heine H, Yoshimura A, Kusumoto S, Fukase K, Fenton MJ, Oikawa M, Qureshi N, Monks B, Finberg RW, Ingalls RR, Golenbock DT, 2000. Toll-like receptor 4 imparts ligand-specific recognition of bacterial lipopolysaccharide. J. Clin. Invest. 105, 497–504. 10.1172/JCI8541. [DOI] [PMC free article] [PubMed] [Google Scholar]
- Liou AKF, Leak RK, Li L, Zigmond MJ, 2008. Wild-type LRRK2 but not its mutant attenuates stress-induced cell death via ERK pathway. Neurobiol. Dis. 32, 116–124. 10.1016/j.nbd.2008.06.016. [DOI] [PMC free article] [PubMed] [Google Scholar]
- Love MI, Huber W, Anders S, 2014. Moderated estimation of fold change and dispersion for RNA-seq data with DESeq2. Genome Biol. 15, 550 10.1186/s13059-014-0550-8 . [DOI] [PMC free article] [PubMed] [Google Scholar]
- Lull ME, Block ML, 2010. Microglial activation and chronic neurodegeneration. Neurotherapeutics 7, 354–365. 10.1016/j.nurt.2010.05.014. [DOI] [PMC free article] [PubMed] [Google Scholar]
- Ma B, Xu L, Pan X, Sun L, Ding J, Xie C, Koliatsos VE, Cai H, 2016. LRRK2 modulates microglial activity through regulation of chemokine (C-X3-C) receptor 1 -mediated signalling pathways. Hum. Mol. Genet. 25, 3515–3523. 10.1093/hmg/ddw194. [DOI] [PMC free article] [PubMed] [Google Scholar]
- Marker DF, Puccini JM, Mockus TE, Barbieri J, Lu S-M, Gelbard HA, 2012. LRRK2 kinase inhibition prevents pathological microglial phagocytosis in response to HIV-1 tat protein. J. Neuroinflammation 9, 261 10.1186/1742-2094-9-261. [DOI] [PMC free article] [PubMed] [Google Scholar]
- McGeer PL, Itagaki S, Boyes BE, McGeer EG, 1988. Reactive microglia are positive for HLA-DR in the substantia nigra of Parkinson’s and Alzheimer’s disease brains. Neurology 38, 1285–1291. [DOI] [PubMed] [Google Scholar]
- Moehle MS, Webber PJ, Tse T, Sukar N, Standaert DG, DeSilva TM, Cowell RM, West AB, 2012. LRRK2 inhibition attenuates microglial inflammatory responses. J. Neurosci. 32, 1602–1611. 10.1523/JNEUROSCI.5601-11.2012. [DOI] [PMC free article] [PubMed] [Google Scholar]
- Mogi M, Harada M, Riederer P, Narabayashi H, Fujita K, Nagatsu T, 1994. Tumor necrosis factor-alpha (TNF-alpha) increases both in the brain and in the cerebrospinal fluid from parkinsonian patients. Neurosci. Lett. 165, 208–210. [DOI] [PubMed] [Google Scholar]
- Nakamura K, 2013. α-Synuclein and mitochondria: partners in crime? Neurotherapeutics 10, 391–399. 10.1007/s13311-013-0182-9. [DOI] [PMC free article] [PubMed] [Google Scholar]
- Paisán-Ruíz C, Jain S, Evans EW, Gilks WP, Simón J, van der Brug M, de Munain L, Aparicio S, Gil AM, Khan N, Johnson J, Martinez JR, Nicholl D, Carrera IM, Peňa AS, de Silva R, Lees A, Martí-Massó JF, Pérez-Tur J, Wood NW, Singleton AB, 2004. Cloning of the gene containing mutations that cause PARK8-linked Parkinson’s disease. Neuron 44, 595–600. 10.1016/j.neuron.2004.10.023. [DOI] [PubMed] [Google Scholar]
- Parisiadou L, Xie C, Cho HJ, Lin X, Gu X-L, Long C-X, Lobbestael E, Baekelandt V, Taymans J-M, Sun L, Cai H, 2009. Phosphorylation of ezrin/radixin/moesin proteins by LRRK2 promotes the rearrangement of actin cytoskeleton in neuronal morphogenesis. J. Neurosci. 29, 13971–13980. 10.1523/JNEUROSCI.3799-09.2009. [DOI] [PMC free article] [PubMed] [Google Scholar]
- Pereira C, Miguel Martins L, Saraiva L, 2014. LRRK2, but not pathogenic mutants, protects against H2O2 stress depending on mitochondrial function and endocytosis in a yeast model. Biochim. Biophys. Acta 1840, 2025–2031. 10.1016/j.bbagen.2014.02.015. [DOI] [PubMed] [Google Scholar]
- Perry VH, Holmes C, 2014. Microglial priming in neurodegenerative disease. Nat. Rev. Neurol. 10, 217–224. 10.1038/nrneurol.2014.38. [DOI] [PubMed] [Google Scholar]
- Puccini JM, Marker DF, Fitzgerald T, Barbieri J, Kim CS, Miller-Rhodes P, Lu SM, Dewhurst S, Gelbard HA, 2015. Leucine-rich repeat kinase 2 modulates Neuroinflammation and neurotoxicity in models of human immunodeficiency virus 1-associated neurocognitive disorders. J. Neurosci. 35. [DOI] [PMC free article] [PubMed] [Google Scholar]
- Roberts A, Pachter L, 2013. Streaming fragment assignment for real-time analysis of sequencing experiments. Nat. Methods 10, 71–73. 10.1038/nmeth.2251 . [DOI] [PMC free article] [PubMed] [Google Scholar]
- Roberts H, Brown D, 2015. Seeking a mechanism for the toxicity of oligomeric α-Synuclein. Biomolecules 5, 282–305. 10.3390/biom5020282. [DOI] [PMC free article] [PubMed] [Google Scholar]
- Roodveldt C, Labrador-Garrido A, Gonzalez-Rey E, Lachaud CC, Guilliams T, Fernandez-Montesinos R, Benitez-Rondan A, Robledo G, Hmadcha A, Delgado M, Dobson CM, Pozo D, 2013. Preconditioning of microglia by α-synuclein strongly affects the response induced by toll-like receptor (TLR) stimulation. PLoS One 8, e79160. 10.1371/journal.pone.0079160. [DOI] [PMC free article] [PubMed] [Google Scholar]
- Roosen DA, Cookson MR, 2016. LRRK2 at the interface of autophagosomes, endo-somes and lysosomes. Mol. Neurodegener. 11, 73 10.1186/s13024-016-0140-1. [DOI] [PMC free article] [PubMed] [Google Scholar]
- Russo I, Berti G, Plotegher N, Bernardo G, Filograna R, Bubacco L, Greggio E, 2015. Leucine-rich repeat kinase 2 positively regulates inflammation and down-regulates NF-kB p50 signaling in cultured microglia cells. J. Neuroinflammation 12, 230 10.1186/s12974-015-0449-7. [DOI] [PMC free article] [PubMed] [Google Scholar]
- Russo I, Bubacco L, Greggio E, 2012. Exosomes-associated neurodegeneration and progression of Parkinson’s disease. Am. J. Neurodegener. Dis. 1, 217–225. [PMC free article] [PubMed] [Google Scholar]
- Russo I, Bubacco L, Greggio E, 2014. LRRK2 and neuroinflammation: partners in crime in Parkinson’s disease? J. Neuroinflammation 11, 52. [DOI] [PMC free article] [PubMed] [Google Scholar]
- Russo I, Di Benedetto G, Kaganovich A, Ding J, Mercatelli D, Morari M, Cookson MR, Bubacco L, Greggio E, 2018. Leucine-rich repeat kinase 2 controls protein kinase a activation state through phosphodiesterase 4. J. Neuroinflammation 15, 297 10.1186/s12974-018-1337-8. [DOI] [PMC free article] [PubMed] [Google Scholar]
- Sacino AN, Brooks M, McKinney AB, Thomas MA, Shaw G, Golde TE, Giasson BI, 2014. Brain injection of -Synuclein induces multiple Proteinopathies, gliosis, and a neuronal injury Marker. J. Neurosci. 34, 12368–12378. 10.1523/JNEUR0SCI.2102-14.2014. [DOI] [PMC free article] [PubMed] [Google Scholar]
- Schapansky J, Nardozzi JD, Felizia F, LaVoie MJ, 2014. Membrane recruitment of endogenous LRRK2 precedes its potent regulation of autophagy. Hum. Mol. Genet. 23, 4201–4214. 10.1093/hmg/ddu138. [DOI] [PMC free article] [PubMed] [Google Scholar]
- Simón-Sánchez J, Schulte C, Bras JM, Sharma M, Gibbs JR, Berg D, Paisan-Ruiz C, Lichtner P, Scholz SW, Hernandez DG, Krüger R, Federoff M, Klein C, Goate A, Perlmutter J, Bonin M, Nalls MA, Illig T, Gieger C, Houlden H, Steffens M, Okun MS, Racette BA, Cookson MR, Foote KD, Fernandez HH, Traynor BJ, Schreiber S, Arepalli S, Zonozi R, Gwinn K, van der Brug M, Lopez G, Chanock SJ, Schatzkin A, Park Y, Hollenbeck A, Gao J, Huang X, Wood NW, Lorenz D, Deuschl G, Chen H, Riess O, Hardy JA, Singleton AB, Gasser T, 2009. Genome-wide association study reveals genetic risk underlying Parkinson’s disease. Nat. Genet. 41, 1308–1312. 10.1038/ng.487. [DOI] [PMC free article] [PubMed] [Google Scholar]
- Su X, Maguire-Zeiss KA, Giuliano R, Prifti L, Venkatesh K, Federoff HJ, 2008. Synuclein activates microglia in a model of Parkinson’s disease. Neurobiol. Aging 29, 1690–1701. 10.1016/j.neurobiolaging.2007.04.006. [DOI] [PMC free article] [PubMed] [Google Scholar]
- Tansey MG, Goldberg MS, 2010. Neuroinflammation in Parkinson’s disease: its role in neuronal death and implications for therapeutic intervention. Neurobiol. Dis. 37, 510–518. 10.1016/j.nbd.2009.11.004. [DOI] [PMC free article] [PubMed] [Google Scholar]
- Theodore S, Cao S, McLean PJ, Standaert DG, 2008. Targeted overexpression of human alpha-synuclein triggers microglial activation and an adaptive immune response in a mouse model of Parkinson disease. J. Neuropathol. Exp. Neurol. 67, 1149–1158. 10.1097/NEN.0b013e31818e5e99. [DOI] [PMC free article] [PubMed] [Google Scholar]
- Watson MB, Richter F, Lee SK, Gabby L, Wu J, Masliah E, Effros RB, Chesselet M-F, 2012. Regionally-specific microglial activation in young mice over-expressing human wildtype alpha-synuclein. Exp. Neurol. 237, 318–334. 10.1016/j.expneurol.2012.06.025. [DOI] [PMC free article] [PubMed] [Google Scholar]
- Zhang W, Dallas S, Zhang D, Guo J-P, Pang H, Wilson B, Miller DS, Chen B, Zhang W, McGeer PL, Hong J-S, Zhang J, 2007. Microglial PHOX and mac-1 are essential to the enhanced dopaminergic neurodegeneration elicited by A30P and A53T mutant alpha-synuclein. Glia 55, 1178–1188. 10.1002/glia.20532 . [DOI] [PubMed] [Google Scholar]
- Zhang W, Wang T, Pei Z, Miller DS, Wu X, Block ML, Wilson B, Zhang W, Zhou Y, Hong J-S, Zhang J, 2005. Aggregated alpha-synuclein activates microglia: a process leading to disease progression in Parkinson’s disease. FASEB J. 19, 533–542. 10.1096/fj.04-2751com. [DOI] [PubMed] [Google Scholar]
- Zimprich A, Biskup S, Leitner P, Lichtner P, Farrer M, Lincoln S, Kachergus J, Hulihan M, Uitti RJ, Calne DB, Stoessl AJ, Pfeiffer RF, Patenge N, Carbajal IC, Vieregge P, Asmus F, Müller-Myhsok B, Dickson DW, Meitinger T, Strom TM, Wszolek ZK, Gasser T, 2004. Mutations in LRRK2 cause autosomal-dominant parkinsonism with pleomorphic pathology. Neuron 44, 601–607. 10.1016/j.neuron.2004.11.005. [DOI] [PubMed] [Google Scholar]
Associated Data
This section collects any data citations, data availability statements, or supplementary materials included in this article.