

Abstract
During cardiogenesis, most myocytes arise from cardiac progenitors expressing the transcription factors Isl1 and Nkx2‐5. Here, we show that a direct repression of Isl1 by Nkx2‐5 is necessary for proper development of the ventricular myocardial lineage. Overexpression of Nkx2‐5 in mouse embryonic stem cells (ESCs) delayed specification of cardiac progenitors and inhibited expression of Isl1 and its downstream targets in Isl1+ precursors. Embryos deficient for Nkx2‐5 in the Isl1+ lineage failed to downregulate Isl1 protein in cardiomyocytes of the heart tube. We demonstrated that Nkx2‐5 directly binds to an Isl1 enhancer and represses Isl1 transcriptional activity. Furthermore, we showed that overexpression of Isl1 does not prevent cardiac differentiation of ESCs and in Xenopus laevis embryos. Instead, it leads to enhanced specification of cardiac progenitors, earlier cardiac differentiation, and increased cardiomyocyte number. Functional and molecular characterization of Isl1‐overexpressing cardiomyocytes revealed higher beating frequencies in both ESC‐derived contracting areas and Xenopus Isl1‐gain‐of‐function hearts, which associated with upregulation of nodal‐specific genes and downregulation of transcripts of working myocardium. Immunocytochemistry of cardiomyocyte lineage‐specific markers demonstrated a reduction of ventricular cells and an increase of cells expressing the pacemaker channel Hcn4. Finally, optical action potential imaging of single cardiomyocytes combined with pharmacological approaches proved that Isl1 overexpression in ESCs resulted in normally electrophysiologically functional cells, highly enriched in the nodal subtype at the expense of the ventricular lineage. Our findings provide an Isl1/Nkx2‐5‐mediated mechanism that coordinately regulates the specification of cardiac progenitors toward the different myocardial lineages and ensures proper acquisition of myocyte subtype identity. Stem Cells 2015;33:1113–1129
Keywords: Isl1, Nkx2‐5, Cardiac differentiation, Cardiac progenitors, Heart development, Embryonic stem cells
Introduction
The mammalian heart is composed of a complex set of muscle and nonmuscle cells that arise from multipotent progenitors in the first and second heart field (FHF and SHF) 1, 2. Despite extensive study of heart development using genetically modified mouse models and lineage tracing experiments, a complete and accurate picture of the molecular pathways underpinning heart development is still elusive. Little is known about the control of the signaling networks that regulate the transition from progenitors toward differentiated myocardial cells and how these networks are perturbed in congenital and adult forms of heart disease.
The LIM‐homeodomain transcription factor Isl1 is a key regulator of SHF progenitors and is required for survival, proliferation, and migration of these cells into the FHF‐derived primitive heart tube, resulting in its elongation and further morphogenesis 3. However, recent reports suggest that Isl1 is likely to be pan‐cardiac progenitor marker, being expressed in both cardiac progenitor fields in early development 4, 5. FHF and SHF progenitors also express NK2 transcription factor related, locus 5 (Nkx2‐5), a pivotal regulator of the cardiac lineage 6, 7, 8. While Isl1 is mostly restricted to a progenitor cell state in the heart and is downregulated upon myocardial differentiation, Nkx2‐5 is expressed throughout cardiac development, with high levels in embryonic differentiated cardiomyocytes 9, 10. In Nkx2‐5 knockout mutants, the formation of the heart tube is severely affected, and proliferation of cardiac progenitor cells is altered, showing the key regulatory role of this transcription factor. In addition, genes normally expressed in the SHF and downregulated upon differentiation into myocardium, including Isl1, fail to undergo this downregulation 4.
In the present study, we describe an Isl1/Nkx2‐5‐mediated mechanism that regulates cardiac progenitor cell fate by initiating differentiation into either a working myocardial or a sinoatrial node (SAN) cell type. Using genetic mouse and Xenopus models as well as molecular analyses in Nkx2‐5‐ and Isl1‐overexpressing mouse embryonic stem cells (ESCs), we demonstrate that a direct repression of Isl1 transcription by Nkx2‐5 is necessary for proper specification and maturation of the ventricular myocardial lineages.
Materials and Methods
Mice
Nkx2‐5fl/fl mice were generously provided by Kenneth R. Chien (Karolinska Institute, Solna, Sweden) 11. Isl1‐Cre mice were generously provided by Sylvia Evans (University of California‐San Diego, La Jolla, CA) 12. Mice are in a mixed 129 × C57Bl/6 background.
Xenopus Experiments
Xenopus embryos were generated by in vitro fertilization and staged as described 13. For gain of function experiments, isl1 RNA was injected either unilaterally (1 ng per embryo for marker gene analysis by whole‐mount in situ hybridization [ISH]) or bilaterally (2 ng per embryo for heart rate and Isl1 downstream target gene analysis by reverse transcription polymerase chain reaction (RT‐PCR)) into dorso‐vegetal blastomeres of eight‐cell stage embryos to target cardiac tissue. To control proper injections, 500 pg green fluorescent protein (GFP) mRNA were coinjected as a lineage tracer. In situ antisense RNA probes were generated as delineated earlier 14, 15. Whole‐mount in situ experiments were performed at stage 20 and 28 as described 16 and expression of Isl1 downstream target genes was analyzed on pooled heart explants isolated at stage 24.
Cell Culture
ESCs were maintained in standard ESC medium (Dulbecco's modified Eagle's medium [DMEM; Life Technologies, Darmstadt, Germany, http://www.lifetechnologies.com/de/de/home.html], supplemented with 2 mM l‐glutamine, 0.1 mM nonessential amino acids, 1 mM sodium pyruvate, 0.1 mM β‐mercaptoethanol, 50 U/ml penicillin, 50 µg/ml streptomycin, 15% fetal bovine serum [FBS], and 0.1 µg/ml leukemia inhibitory factor [LIF; Millipore, Hessen, Germany, http://www.merckmillipore.com/DE/de]) on irradiated murine embryonic fibroblasts (MEFs). HEK293T and C3H 10 T1/2 cells were cultured in DMEM and basal medium Eagle (Life Technologies), respectively, supplemented with 2 mM l‐glutamine, 100 U/ml penicillin, 100 µg/ml streptomycin, and 10% FBS. All cells were kept at 37°C and 5% CO2.
Genetically Modified ESCs and In Vitro Differentiation of ESCs
Mouse Isl1 and Nkx2‐5 cDNA were cloned into the lentiviral transfer plasmid pRRLsin18.PPT.PGK.IRES.GFP. Lentiviruses were produced in HEK293T cells by transient cotransfection of lentiviral transfer vector, CMVΔR8.74 packaging plasmid and VGV.G envelope plasmid using Fugene HD (Promega, Mannheim, Germany, http://www.promega.de/en/). Viral supernatants were harvested after 48 hours and used for infection of Isl1‐nlacZ knock‐in R1 ESCs in the presence of 8 µg/ml polybrene. One week after infection, ESCs were flow cytometry‐sorted for eGFP expression. A second Isl1‐overexpressing ESC line was generated using a plasmid‐based approach in E14 ESCs as described earlier 17 providing identical results to the lentiviral approach.
ESCs were differentiated as EBs generated by aggregation of MEF‐depleted 6 × 10⁴ cells per milliliter in ESC medium (without LIF) in low attachment plates coated with 5% poly(2‐hydroxyethyl methacrylate) (Sigma‐Aldrich, Schnelldorf, Germany, http://www.sigmaaldrich.com/germany.html) or by the hanging drop method as described previously 17. For the analysis of beating activity and lacZ staining, day 2 EBs were plated onto gelatine‐coated 24‐ or 6‐well plates. The percentage of wells containing beating EBs was determined during days 7 and 14 of EB differentiation. Beating frequency was measured at day 14 of EB differentiation as the number of beats per minute and statistically evaluated with Prism 5 (GraphPad Software). To derive single cardiomyocytes for immunofluorescence staining, beating areas from day 16 EBs were manually dissected, dispensed into single cells with 1.5 mg/ml collagenase II (290 U/ml; Worthington CLS, Lakewood, NJ, http://www.worthington‐biochem.com/default.html) and transferred onto fibronectin‐coated coverslips in six‐well plates.
Western Blotting
Western blotting was performed using standard protocols, with the following antibodies: anti‐Isl1 (39.4D5; Developmental Studies Hybridoma Bank, Iowa City, Iowa, http://dshb.biology.uiowa.edu/), anti‐Nkx2‐5 (N‐19; Santa Cruz Biotechnology, Heidelberg, Germany, http://www.scbt.com/), and anti‐β‐actin (ab8227; Abcam, Cambridge, UK, http://www.abcam.com/).
LacZ, Immunocytochemistry, and Immunohistology
LacZ staining was performed on plated EBs after fixation with 0.2% glutaraldehyde, incubation in X‐Gal solution containing 1.25 mM K3(Fe(CN)6), 1.25 mM K4(Fe(CN)6), 2 mM MgCl2, 0.02% Nonidet P‐40, and 0.25 mg/ml X‐Gal in phosphate buffered saline. For each differentiation experiment and time point, nuclear lacZ positive cells were counted in 20 EBs from each of the transgenic mouse ESC lines by investigators blinded to the genotype of the cells using a ×40 objective in bright field. To inhibit proliferation, plated EBs were treated with mitomycin C (2 µg/ml; Sigma‐Aldrich) at day 3 of differentiation, and lacZ positive cells were counted on the two following days. For immunofluorescence analysis, day 14 EBs or day 19 cardiomyocytes were fixed in 4% paraformaldehyde and subjected to specific immunostaining using following primary antibodies: cTnT (1:300; Abcam), α‐actinin (1:300; Sigma‐Aldrich), and Isl1 (1:150; Developmental Studies Hybridoma Bank). Immunocytochemistry for Mlc2a (1:200; Synaptic Systems, Goettingen, Germany, http://www.sysy.com/), Mlc2v (1:100; Proteintech, Manchester, UK, http://www.ptglab.com/; 1:100; Synaptic Systems), and Hcn4 (1:100; Abcam) was performed on dissociated cardiomyocytes at day 30 of differentiation. Phalloidin‐AlexaFluor‐594‐conjugate (1:100; Life Technologies) was used to stain F‐actin. For immunohistological analysis of mouse embryonic hearts, cryosections of 6‐µm thickness were probed for Isl1, cTnT (1:1000; EPR3696; Abcam), and phospho‐histone H3 (Ser10) (PHH3)‐AlexaFluor‐647 (1:100; Cell Signaling Technologies, Leiden, Netherlands, http://www.cellsignal.com/). Nuclei were visualized with 4′,6‐diamidino‐2‐phenylindole (DAPI) (Dianova, Hamburg, Germany, http://www.dianova.com/). AlexaFluor‐488‐, AlexaFluor‐594‐, AlexaFluor‐647‐ (1:500; Life Technologies), and Cy3‐conjugated (1:500; Dianova) secondary antibodies specific to the appropriate species were used. Images were captured using either a DMI6000‐AF6000 Leica or a BX60 Olympus fluorescence microscope or a Leica TCS SP5 II confocal laser‐scanning microscope.
Flow Cytometry
For β‐galactosidase (β‐gal)‐based flow cytometry sorting, day 4 EBs were dissociated with 0.25% trypsin and incubated for 2 min with 1 mM C12FDG (Molecular Probes, Darmstadt, Germany, http://www.lifetechnologies.com/de/de/home.html) at 37°C. Isolation of C12FDG+ cells was performed using FACSAria (BD, Heidelberg, Germany, http://www.bd.com/de/), and data were analyzed with FACSDiva software (BD). For Ki67 proliferation flow cytometry analysis, FDG+ sorted cells from 5‐day‐old EBs were fixed with 3.7% formaldehyde, blocked, and incubated with primary Ki67 antibody (1:100; Abcam). Subsequently, AlexaFluor‐647‐conjugated secondary antibody specific to rabbit was used (1:500; Life Technologies). Flow cytometry was performed on a MoFlo XDP (Beckman‐Coulter, Krefeld, Germany, http://www.beckmancoulter.de/), and data were analyzed using Kaluza software (Beckman‐Coulter). For cTnT flow cytometry analysis, day 14 EBs were dissociated with collagenase, fixed with 3.7% formaldehyde, blocked and incubated with primary cTnT antibody (0.4 µg/ml, clone 13‐11; Thermo Scientific, Schwerte, Germany, http://www.thermoscientificbio.com/). For detection, AlexaFluor‐647‐conjugated secondary antibody specific to mouse was used (1:500; Life Technologies). Samples were measured on the FACSCalibur (BD). Data were analyzed using CellQuest software (BD).
Chromatin Immunoprecipitation Assay
Chromatin immunoprecipitation (ChIP) assay was performed on day 4 EBs as previously described 18. Cloning and sequencing of 1000 DNA fragments precipitated by the anti‐Isl1 antibody, followed by stringent validation 19, identified over 600 genes, including the two previously characterized targets of Isl1, Mef2c and Gata6 20. DNA enrichment of the precipitated fragments was measured by quantitative PCR (qPCR) for selected genes. Details on the ChIP protocol can be found in the Supporting Information Methods.
Semiquantitative and Quantitative RT‐PCR
Total RNA was extracted with the RNA Pure Kit (Peqlab, Erlangen, Germany, http://www.peqlab.de/wcms/de/index.php) or Absolutely RNA Kit (Agilent Technologies, Waldbronn, Germany, http://www.agilent.com/home). cDNA was synthesized with Superscript II (Life Technologies) and subjected to semiquantitative RT‐PCR using Phire Hot Start II DNA Polymerase (Finnzymes, Schwerte, Germany, http://www.thermoscientificbio.com/finnzymes/). For quantitative RT‐PCR (qRT‐PCR) analysis, cDNA was synthesized with High‐Capacity cDNA Reverse Transcription Kit (Applied Biosystems, Darmstadt, Germany, http://www.lifetechnologies.com/de/de/home.html). One microliter of the RT reaction together with the Power SYBR Green or TaqMan Universal PCR Master Mix (Applied Biosystems) was used for the subsequent qPCR. Gene expression levels were normalized to Gapdh. Primer sequences and TaqMan probes are provided in Supporting Information Table S1. The results illustrated in Figure 3A were obtained using a customized qRT‐PCR TaqMan Low Density Array (IMGM Laboratories, Martinsried, Germany, http://www.imgm.com/).
Figure 3.
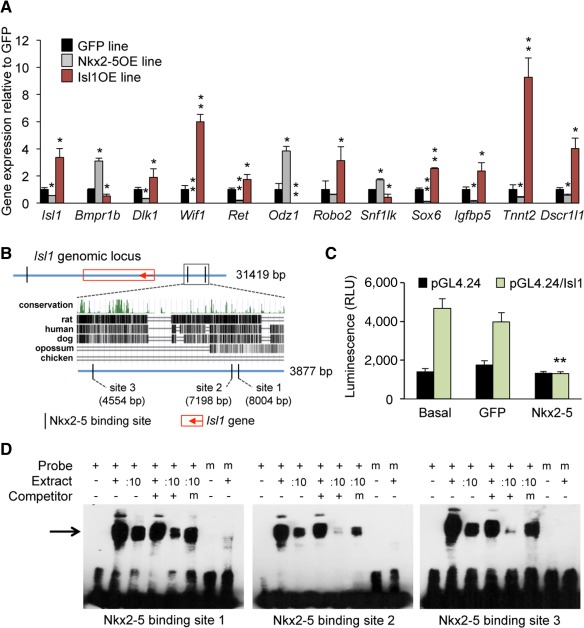
Nkx2–5 negatively regulates cardiac progenitor specification by direct inhibition of Isl1 transcription. (A): Expression levels of Isl1 downstream target genes in FDG+ cells sorted from GFP (black bars), Nkx2–5OE (gray bars), and Isl1OE (red bars) 4‐day‐old embryoid bodies (EBs). Values are relative to GFP and presented as mean ± SEM from three independent experiments; *, p < .05 and **, p < .01 versus GFP. (B): Genomic locus of Isl1 gene 10 kb upstream and 10 kb downstream of the coding sequence with predicted Nkx2–5 binding sites (5′‐TYAAGTG‐3′). The 3.9‐kb region at 4.3 kb upstream of the Isl1‐ATG contains three highly conserved Nkx2–5 binding sites, as shown in a cross‐species sequence comparison. (C): Bar graph of luciferase activity. A minimal‐promoter‐containing pgl4.24 vector is compared with the same vector containing the 3.9 kb DNA piece upstream of Isl1 highlighted in panel B. Experiments are performed in C3H 10T1/2 cells after cotransfection with an empty expression vector (basal) or with vectors encoding Nkx2–5 and GFP. Data are means ± SEM; **, p < .01; n = 8. (D): Electromobility shift assay using 27–29 bp labeled probes containing each Nkx2–5 binding site within the 3.9 kb region upstream of Isl1. A black arrow indicates the shifted band. Nuclear extract of HEK293T cells overexpressing Nkx2–5 is used to induce shifting. :10, nuclear extract diluted 1 to 10. Nonlabeled oligos and mutated nonlabeled oligos are used as competitors. Mutated, labeled oligos are used as negative control. Abbreviations: GFP, green fluorescent protein; RLU, relative light unit.
Luciferase Assay
A −4.5 to 8.0 kb Isl1 enhancer region encompassing three Nkx2‐5 binding sites was inserted into a minimal‐promoter‐containing luciferase reporter plasmid pgl4.24 (Promega). Luciferase assays were performed in C3H 10 T1/2 cells as described 18.
Electrophoretic Mobility Shift Assay
HEK293T cells were transiently transfected with pcDNA‐Nkx2‐5 plasmid using SuperFect Transfection Reagent (Qiagen, Hilden, Germany, http://www.qiagen.com/de/) and 48 hours later nuclear protein extracts were prepared with NE‐PER Nuclear and Cytoplasmic Extraction Reagent Kit (Thermo Scientific). Double stranded DNA probes, generated by annealing of sense and antisense oligonucleotides, were biotin‐labeled using Biotin 3′ End DNA Labeling Kit (Thermo Scientific) and Nkx2‐5 DNA‐binding activity was determined by the nonradioactive LightShift Chemiluminescent electromobility shift assay (EMSA; Thermo Scientific). For blotting, a Biodyne B nylon membrane (Thermo Scientific) was used. Signals were detected by applying stabilized Streptavidin Horseradish Peroxidase Conjugate and luminol solution (Thermo Scientific). The sequences of EMSA oligonucleotides are listed in Supporting Information Table S1.
In Situ Hybridization in Mouse Embryos
Whole‐mount RNA in situ hybridization was carried out as described 3. Isl1‐ and Nkx2‐5‐cDNA‐pCR‐BluntII‐TOPO clones were used to synthesize antisense and sense RNA probes. Tbx5 in situ probe was kindly provided by Sylvia Evans (University of California‐San Diego, La Jolla, CA) 3. Wnt11 in situ probe was kindly provided by Andreas Kispert (Hannover Medical School, Hannover, Germany) 21.
Cardiomyocyte Purification
Days 14 and 21 EBs were dissociated with collagenase followed by the digestion with 20 µg/ml DNAse I (Roche, Mannheim, Germany, http://lifescience.roche.com/shop/en/de/home). Cells resuspended in ADS buffer (6.8 g/l NaCl, 4.76 g/l HEPES, 0.12 g/l NaH2PO4, 1 g/l glucose, 0.4 g/l KCl, and 0.1 g/l MgSO4) were layered on top of a gradient consisting of a bottom layer of 1.082 g/ml and a top layer of 1.059 g/ml percoll (Sigma‐Aldrich) and centrifuged for 30 minutes at 1,851g. Cardiomyocytes from the pellet fraction were subjected to the qRT‐PCR analysis. The purity of cardiomyocytes was 80–90% as assessed by immunofluorescence examination (data not shown).
Optical Action Potential Recordings and Analysis
Cardiac explants from 1‐month‐old EBs were dissociated with collagenase and cardiomyocytes were seeded onto collagen‐coated glass coverslips. Cells were measured at days 2 and 3 after dissociation with the voltage sensitive fluorescent probe di‐8‐ANEPPS. Imaging of the dye‐labeled cells was performed using a custom‐made ultra‐fast ratiometric imaging system (image acquisition at 500 frames per second). Recordings were acquired either in Tyrode (basal conditions) or in Tyrode containing 3 or 30 µM ivabradine. All experiments were performed at 35°C. Details on the optical action potential (AP) recordings and analysis protocol can be found in the Supporting Information Methods.
Statistical Analysis
All data were expressed as means ± SEM or as weighted means ± weighted SEM. Data that passed tests for normality and equal variance were analyzed using a two‐tailed Student's t test. Data that did not fulfill these criteria were subjected to the Mann‐Whitney test. Distribution of cardiomyocyte subgroups was analyzed using a Chi‐squared test. p values <.05 were considered statistically significant.
Results
Precocious Overexpression of Nkx2‐5 in Mouse ESCs Suppresses Cardiac and Hemangioblast Programs During Early Mesoderm Development
Using a PGK‐IRES‐eGFP lentiviral vector system, we constitutively overexpressed Nkx2‐5 in the Isl1‐nlacZ knock‐in ESC line (Nkx2‐5OE ESCs) in which Isl1 gene expression can be monitored by expression of β‐gal. As control, we generated an analogous line by transfection of the empty PGK‐IRES‐eGFP vector (GFP ESCs) (Fig. 1A). eGFP expression allowed detection and mechanical isolation of recombinant transduced clones. Overexpression of Nkx2‐5 at the protein level was confirmed in undifferentiated Nkx2‐5OE ESCs (Fig. 1B). Consistent with our previously reported results 6, Isl1‐expressing progenitors arose normally within 3–5 days of EB differentiation in control GFP ESCs, as demonstrated by β‐gal activity and Isl1 mRNA transcript detection (Fig. 1C–1E), while Nkx2‐5 just began to be expressed at day 5 (Figs. 1E, 2C). The constitutive precocious overexpression of Nkx2‐5 resulted in a delayed appearance and reduction of lacZ positive cells (Fig. 1C, 1D), which was associated with a delayed expression of key transcription factors implicated in SHF progenitor regulation, including Tbx20 2, Gata4 20, Fgf10 22, 23, and Kdr 6 (Fig. 1E), suggesting a suppression of Isl1‐mediated cardiac precursor specification by Nkx2‐5. Notably, also Tbx5, which is predominantly expressed in FHF precursors 24, 25, and the recently identified FHF progenitor marker Hcn4 26, 27, as well as the early cardiac differentiation marker cTnT were downregulated in the early stages of EB differentiation of Nkx2‐5OE ESCs (Fig. 1E), indicative of a more general inhibition of the cardiac program. These results corroborate the previous findings in global Nkx2‐5 knockout mice, in which lack of Nkx2‐5 caused an upregulation and ectopic expression of Isl1 and other early cardiac progenitor genes, leading to an overspecification of cardiac precursor cells 4. Because earlier studies suggested that hematopoietic and endothelial cells as well as cardiomyocytes and endothelial/smooth muscle cells are derived from common progenitors expressing Kdr 28, 29 and this gene was upregulated in Nkx2‐5OE EBs at day 5, we also examined whether forced overexpression of Nkx2‐5 during early ESC differentiation could change the commitment of mesodermal progenitors from the cardiac toward the hemangioblast fate. Quantitative RT‐PCR analysis for different endothelial/hematopoietic markers (Cd34, Pecam‐1, Cdh5, Tie2, and Gata1) as well as the smooth muscle gene Acta2 revealed that all these transcripts were downregulated in 5‐day‐old Nkx2‐5OE EBs (Supporting Information Fig. S1), suggesting that the cardiac regulator Nkx2‐5 acts also as repressor of the hemangioblast program during mouse mesoderm fate determination in vitro, similarly to its reported effects in vivo 30, 31.
Figure 1.
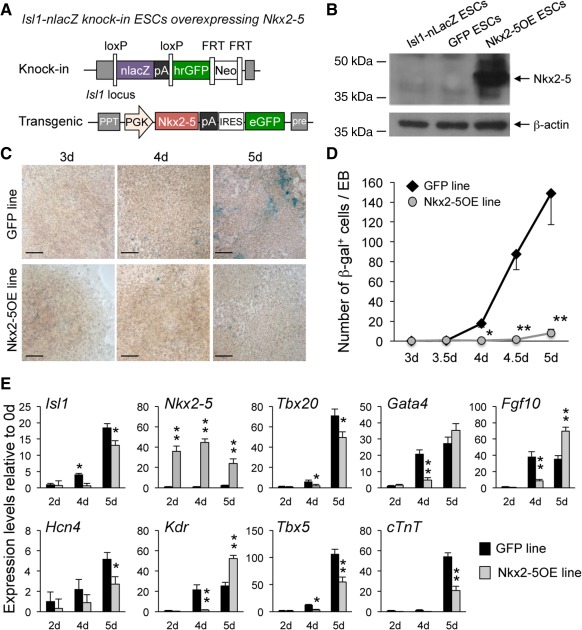
Precocious overexpression of Nkx2–5 in mouse ESCs suppresses the cardiac program during early mesoderm development. (A): Generation of Nkx2–5OE ESCs by lentiviral‐mediated Nkx2–5 overexpression in the Isl1‐nlacZ knock‐in ESC line. An empty IRES‐eGFP vector was used to obtain the control GFP ESC line. (B): Western blot analysis of Nkx2–5 protein in undifferentiated parental Isl1‐nlacZ knock‐in, GFP, and Nkx2–5OE ESCs. β‐Actin is shown as a loading control. (C): LacZ reporter gene expression assessed by X‐Gal staining in EBs from GFP (top panels) and Nkx2–5OE (bottom panels) ESCs at days (d) 3, 4, and 5 of differentiation. Scale bars = 150 µm. (D): Quantification of β‐gal+ cells arising during EB differentiation of GFP (black diamonds) and Nkx2–5OE (gray circles) ESCs at indicated time points. Mean values ± SEM from three experiments; *, p < .05 and **, p < .01 versus GFP. (E): Quantitative reverse transcription polymerase chain reaction analysis of cardiac progenitor genes in GFP (black bars) and Nkx2–5OE (gray bars) differentiating EBs at the indicated time points. Data are mean ± SEM from three independent experiments; *, p < .05 and **, p < .01 versus GFP at the same time point. Abbreviations: EB, embryoid body; ESC, embryonic stem cell; FRT, flippase recognition target; GFP, green fluorescent protein; IRES, internal ribosome entry site; PGK, phosphoglycerate kinase; PPT, polypurine tract.
Figure 2.
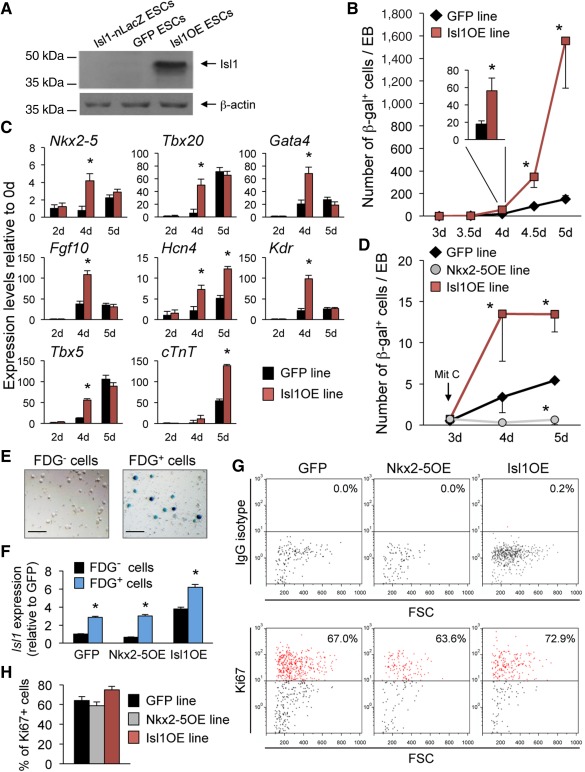
Constitutive Nkx2–5 and Isl1 overexpression have opposing effects on the specification of Isl1+ cardiac progenitors in mouse ESCs. (A): Western blot analysis of Isl1 protein in undifferentiated parental Isl1‐nlacZ knock‐in, GFP, and Isl1OE ESCs. β‐Actin is shown as a loading control. (B): Quantification of β‐gal+ cells arising during EB differentiation of GFP (black diamonds) and Isl1OE (red squares) ESCs at indicated time points. For better visualization, the number of β‐gal+ cells per EB is shown at d4 as inset (GFP, black bar; Isl1OE, red bar). Mean values ± SEM from three experiments; *, p < .05 versus GFP. (C): Quantitative reverse transcription polymerase chain reaction analysis of cardiac progenitor genes in GFP (black bars) and Isl1OE (red bars) differentiating EBs at the indicated time points. Mean values ± SEM from three independent experiments; *, p < .01 versus GFP at the same time point. (D): Quantification of β‐gal+ cells arising during EB differentiation of GFP (black diamonds), Nkx2–5OE (gray circles), and Isl1OE (red squares) ESCs at indicated time points after mitomycin C (Mit C) treatment at day 3. Mean values ± SEM from three experiments; *p < .05 versus GFP. (E): Representative bright field images of flow cytometry‐sorted FDG− (left) and FDG+ (right) cells after X‐Gal staining; scale bars = 150 µm. (F): Quantitative RT‐PCR analysis of Isl1 transcript in FDG− (black bars) and FDG+ (blue bars) cells after flow cytometry purification from GFP, Nkx2–5OE, and Isl1OE 4‐day‐old EBs. Values are relative to GFP and presented as mean ± SEM from three independent experiments; *, p < .01 versus FDG– cells from the same ESC line. (G, H): Flow cytometry analysis for Ki67 (lower panels) and IgG control (upper panels) of FDG+ sorted cells from 5‐day‐old GFP, Nkx2–5OE, and Isl1OE EBs (G). Quantification of Ki67+ cells in GFP (black bar), Nkx2–5OE (gray bar), and Isl1OE (red bar) EBs. Mean values ± SEM from three experiments (H). Abbreviations: EB, embryoid body; ESC, embryonic stem cell; FSC, forward side scatter; GFP, green fluorescent protein.
Nkx2‐5 Negatively Regulates Cardiac Progenitor Specification by Direct Inhibition of Isl1 Transcription
We further tested the hypothesis that the negative effects of Nkx2‐5 on cardiac progenitor development of mouse ESCs in vitro are caused by repression of Isl1 and its transcriptional program. We first generated an Isl1‐nlacZ knock‐in ESC line that overexpresses Isl1 (Isl1OE ESCs) (Fig. 2A) and analyzed whether constitutive Isl1 overexpression would have opposite effects on the initiation of the cardiac program as compared to those exerted by Nkx2‐5. Indeed, β‐gal activity and expression profiling revealed an increased number of lacZ positive cells arising at day 4 of EB differentiation and a consistent upregulation of SHF and FHF cardiac progenitor markers in Isl1OE compared to control GFP ESCs (Fig. 2B, 2C), indicating opposed regulation of cardiac induction by the two transcription factors. To dissect the specific contribution of cell specification and proliferation to the observed phenotypes, we first compared the occurrence of lacZ positive cells during early EB differentiation of the control GFP, Isl1OE, and Nkx2‐5OE lines in presence of the antimitotic agent mitomycin C (Fig. 2D). Mitomycin C treatment of 3‐day‐old EBs resulted in a striking reduction of lacZ positive cells arising at days 4 and 5 of EB differentiation in both GFP and Isl1OE ESCs (Fig. 2D). No cells expressing β‐gal were detected in the Nkx2‐5OE line after mitomycin C application (Fig. 2D), indicating a lack of Isl1+ progenitor specification during early stages of Nkx2‐5OE EBs. Moreover, the number of lacZ positive cells specifying at 4‐day‐old EBs was significantly higher in the Isl1OE condition compared to control and did not progressively increase at day 5 (Fig. 2D), indicating that induction of Isl1+ progenitors is indeed increased and faster completed in the Isl1OE line. We further examined the proliferation capacity of purified Isl1+ cardiac progenitors from 5‐day‐old EBs of Nkx2‐5OE, Isl1OE, and GFP ESCs. Isolation of Isl1+/lacZ+ cells was performed by fluorescence‐activated cell sorting (FACS) after labeling with the fluorogenic, lipophilic β‐gal substrate C12FDG (Supporting Information Fig. S2), as previously described 32. Subsequent X‐Gal staining on a small fraction of sorted cells demonstrated a purity of 90–95% of the C12FDG+ cells (Fig. 2E), and Isl1 expression was significantly increased in C12FDG+ cells compared to C12FDG− cells, as measured by qRT‐PCR (Fig. 2F). Immunostaining for the proliferation marker Ki67 revealed similar proliferation rates of purified Isl1+/lacZ+ progenitors from the different transgenic ESC lines, with a tendency to a slightly higher proliferation in Isl1OE cells (Fig. 2G, 2H). These findings suggest that the differences in the number of lacZ+ cells observed upon constitutive Isl1 and Nkx2‐5 overexpression mainly arise from opposing effects on Isl1+ progenitor specification by the two transcription factors. Moreover, overexpression of Isl1 in Nkx2‐5OE ESCs compensated for Nkx2‐5 repressive effects in this context (Supporting Information Fig. S3), further supporting a possible role of Isl1 as target for Nkx2‐5 action.
We next performed ChIP analysis on day 4 differentiating EBs from the Isl1‐nlacZ knock‐in ESC line in order to identify direct Isl1 target genes. We selected several of the identified genes with potential roles in regulating Isl1 progenitor biology and whose ablation in mouse leads to cardiac phenotypes, and further analyzed their expression in the Isl1OE and Nkx2‐5OE ESCs. These genes belong to signaling pathways involved in cardiac development, such as the bone morphogenetic protein receptor, type 1B (Bmpr1b), the Notch ligand delta‐like 1 homolog (Dlk1) and the WNT inhibitory factor 1 (Wif1), or regulate cell growth and differentiation (the ret proto‐oncogene, Ret), migration (the transmembrane protein Odz1 and the axon guidance receptor Robo2) and transcription (the myocardial SNF1‐like kinase, Snf1lk), or are either cardiac transcription factors (the SRY‐box containing gene 6, Sox6), cardiac progenitor markers (the insulin‐like growth factor binding protein 5, Igfbp5), or cardiac muscle genes (the cardiac troponin T, Tnnt2, and the myocyte‐enriched calcineurin‐interacting protein 1, Dscr1l1). For all selected genes, specific enrichment in the precipitated DNA could be validated by quantitative PCR analysis (Supporting Information Fig. S4).
In order to test whether the delay of cardiac progenitor specification in Nkx2‐5OE ESC‐derived cells was mediated by an inhibition of Isl1 transcription, we analyzed the expression level of Isl1 and its selected downstream target genes in FACS‐sorted C12FDG+/Isl1+ cardiac progenitors from day 5 differentiating EBs of Nkx2‐5OE, Isl1OE, and GFP ESCs. Quantitative RT‐PCR analysis demonstrated a nearly 50% reduction of Isl1 transcripts in Nkx2‐5‐overexpressing cells, which was accompanied by a dysregulation of Isl1 target genes (Fig. 3A). Importantly, the changes in expression levels of all selected Isl1 target genes occurred in opposite direction compared to those induced by Isl1, strongly suggesting that Nkx2‐5 is a negative regulator of Isl1 transcription. This hypothesis was also corroborated by a lower C12FDG fluorescence (Supporting Information Fig. S2B) and X‐Gal staining intensity (Fig. 1C) of Isl1+/lacZ+ cells derived from Nkx2‐5OE ESCs compared to control GFP ESCs.
To determine whether Nkx2‐5 can directly repress Isl1 transcription, we analyzed evolutionarily conserved regions within ±10 kilobase (kb) of the transcription start site (TSS) of the Isl1 gene for the presence of Nkx2‐5 DNA‐binding sites. A cluster of three putative Nkx2‐5 DNA‐binding motifs (5′‐TYAAGTG‐3′) was found in the region 4.5–8.0 kb upstream of the TSS (Fig. 3B). We examined the ability of the −4.5 to −8.0 kb Isl1 enhancer region to regulate transactivation of a luciferase reporter construct by Nkx2‐5. Introduction of the −4.5 to −8.0 kb Isl1 enhancer element upstream of a minimal promoter resulted in an about threefold increase in basal luciferase activity compared to the empty vector (Fig. 3C). However, this increase was completely abolished by Nkx2‐5, while no effect was observed with a control protein (GFP) (Fig. 3C), suggesting that Nkx2‐5 acts as a transcriptional repressor at the in silico identified Nkx2‐5 affinity sites. To determine whether the candidate Nkx2‐5 sites in the −4.5 to −8.0 kb Isl1 enhancer region might represent bona fide cis‐acting elements, we tested each of the three sites for Nkx2‐5 binding by EMSAs. Nkx2‐5 specifically bound to all three sites, since the binding was efficiently competed by excess of unlabeled probes, but not by mutant versions of unlabeled competitors, and was abolished using mutated labeled probes (Fig. 3D).
Negative Regulation of Isl1 by Nkx2‐5 Occurs During SHF Progenitor Differentiation into Cardiomyocytes In Vivo
To further investigate the biological significance of Isl1 inhibition by Nkx2‐5 in vivo, we performed Cre‐mediated excision of Nkx2‐5 in the Isl1 lineage. We crossed mice that were floxed for Nkx2‐5 (Nkx2‐5fl/fl) 11 to Isl1Cre/+ mice, in which the Cre recombinase is expressed under control of the Isl1 locus 12 (Fig. 4A). Isl1Cre/+;Nkx2‐5fl/fl mice exhibited growth retardation at around ED9.0 and died at around ED10.5, consistently with recently reported data 33. Whole‐mount RNA ISH showed that the Isl1‐Cre‐mediated recombination of floxed Nkx2‐5 alleles was efficient and tissue specific (Fig. 4B and Supporting Information Fig. S5A, S5B). Interestingly, Nkx2‐5 transcript was lost in almost all cells forming the heart of Isl1Cre/+;Nkx2‐5fl/fl mice at ED9.5 (Fig. 4B), demonstrating that Isl1 is indeed a pan‐cardiac progenitor cell marker, as previously suggested 5. Morphological comparison of Isl1+/+;Nkx2‐5fl/fl littermates to their mutant counterparts at ED9‐9.5 (16–21 somite pairs) (Fig. 4B, 4C) indicated a grossly truncated outflow tract (OFT) and indistinct right ventricle (RV), with forward growth of the ventricle in the absence of looping morphogenesis, thus highlighting a prominent SHF defect, similar to that observed in global Nkx2‐5 null mice 4, 8. Loss of RV and foreshortened OFT in Isl1Cre/+;Nkx2‐5fl/fl mutants was also confirmed by ISH analysis using markers for OFT and ventricular tissue identity (Supporting Information Fig. S6). Importantly in Isl1Cre/+;Nkx2‐5fl/fl mutants at ED9.0 Isl1 transcript was rather decreased in SHF progenitor cells that were added to the arterial and venous poles, but persisted in cardiomyocytes of the heart tube (Fig. 4C, 4D and Supporting Information Fig. S5C–S5F). A detailed examination of Isl1 expression by immunohistochemistry confirmed that Isl1 protein was still maintained throughout the whole mutant heart (Fig. 4D), while in the control littermates Isl1 was only detectable in the differentiating myocytes of the OFT and nascent myocardium of the sinus venosus, the primitive pacemaker region that later gives rise to the sinoatrial node. Furthermore, the number of Isl1 positive cells in the splanchnic mesoderm and foregut endoderm as well as their proliferative index scored by phosphohistone H3 did not significantly differ in Isl1Cre/+;Nkx2‐5fl/fl mutants (Supporting Information Fig. S7), suggesting that the lower Isl1 transcript signal observed by ISH in SHF progenitors is likely to be attributable to the 50% reduction of Isl1 expression in heterozygous Isl1Cre/+ mice (Supporting Information Fig. S8) rather than to a defect in proliferation.
Figure 4.
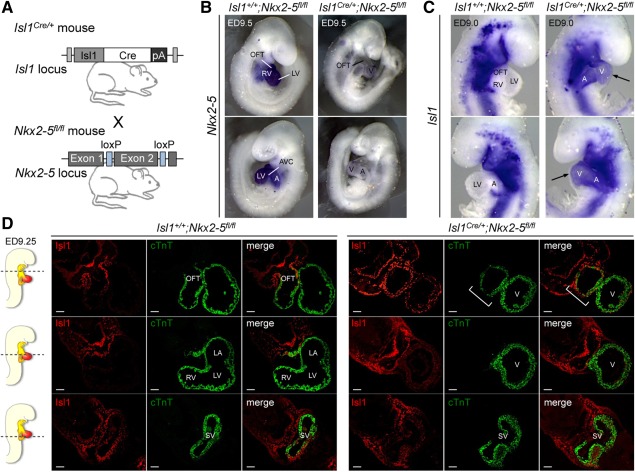
Negative regulation of Isl1 by Nkx2–5 occurs during second heart field progenitor differentiation into cardiomyocytes in vivo. (A): Isl1‐Cre knock‐in mice (Isl1Cre/+) were crossed with mice carrying floxed Nkx2–5 alleles (Nkx2–5fl/fl) to generate tissue‐specific deletion of Nkx2–5. (B): Whole‐mount in situ analysis for expression of Nkx2–5 mRNA (dark blue) in Isl1‐Cre;Nkx2–5 mutants (Isl1Cre/+;Nkx2–5fl/fl, right panels) and somite‐matched littermate controls (Isl1+/+;Nkx2–5fl/fl, left panels) at ED9.5 (20–21 somite pairs). (C): Whole‐mount RNA in situ hybridization for Isl1 in ED9.0 embryos (16 somite pairs) from Isl1+/+;Nkx2–5fl/fl controls (left panels) and Isl1Cre/+;Nkx2–5fl/fl mutants (right panels). Arrows indicate persisting Isl1 expression in the forming ventricular and atrial regions of the mutant hearts. Images are representative of five embryos per genotype. (D): Representative images of transverse sections of control Isl1+/+;Nkx2–5fl/fl (left panels) and mutant Isl1Cre/+;Nkx2–5fl/fl (right panels) ED9.25 embryos (18–19 somite pairs) after immunofluorescence analysis of Isl1 (red) and cTnT (green) protein expression. Sections correspond to the position indicated by the lines drawn through the adjacent embryo view. Scale bars = 50 µm. Images are representative of three embryos per genotype. White bracket marks malformed RV/OFT in Nkx2–5 mutants. Abbreviations: A, atria; AVC, atrioventricular canal; LA, left atrium; LV, left ventricle; OFT, outflow tract; RV, right ventricle; SV, sinus venosus; V, ventricle.
Together, these results suggest that inhibition of Isl1 transcription by Nkx2‐5 is likely to occur in vivo during SHF progenitor differentiation and identify Nkx2‐5 as direct responsible mediator of Isl1 repression in differentiated cardiomyocytes of the working myocardium.
Overexpression of Isl1 Does Not Prevent Cardiac Differentiation in Mouse ESCs and Xenopus laevis Embryos
In order to investigate the functional role of Nkx2‐5‐mediated repression of Isl1 during cardiac differentiation, we first analyzed the in vitro cardiac differentiation potential of Isl1OE ESCs (Fig. 5A–5E). Interestingly, overexpression of Isl1 did not prevent these cells from generating functional cardiomyocytes, as demonstrated by the appearance of a contractile phenotype in differentiating cultures (Fig. 5A). To the contrary, cardiac differentiation as measured by the appearance of spontaneously beating foci occurred significantly earlier in comparison to GFP (Fig. 5A and Supporting Information Fig. S9A). Marker gene analyses by semiquantitative RT‐PCR indicated a continuous and strong expression of exogenous Isl1 in days 6–14 EBs from the Isl1OE line and upregulation of genes linked to SHF development, for example, Bmp4, Foxc2, or Fgf8 (Supporting Information Fig. S9B). In concordance with the increased number in contractile areas, immunofluorescence revealed more and larger areas of cells positive for the cardiac specific sarcomeric protein Troponin T (cTnT) in Isl1OE when compared to GFP EBs (Fig. 5B). Flow cytometry analysis confirmed that constitutive Isl1 overexpression led to a ∼6‐fold increase in differentiated cardiomyocytes (Fig. 5C), likely due to the enhanced specification of cardiac progenitors (Fig. 2B, 2C). A closer inspection of differentiated single cardiomyocytes demonstrated the formation of a normal contractile apparatus in Isl1‐overexpressing cells, as shown by immunostaining for the Z‐disk protein α‐actinin and the A‐band protein cTnT (Fig. 5D and Supporting Information Fig. S10). In both cases, a clear sarcomeric patterning similar to the control situation was observed (Supporting Information Fig. S10). Interestingly, when comparing the beating frequency of contracting areas of differentiating EBs, we found that Isl1‐overexpressing cells exhibited a faster spontaneous firing rate than GFP (Fig. 5E and Supporting Information Fig. S9C), which is typical of nodal myocytes 34. This finding is in accordance with the upregulation of the pacemaker ion channel gene Hcn4 as demonstrated by RT‐PCR in differentiating Isl1OE EBs (Fig. 2C and Supporting Information Fig. S9B).
Figure 5.
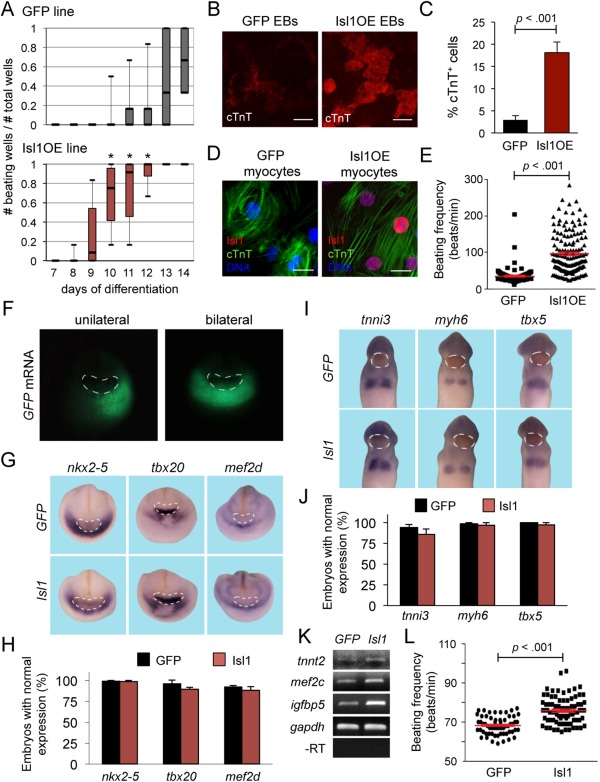
Constitutive overexpression of Isl1 does not prevent cardiac differentiation in mouse embryonic stem cells (ESCs) and in Xenopus laevis embryos. (A): Analysis of beating activity during EB differentiation of GFP (top) and Isl1OE (bottom) ESCs. Median values, first and third quartile as well as minimal and maximal values are given of five independent experiments; *, p < .005 versus GFP ESC line. (B): Representative images of 14‐day‐old EBs from GFP and Isl1OE ESCs after immunofluorescence staining for cTnT (red), indicating that Isl1 overexpression results in bigger myocyte clusters; scale bars = 100 µm. (C): Flow cytometry‐based quantification of cTnT+ cells at 14 days of EB differentiation of GFP and Isl1OE ESCs. Mean values ± SEM from eight independent experiments. (D): Immunofluorescence images of GFP and Isl1OE cardiomyocytes following staining with antibodies against Isl1 (red) and cTnT (green); nuclei (blue) are visualized by DAPI. Scale bars = 15 µm. (E): Beating frequency of contractile areas in GFP (black filled squares) and Isl1OE (black filled triangles) EBs at 14 days of differentiation. Mean values ± SEM, n = 170 for GFP and n = 150 for Isl1OE from six to seven independent experiments. (F): GFP expression after unilateral and bilateral coinjection of GFP and Isl1 mRNA into the cardiac region of Xenopus embryos. The cement gland is indicated by dashed white circles. (G, H): Whole‐mount RNA in situ analysis of Xenopus embryos for expression of the cardiac markers nkx2–5, tbx20, and mef2d (blue) after unilateral injection of GFP alone (upper images) or in conjunction with isl1 (lower images) in the forming hearts of stage 20 Xenopus embryos. The cement gland is indicated by dashed white circles (G). Percentage of embryos with normal expression of the tested marker genes on the injected side compared to the uninjected side is indicated in the bar graph; n = 53–85 for GFP (black bars) alone and n = 67–88 for isl1 (red bars) from three to four independent experiments (H). (I, J): Whole‐mount RNA in situ of Xenopus embryos analysis for expression of the cardiac markers tnni3, myh6, and tbx5 (blue) after unilateral injection of GFP alone (upper images) or in conjunction with isl1 (lower images) in the forming hearts of stage 28 Xenopus embryos. The cement gland is indicated by dashed white circles (I). Percentage of embryos with normal expression of the tested marker genes on the injected side compared to the uninjected side is indicated in the bar graph; n = 63‐111 for GFP (black bars) alone and n = 61–78 for isl1 (red bars) from three to four independent experiments (J). (K): RT‐PCR expression analysis of Isl1 downstream target genes after bilateral injection of GFP alone or in conjunction with isl1 on heart explants of stage 24 Xenopus embryos. Changes in gene expression were observed in at least three out of four independent experiments. (L): Beating frequency of Xenopus hearts after bilateral injection of GFP mRNA alone (black filled circles) and GFP/isl1 mRNAs (black filled squares) at stage 42. Mean values ± SEM, n = 60 for GFP alone and n = 80 for GFP/isl1 from three independent experiments. Abbreviations: EB, embryoid body; GFP, green fluorescent protein; mRNA, messenger RNA.
To further substantiate these findings in vivo, we performed Isl1‐gain‐of‐function experiments in Xenopus laevis embryos. As we showed previously, Xenopus isl1 and nkx2–5 are coexpressed in the common cardiac progenitors. Whereas isl1 expression in cardiac cells is downregulated, nkx2–5 expression persists during differentiation of cardiomyocytes also in X. laevis 14, 15. We microinjected RNA coding for Xenopus isl1 into the presumptive cardiac region of Xenopus embryos at eight‐cell stage. GFP RNA was coinjected to select for correctly injected embryos that harbor GFP expression in the cardiogenic region (Fig. 5F). To monitor cardiac induction and differentiation, we analyzed the expression of the early cardiac markers nkx2–5, tbx20, and mef2d at stage 20 (Fig. 5G, 5H) as well as cardiac tnni3, myh6, and tbx5 at stage 28 (Fig. 5I, 5J), and did not observe any changes. However, tnnt2, igfbp5, and mef2c, which were identified as Isl1 downstream target genes in our ChIP analysis of differentiating mouse ESCs, were upregulated in Isl1‐overexpressing hearts at stage 24, as measured by semiquantitative RT‐PCR (Fig. 5K). Moreover, the beating frequency of the developing heart in Xenopus embryos at stage 42 was faster upon Isl1 overexpression (Fig. 5L). Taken together, these observations support our finding in murine ESCs that Isl1 gain of function does not interfere with differentiation of cardiac progenitors toward cardiomyocytes but rather may influence SAN versus working myocardial cell fate.
Isl1 Regulates Expression of Cardiac Subtype‐Specific Genes
We used qRT‐PCR to compare the expression of a panel of subtype‐specific genes in control GFP and Isl1OE ESC‐derived cardiomyocytes at different maturation stages. Interestingly, many genes important for development and function of SAN cells were significantly upregulated in Isl1OE cardiomyocytes (Fig. 6A). These included members of the hyperpolarization‐activated cyclic nucleotide‐gated channel family, Hcn4 and Hcn1 35, 36, several components of T‐ and L‐type voltage‐dependent Ca2+ channels, such as the α‐subunits Cav3.1 (Cacna1g) and Cav1.2 (Cacna1c) as well as the auxiliary subunit Cavα2δ2 (Cacna2d2) 37, 38, and critical transcriptional regulators of SAN formation, such as the T‐box transcription factor Tbx2 39, 40 (Fig. 6A). In contrast, expression of Irx4 and Hey2 transcription factors, which play a crucial role in establishing ventricular chamber specification of the developing heart 41, 42, 43, 44, was reduced in Isl1OE cardiomyocytes (Fig. 6A). In addition, these cells failed to upregulate the ventricular specific isoform of myosin light chain 2 (Myl2) 45, 46 and other genes essential for working‐myocardium identity and function, such as the α‐subunit of the cardiac sodium channel Nav1.5 (Scn5a) 35 and the high conductance connexin 43 (Gja1) 47 (Fig. 6A). Likewise, the gap junction protein Cx40 (Gja5) and the atrial chamber specification factor Anf (Nppa), both early and specific markers of the working‐type cardiomyocytes in the nascent atrial and ventricular chambers 47, 48, 49, 50, were downregulated in Isl1OE cardiomyocytes (Fig. 6A). Interestingly, expression of the atrial specific isoform of the myosin light chain 2 (Myl7), which is detected throughout the whole early developing mouse heart and becomes predominant in the atrial tissue and SAN at later embryonic stages 51, was rather increased in Isl1OE cardiomyocytes (Fig. 6A). These data further suggested that maintained Isl1 expression in differentiating cardiomyocytes might negatively affect their working‐myocardium fate in favor of a nodal phenotype.
Figure 6.
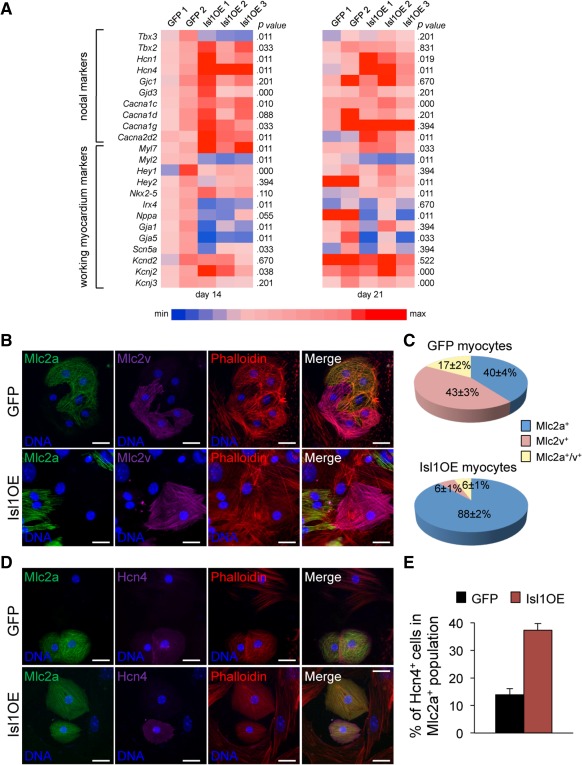
Overexpression of Isl1 promotes expression of nodal lineage markers and represses ventricular program of differentiating myocytes. (A): Expression level of genes specific for nodal and working‐myocardium lineages was determined by qRT‐PCR in GFP and Isl1OE cardiomyocytes at days 14 and 21 in independent EB differentiation experiments (as indicated by numbers). All values are normalized to Gapdh and are relative to the average expression value measured in GFP cells from differentiations 1 and 2 at day 14. p values were calculated using the Mann‐Whitney test. Minimum (min) and maximum (max) values were taken as a reference for heatmap representation. (B, C): Immunofluorescence analysis of Mlc2a (green), Mlc2v (magenta), and F‐actin (red, visualized with Phalloidin) in 1‐month‐old GFP and Isl1OE cardiomyocytes. Scale bars = 25 µm (B). Quantification of Mlc2a+, Mlc2v+ and Mlc2a/Mlc2v‐double positive myocytes from GFP (top) and Isl1OE ESCs (bottom). Mean values ± SEM, n = 189 for GFP and n = 535 for Isl1OE from five to six independent experiments (C). (D, E): Immunofluorescence analysis of Mlc2a (green), Hcn4 (magenta), and F‐actin (red, visualized with Phalloidin) in 1‐month‐old GFP and Isl1OE cardiomyocytes. Scale bars = 25 µm (D). Quantification of Hcn4+ cells in the Mlc2a+ myocyte fraction from GPF and Isl1OE ESCs. Mean values ± SEM, n = 86 for GFP and n = 83 for Isl1OE from two to three independent experiments. Abbreviation: GFP, green fluorescent protein.
To investigate whether the alterations in gene expression profile in the Isl1OE cardiomyocytes indeed reflect a different relative abundance of cardiac cell subtypes, we first performed coimmunofluorescence analysis in 1‐month‐old dissociated cardiomyocytes using antibodies specific for the ventricular and atrial isoforms of the myosin light chain sarcomeric protein (Mlc2v and Mlc2a) as well as the Hcn4 channel, which is highly expressed in the SAN and is required for mature cardiac pacemaker activity 52 (Fig. 6B–6E). In the control GFP group, we detected a similar percentage of cells uniquely expressing Mlc2v (43% ± 3%) or Mlc2a (40% ± 4%) in a well‐organized, striated pattern; a minority (17% ± 2%) was positive for both isoforms, likely representing cardiomyocytes in the stage of specification into the ventricular lineage (Fig. 6C). Interestingly, costaining for the Mlc2 proteins and the Hcn4 pacemaker channel revealed that 14% ± 2% of the Mlc2a positive cardiomyocytes also expressed Hcn4, while no cells only Hcn4+ or Mlc2v+/Hcn4+ were found (Fig. 6D, 6E). The same quantitative analysis in cardiomyocytes differentiated from the Isl1OE line demonstrated a significant, striking reduction of Mlc2v positive cells (6% ± 1% Mlc2v+ and 6% ± 1% Mlc2v+/Mlc2a+) in favor of Mlc2a expressing cells (88% ± 2%), with more than a third of the latter costaining positively for Hcn4 (38% ± 2%) (Fig. 6C, 6E).
These protein analysis results are consistent with the transcript levels measured by qRT‐PCR, and all together suggest a possible function of Isl1 in controlling myocardial cell fate by repressing the ventricular gene program and promoting specification into the nodal lineage.
Isl1 Represses Specification of the Ventricular Lineage While Promoting Sinoatrial Node Fate
We further confirmed the hypothesis that Isl1 regulates cell subtype identity during cardiomyocyte differentiation by analyzing the electrophysiological properties of 1‐month‐old, spontaneously beating single cells isolated from the Isl1OE and control GFP ESC lines. We performed optical imaging of APs 53, 54, which has been recently demonstrated to allow rapid and robust phenotyping of large numbers of pluripotent stem cell‐derived cardiomyocytes 55, 56. Action potentials serve as a “finger‐print” of different cardiomyocyte lineages. Atrial‐ and ventricular‐like APs differ in their plateau shape and duration at 50% (APD50) and 90% (APD90) of repolarization, with the ventricular one having a longer plateau and the atrial being more triangular 57. Thus, we could distinguish these two types of APs based on the value of the ADP90/APD50 ratio 58, which ranged between 1.2 and 1.9 for the ventricular and was larger than 2.5 for the atrial phenotype, respectively (Fig. 7A). The identification of nodal‐like APs was based on the prominent diastolic depolarization (DD) phase (Fig. 7A) and on their sensitivity to ivabradine, a specific and selective blocker of the cardiac pacemaker “funny” current (I f) generated by the Hcn channels 59. Consistently with previous studies on murine embryonic cardiomyocytes 60, treatment with 30 µM ivabradine—a concentration that is sufficient to achieve a complete I f block 61—was able to abolish the spontaneous activity selectively in the nodal cells, while only a reduction of frequency was observed for the APs with a ventricular‐like or atrial‐like phenotype (Supporting Information Fig. S11). Similar findings have been recently reported in mouse ESC‐derived cardiomyocytes using ZENECA ZD7288 as specific Hcn channel blocker 62. Based on the unique AP traits and the pharmacological response to ivabradine, we found that the cardiomyocyte population arising from the control GFP ESC line consisted of 53% ± 2% ventricular, 7% ± 2% atrial, 20% ± 5% nodal, and 20% ± 5% “intermediate” cells, with an AP shape in between the ventricular and atrial phenotype (Fig. 7B). These findings are in accordance with previously published results obtained with classical patch‐clamp electrophysiology 63. Importantly, only 14% ± 3% of the cardiomyocytes overexpressing Isl1 showed ventricular‐like APs, while no change in the proportion of the atrial‐like (11% ± 2%) and “intermediate” (20% ± 6%) AP traits was observed (Fig. 7B). Moreover, 30 µM ivabradine completely abolished the spontaneous electrical firing in more than half of the Isl1OE cells (55% ± 7%), all of which presented marked diastolic depolarization, confirming their nodal identity (Fig. 7B). These results suggested that Isl1 expression in differentiating cardiomyocytes results in an increased specification of the nodal lineage at the expense of the ventricular population. To further investigate whether this effect might associate with an Isl1‐dependent upregulation of Hcn channels during cardiomyocyte induction, we compared the amount of I f current in control GFP and Isl1OE cells with a nodal‐like phenotype by measuring the changes in the steepness of the DD and spontaneous beating rate induced by 3 µM ivabradine, a concentration that blocks only ∼ 60% of I f current in SAN cells 64. We did not observe any significant differences in both parameters between the two groups (Fig. 7C), suggesting a similar expression of Hcn channels in the nodal cells.
Figure 7.
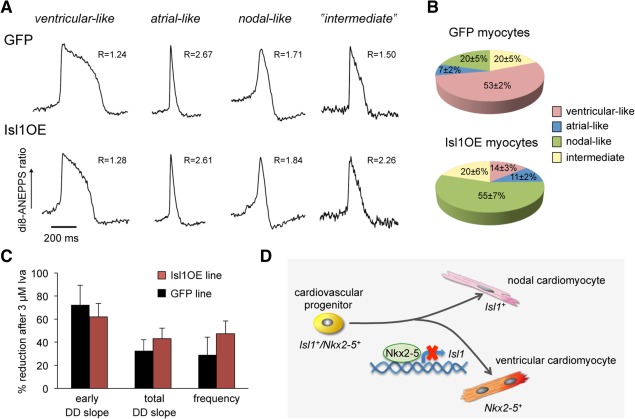
Isl1 overexpression affects subtype diversification of electrophysiologically functional cardiomyocytes. (A): Representative action potential (AP) traces and corresponding APD90/APD50 ratios (R) of 1‐month‐old ventricular‐, atrial‐, nodal‐like, and intermediate cardiomyocytes from GFP and Isl1OE ESCs, as determined with optical imaging using di8‐ANEPPS. (B): Quantification of 1‐month‐old ventricular‐, atrial‐, nodal‐like, and intermediate cardiomyocytes from GFP and Isl1OE ESCs based on the unique AP traits and the pharmacological response to ivabradine. Mean values ± SEM, n = 122 for GFP and n = 65 for Isl1OE from three independent experiments. (C): Percentage of reduction of early and total DD slope as well as AP frequency in 1‐month‐old nodal cardiomyocytes from GFP (black bars) and Isl1OE (red bars) ESCs after 3 µM Iva application. (D): Working model for the regulation of cardiomyocyte subtype specification by Isl1/Nkx2–5‐mediated mechanism. Abbreviations: DD, diastolic depolarization; GFP, green fluorescent protein; Iva, ivabradine.
Discussion
Despite the tremendous progress made during the last 20 years in understanding the molecular mechanisms that govern cardiomyocyte diversification, several questions remain concerning the fine‐tuning of the expression of key developmental regulators, their exact contribution to cardiomyocyte specification and their interaction. During cardiogenesis, Isl1 and Nkx2‐5 are coexpressed in cardiac progenitors of the SHF and are essential for their proper development 3, 4, 6. Subsequently, Isl1 is downregulated in the differentiating myocytic progeny, while Nkx2‐5 expression is maintained and even increases in these cells 6. Several activators of Isl1 expression have been identified, including Tbx1, Fgf8, Shox2, Forkhead proteins, Gata4, and Oct1 65, 66, 67, 68, 69, 70. In contrast, little is known about factors that negatively regulate Isl1 and its transcriptional program. In this context, direct repression of Isl1 transcription in the developing heart has been ascribed to Tbx20 71. However, since upregulation of Isl1 does not account for the cardiac defects observed in Tbx20 null mice 71, the biological significance of this regulation still needs to be explored. Recently, analysis of the developing heart of global Nkx2‐5 knockout mice and zebrafish embryos revealed upregulation of Isl1 and other progenitor markers of the SHF and their ectopic expression in differentiating myocytes, suggesting a major role for Nkx2‐5 in modulating expression of genes associated with cardiac induction and progenitor cell status 4, 18. Our data indicate that Nkx2‐5 can directly regulate Isl1 transcription and is responsible for its downregulation in differentiating myocytes of the working ventricular myocardium (Fig. 7D).
Nkx2‐5 Is a Direct Regulator of Isl1 Expression
Our results led us to the conclusion that the transcription factor Nkx2‐5 directly represses Isl1 expression, thereby controlling its transcriptional program: (a) constitutive overexpression of Nkx2‐5 led to downregulation of Isl1 and its downstream targets in differentiating murine Isl1‐nLacZ knock‐in ESCs; (b) conditional knockout of Nkx2‐5 in the Isl1 lineage resulted in persistent expression of Isl1 in the developing heart tube, corroborating the findings in global Nkx2‐5 deficient mice 4; and (c) we identified a conserved −4.5 to −8.0 kb region within the Isl1 enhancer that contained three consensus Nkx2‐5 binding sites and demonstrated direct binding and regulation by Nkx2‐5. Interestingly, recent molecular and genetic analysis of a Fgf10 cardiac element indicated that Isl1 and Nkx2‐5 can have overlapping binding sites for which they compete, making target gene expression dependent on the expression ratio of these two transcription factors 72. Thus, a similar regulatory relationship between Isl1 and Nkx2‐5 may also be valid for the identified Isl1 downstream targets that showed opposite regulation in Isl1+ progenitors overexpressing either Nkx2‐5 or Isl1.
Furthermore, we showed that forced overexpression of Nkx2‐5 in differentiating mouse ESCs leads to inhibition of cardiac specification, confirming studies attributing a negative regulation of cardiovascular progenitor genes to Nkx2‐5 4. Intriguingly, previous constitutive overexpression of the human NKX2–5 transcript in mouse ESCs through the cytomegalovirus (CMV) promoter has been reported to enhance cardiogenesis in vitro, leading to preferentially differentiated ventricular cardiomyocytes 63. Since specification and differentiation of cardiac lineages during embryonic development is under tight spatial and temporal control that is achieved by the fine regulation of gene networks 1, 2, 73, these discrepancies are likely attributable to technical variances that might result in temporal and cell type differences of Nkx2‐5 dosage during ESC differentiation. For instance, compared to the CMV promoter, whose effectiveness is very cell‐lineage dependent, the phosphoglycerate kinase‐1 (PGK) promoter used in our transgenic lines drives a higher and more stable transgene expression in undifferentiated ESCs and is strongly active in almost all mouse ESC derivatives 74. In contrast to Nkx2‐5 overexpression, forced Isl1 expression promoted Isl1+ precursors and positively regulated cardiac progenitor markers, substantiating earlier work on Isl1 knockout mutant. Importantly, Isl1 could rescue the cardiac specification defect caused by Nkx2‐5, indicating that this phenotype was likely driven by a downregulation of the Isl1 program, which is necessary for early cardiac progenitor specification 3.
In addition, we provide further evidence that Isl1 is likely to be a pan‐cardiac progenitor marker 4, 5, 14, 75, 76. First, Isl1 activated genes of both FHF and SHF during cardiac differentiation of Isl1OE ESCs. Second, conditional ablation of Nkx2‐5 specifically in the Isl1 expression domain resulted in the absence of Nkx2‐5 in virtually all cells of the heart and not only in the SHF derivatives, placing Isl1 high in the hierarchy of the transcription factors active in cardiac progenitors 75.
Isl1 Coordinates Cardiomyocyte Subtype Specification by Repressing the Ventricular Lineage and Promoting the Sinoatrial Node Fate
In ED8.25 mouse embryos, Isl1+ progenitor cells are found dorsal of the developing heart tube in the mesenchyme adjacent to the foregut endoderm. When these cells migrate into the developing heart, they lose Isl1 expression and increase Nkx2‐5 levels 6. Our results suggest that Nkx2‐5 may be directly responsible for the downregulation of Isl1 expression in cardiomyocytes and its confinement to the cardiac precursors. Previous work by others has shown that transient overexpression of Isl1 during EB differentiation leads to an expansion of the myocytic fraction 77, 78. However, the consequences of sustained Isl1 expression and, thus, the biological significance of Isl1 repression in cardiomyocytes were not explored until now. Our study revealed that constitutive Isl1 expression during cardiac development in vitro and in vivo does not prevent myocytic differentiation. On the contrary, we show that excess of Isl1 results in an increased number of myocytes. In addition, our molecular expression profiling combined with the functional analysis of action potentials demonstrated that failed downregulation of Isl1 during cardiac differentiation of mESCs controls cardiomyocyte lineage diversification by repressing the ventricular and promoting the sinoatrial node fates.
Immature cardiomyocytes derived from the in vitro‐differentiated ESCs display properties of nodal cells, making it difficult to distinguish them from each other 79. Being aware of this limitation, we conducted our study comparing cells at different maturation stages and using a pharmacological dissection tool (ivabradine) in order to functionally discriminate between working myocardium and sinoatrial node cardiomyocytes. Many pieces of evidence support our conclusion that persistent Isl1 expression in differentiating cardiomyocytes indeed differentially regulates myocyte lineage specification rather than simply delays maturation. The permanent higher expression level of nodal markers and failure of Isl1OE cardiomyocytes to upregulate working‐myocardium genes even at day 21 of in vitro differentiation—which corresponds to a terminally differentiated state—argues against a mere block of maturation (Fig. 6A). This is further supported by the observation that Isl1OE EBs started to beat earlier than their control counterparts (Fig. 5A) and showed well‐organized sarcomeres (Supporting Information Fig. S10), indicating that cardiomyocyte maturation is not delayed. Most importantly, the high‐throughput AP phenotyping and the pharmacological dissection approaches allowed us to test for cardiomyocyte functionality, evaluate statistical differences in cardiac subtype prevalence, and investigate changes in expression levels of specifically upregulated nodal markers, such as Hcn channels, in single Isl1OE ESC‐derived cardiomyocytes. All together, our results indicate that maintained Isl1 expression does not alter electrophysiological properties of cardiomyocytes but rather assures the establishment of the nodal phenotype at the expense of the ventricular lineage.
Notably, it has been recently reported that treatment of differentiating murine ESCs with 1‐ethyl‐2‐benzimidazolinone (EBIO), an activator of Ca2+‐activated potassium channels of small and intermediate conductance, enriches for pacemaker‐specific gene expression, while suppressing ventricular‐specific genes 80. Interestingly, application of EBIO increased Isl1 expression in the EB culture. Thus, EBIO‐mediated stimulation of the pacemaker gene program is likely to be induced by Isl1 itself. An analogous function of Isl1 in establishing a subtype cell identity has been reported for motor neurons and retinal horizontal cells 81, 82, 83, 84, 85.
Growing evidence suggests that Isl1 expression persists in a small set of differentiated myocytes in fetal and adult hearts 86, 87, 88, 89, 90. These cardiomyocytes coexpress Hcn4, are localized in the SAN region 86, 88, and derive from Isl1‐expressing progenitors, as demonstrated by lineage tracing experiments 26, 87. Moreover, studies in zebrafish indicated a critical role of Isl1 in pacemaker function 91, 92. Isl1 was identified as a Shox2 downstream target gene and rescued Shox2‐mediated bradycardia in zebrafish 67. It is therefore possible that Isl1 exerts a similar role in pacemaker cells of the mammalian heart as well.
Several approaches using pharmacological treatment have been undertaken to generate SAN cells from ESCs, including EBIO, suramin, and anti‐NRG‐1β 34, 80, 93. All compounds led to an enrichment of Hcn4 alongside with Tbx3 and/or Tbx2, which are key regulators of SAN development 40, 94, 95, 96. Tbx3 has been shown to impose pacemaker function on both embryonic atrial myocytes and adult terminally differentiated working cardiomyocytes 95, 97. An overlapping expression pattern of Tbx2 and Tbx3 during early cardiac development and functional equivalence in repressing markers of working myocardial differentiation, such as Nppa and Cx40, has been demonstrated 39, 40, 94. Our data suggest that in Isl1OE cardiomyocytes Tbx2 rather than Tbx3 is implicated in the suppression of chamber‐specific genes Nppa and Cx40, since only Tbx2 was upregulated in Isl1OE cells.
Conclusions
In summary, our findings from Nkx2‐5‐ and Isl1‐overexpressing mouse ESCs as well as conditional Nkx2‐5 knockout and Isl1‐gain‐of‐function mouse and Xenopus models suggest a repressive role of Nkx2‐5 on Isl1 expression, which may act as a molecular switch that determines cardiomyocyte lineage fate. These results provide novel insights into cardiac specialization and may be useful for directing cardiomyocyte in vitro differentiation toward specific subpopulations for disease modeling or regenerative approaches.
Author Contributions
T.D., A.G., and J.T.L.: collection and assembly of data, data analysis and interpretation, manuscript writing, and final approval of manuscript; J.H., Q.T., F.H., K.B., G.D., Y.G., and S.J.K.: collection and assembly of data and final approval of manuscript; M.S.: collection of data and final approval of the manuscript; R.D.: manuscript writing and final approval of the manuscript; D.S. data analysis and interpretation, manuscript writing, financial support, and final approval of the manuscript; P.L., K‐L.L., M.K., and A.M.: conception and design, data analysis and interpretation, manuscript writing, financial support, and final approval of manuscript. T.D., A.G., and J.T.L. contributed equally to this article.
Disclosure of Potential Conflicts of Interest
The authors declare no competing financial interests.
Supporting information
Supplementary Figure 1
Supplementary Figure 2
Supplementary Figure 2
Supplementary Figure 4
Supplementary Figure 5
Supplementary Figure 6
Supplementary Figure 7
Supplementary Figure 8
Supplementary Figure 9
Supplementary Figure 10
Supplementary Figure 11
Supplementary Figure 12
Supplementary Materials and Methods
Supplementary Table 1
Acknowledgments
We thank Kenneth R. Chien (Karolinska Institute) for providing Nkx2‐5fl/fl mice and Sylvia Evans (University of California‐San Diego) for providing Isl1‐Cre mice as well as fruitful discussion. We acknowledge Diana Grewe, Christina Scherb, Birgit Campbell, and Petra Dietmann for their technical assistance.
This work was supported by grants from the European Research Council, MEXT‐23208 and ERC 261053 (K.‐L.L.); the German Research Foundation, Research Unit 923, Mo 2217/1‐1 (A.M.), La 1238 3‐1/4‐1/4‐2 (K.‐L.L.); Si 1747/1‐1 (D.S.); Ku 1166/3‐2 (M.K.); GSC270 (F.H., M.K., Y.G.); European Social Fund and State of Baden‐Württemberg (Eliteprogram for postdocs and MvW scholarship to K.B.); German Centre for Cardiovascular Research (K.‐L.L. and A.M.); Federal Ministry of Education and Research, “CordiLux” (P.L.); HOMFORexzellent (Exzellente junge PostDocs‐Programm der Medizinischen Fakultät to Q.T.).
[The copyright line for this article was changed on August 23, 2019, after original publication.]
References
- 1. Laugwitz K‐L, Moretti A, Caron L, et al. Islet1 cardiovascular progenitors: A single source for heart lineages? Development 2008;135(2):193–205. [DOI] [PubMed] [Google Scholar]
- 2. Vincent SD, Buckingham ME. How to make a heart: The origin and regulation of cardiac progenitor cells. Curr Top Dev Biol 2010;90:1–41. [DOI] [PubMed] [Google Scholar]
- 3. Cai C‐L, Liang X, Shi Y et al. Isl1 Identifies a cardiac progenitor population that proliferates prior to differentiation and contributes a majority of cells to the heart. Dev Cell 2003;5(6):877–889. [DOI] [PMC free article] [PubMed] [Google Scholar]
- 4. Prall OWJ, Menon MK, Solloway MJ et al. An Nkx2‐5/Bmp2/Smad1 negative feedback loop controls heart progenitor specification and proliferation. Cell 2007;128(5):947–959. [DOI] [PMC free article] [PubMed] [Google Scholar]
- 5. Ma Q, Zhou B, Pu WT. Reassessment of Isl1 and Nkx2‐5 cardiac fate maps using a Gata4‐based reporter of Cre activity. Dev Biol 2008;323(1):98–104. [DOI] [PMC free article] [PubMed] [Google Scholar]
- 6. Moretti A, Caron L, Nakano A et al. Multipotent embryonic isl1+ progenitor cells lead to cardiac, smooth muscle, and endothelial cell diversification. Cell 2006;127(6):1151–1165. [DOI] [PubMed] [Google Scholar]
- 7. Wu SM, Fujiwara Y, Cibulsky SM et al. Developmental origin of a bipotential myocardial and smooth muscle cell precursor in the mammalian heart. Cell 2006;127(6):1137–1150. [DOI] [PubMed] [Google Scholar]
- 8. Lyons I, Parsons LM, Hartley L et al. Myogenic and morphogenetic defects in the heart tubes of murine embryos lacking the homeo box gene Nkx2‐5. Genes Dev 1995;9(13):1654–1666. [DOI] [PubMed] [Google Scholar]
- 9. Kasahara H, Bartunkova S, Schinke M et al. Cardiac and extracardiac expression of Csx/Nkx2.5 homeodomain protein. Circ Res 1998;82(9):936–946. [DOI] [PubMed] [Google Scholar]
- 10. Lints TJ, Parsons LM, Hartley L et al. Nkx‐2.5: A novel murine homeobox gene expressed in early heart progenitor cells and their myogenic descendants. Development 1993;119(2):419–431. [DOI] [PubMed] [Google Scholar]
- 11. Pashmforoush M, Lu JT, Chen H et al. Nkx2‐5 pathways and congenital heart disease; loss of ventricular myocyte lineage specification leads to progressive cardiomyopathy and complete heart block. Cell 2004;117(3):373–386. [DOI] [PubMed] [Google Scholar]
- 12. Yang L, Cai C‐L, Lin L, et al. Isl1Cre reveals a common Bmp pathway in heart and limb. Development 2006;133(8):1575–1585. [DOI] [PMC free article] [PubMed] [Google Scholar]
- 13. Nieuwkoop PD, Faber J. Normal Table of Xenopus laevis (Daudin). 2nd ed Amsterdam, The Netherlands: North‐Holland Publishing Company, 1967. [Google Scholar]
- 14. Brade T, Gessert S, Kühl M et al. The amphibian second heart field: Xenopus islet‐1 is required for cardiovascular development. Dev Biol 2007;311(2):297–310. [DOI] [PubMed] [Google Scholar]
- 15. Gessert S, Kühl M. Comparative gene expression analysis and fate mapping studies suggest an early segregation of cardiogenic lineages in Xenopus laevis . Dev Biol 2009;334(2):395–408. [DOI] [PubMed] [Google Scholar]
- 16. Gessert S, Maurus D, Rössner A et al. Pescadillo is required for Xenopus laevis eye development and neural crest migration. Dev Biol 2007;310(1):99–112. [DOI] [PubMed] [Google Scholar]
- 17. Herrmann F, Bundschu K, Kühl SJ et al. Tbx5 overexpression favors a first heart field lineage in murine embryonic stem cells and in Xenopus laevis embryos. Dev Dyn 2011;240(12):2634–2645. [DOI] [PubMed] [Google Scholar]
- 18. Witzel HR, Jungblut B, Choe CP et al. The LIM protein Ajuba restricts the second heart field progenitor pool by regulating Isl1 activity. Dev Cell 2012;23(1):58–70. [DOI] [PMC free article] [PubMed] [Google Scholar]
- 19. Wei C‐L, Wu Q, Vega VB et al. A global map of p53 transcription‐factor binding sites in the human genome. Cell 2006;124(1):207–219. [DOI] [PubMed] [Google Scholar]
- 20. Black BL. Transcriptional pathways in second heart field development. Semin Cell Dev Biol 2007;18(1):67–76. [DOI] [PMC free article] [PubMed] [Google Scholar]
- 21. Kispert A, Vainio S, Shen L et al. Proteoglycans are required for maintenance of Wnt‐11 expression in the ureter tips. Development 1996;122(11):3627–3637. [DOI] [PubMed] [Google Scholar]
- 22. Kelly RG, Brown NA, Buckingham ME. The arterial pole of the mouse heart forms from Fgf10‐expressing cells in pharyngeal mesoderm. Dev Cell 2001;1(3):435–440. [DOI] [PubMed] [Google Scholar]
- 23. Watanabe Y, Miyagawa‐Tomita S, Vincent SD et al. Role of mesodermal FGF8 and FGF10 overlaps in the development of the arterial pole of the heart and pharyngeal arch arteries. Circ Res 2010;106(3):495–503. [DOI] [PMC free article] [PubMed] [Google Scholar]
- 24. Bruneau BG, Logan M, Davis N et al. Chamber‐specific cardiac expression of Tbx5 and heart defects in Holt‐Oram syndrome. Dev Biol 1999;211(1):100–108. [DOI] [PubMed] [Google Scholar]
- 25. Liberatore CM, Searcy‐Schrick RD, Yutzey KE. Ventricular expression of tbx5 inhibits normal heart chamber development. Dev Biol 2000;223(1):169–180. [DOI] [PubMed] [Google Scholar]
- 26. Liang X, Wang G, Lin L et al. HCN4 dynamically marks the first heart field and conduction system precursors. Circ Res 2013;113(4):399–407. [DOI] [PMC free article] [PubMed] [Google Scholar]
- 27. Später D, Abramczuk MK, Buac K et al. A HCN4+ cardiomyogenic progenitor derived from the first heart field and human pluripotent stem cells. Nat Cell Biol 2013;15(9):1098–1106. [DOI] [PubMed] [Google Scholar]
- 28. Choi K, Kennedy M, Kazarov A et al. A common precursor for hematopoietic and endothelial cells. Development 1998;125(4):725–732. [DOI] [PubMed] [Google Scholar]
- 29. Kattman SJ, Huber TL, Keller GM. Multipotent flk‐1+ cardiovascular progenitor cells give rise to the cardiomyocyte, endothelial, and vascular smooth muscle lineages. Dev Cell 2006;11(5):723–732. [DOI] [PubMed] [Google Scholar]
- 30. Caprioli A, Koyano‐Nakagawa N, Iacovino M et al. Nkx2‐5 represses Gata1 gene expression and modulates the cellular fate of cardiac progenitors during embryogenesis. Circulation 2011;123(15):1633–1641. [DOI] [PMC free article] [PubMed] [Google Scholar]
- 31. Simões FC, Peterkin T, Patient R. Fgf differentially controls cross‐antagonism between cardiac and haemangioblast regulators. Development 2011;138(15):3235–3245. [DOI] [PMC free article] [PubMed] [Google Scholar]
- 32. Laugwitz K‐L, Moretti A, Lam J et al. Postnatal isl1+ cardioblasts enter fully differentiated cardiomyocyte lineages. Nature 2005;433(7026):647–653. [DOI] [PMC free article] [PubMed] [Google Scholar]
- 33. Cambier L, Plate M, Sucov HM et al. Nkx2‐5 regulates cardiac growth through modulation of Wnt signaling by R‐spondin3. Development 2014;141(15):2959–2971. [DOI] [PMC free article] [PubMed] [Google Scholar]
- 34. Zhu W‐Z, Xie Y, Moyes KW et al. Neuregulin/ErbB signaling regulates cardiac subtype specification in differentiating human embryonic stem cells. Circ Res 2010;107(6):776–786. [DOI] [PMC free article] [PubMed] [Google Scholar]
- 35. Schram G, Pourrier M, Melnyk P et al. Differential distribution of cardiac ion channel expression as a basis for regional specialization in electrical function. Circ Res 2002;90(9):939–950. [DOI] [PubMed] [Google Scholar]
- 36. Shi W, Wymore R, Yu H et al. Distribution and prevalence of hyperpolarization‐activated cation channel (HCN) mRNA expression in cardiac tissues. Circ Res 1999;85(1):e1–e6. [DOI] [PubMed] [Google Scholar]
- 37. Bohn G, Moosmang S, Conrad H et al. Expression of T‐ and L‐type calcium channel mRNA in murine sinoatrial node. FEBS Lett 2000;481(1):73–76. [DOI] [PubMed] [Google Scholar]
- 38. Marionneau C, Couette B, Liu J, et al. Specific pattern of ionic channel gene expression associated with pacemaker activity in the mouse heart. J Physiol 2005;562(Pt 1):223–234. [DOI] [PMC free article] [PubMed] [Google Scholar]
- 39. Habets PEMH, Moorman AFM, Clout DEW et al. Cooperative action of Tbx2 and Nkx2.5 inhibits ANF expression in the atrioventricular canal: Implications for cardiac chamber formation. Genes Dev 2002;16(10):1234–1246. [DOI] [PMC free article] [PubMed] [Google Scholar]
- 40. Christoffels VM, Hoogaars WMH, Tessari A et al. T‐box transcription factor Tbx2 represses differentiation and formation of the cardiac chambers. Dev Dyn 2004;229(4):763–770. [DOI] [PubMed] [Google Scholar]
- 41. Bao ZZ, Bruneau BG, Seidman JG et al. Regulation of chamber‐specific gene expression in the developing heart by Irx4. Science 1999;283(5405):1161–1164. [DOI] [PubMed] [Google Scholar]
- 42. Bruneau BG, Bao ZZ, Fatkin D, et al. Cardiomyopathy in Irx4‐deficient mice is preceded by abnormal ventricular gene expression. Mol Cell Biol 2001;21(5):1730–1736. [DOI] [PMC free article] [PubMed] [Google Scholar]
- 43. Koibuchi N, Chin MT. CHF1/Hey2 plays a pivotal role in left ventricular maturation through suppression of ectopic atrial gene expression. Circ Res 2007;100(6):850–855. [DOI] [PubMed] [Google Scholar]
- 44. Xin M, Small EM, van Rooij E et al. Essential roles of the bHLH transcription factor Hrt2 in repression of atrial gene expression and maintenance of postnatal cardiac function. Proc Natl Acad Sci USA 2007;104(19):7975–7980. [DOI] [PMC free article] [PubMed] [Google Scholar]
- 45. O'Brien TX, Lee KJ, Chien KR. Positional specification of ventricular myosin light chain 2 expression in the primitive murine heart tube. Proc Natl Acad Sci USA 1993;90(11):5157–5161. [DOI] [PMC free article] [PubMed] [Google Scholar]
- 46. Ng SY, Wong CK, Tsang SY. Differential gene expressions in atrial and ventricular myocytes: Insights into the road of applying embryonic stem cell‐derived cardiomyocytes for future therapies. Am J Physiol Cell Physiol 2010;299(6):C1234–C1249. [DOI] [PubMed] [Google Scholar]
- 47. Jansen JA, van Veen TAB, de Bakker JMT et al. Cardiac connexins and impulse propagation. J Mol Cell Cardiol 2010;48(1):76–82. [DOI] [PubMed] [Google Scholar]
- 48. Christoffels VM, Habets PE, Franco D et al. Chamber formation and morphogenesis in the developing mammalian heart. Dev Biol 2000;223(2):266–278. [DOI] [PubMed] [Google Scholar]
- 49. Houweling AC, van Borren MM, Moorman AFM et al. Expression and regulation of the atrial natriuretic factor encoding gene Nppa during development and disease. Cardiovasc Res 2005;67(4):583–593. [DOI] [PubMed] [Google Scholar]
- 50. Mori AD, Zhu Y, Vahora I et al. Tbx5‐dependent rheostatic control of cardiac gene expression and morphogenesis. Dev Biol 2006;297(2):566–586. [DOI] [PubMed] [Google Scholar]
- 51. Gittenberger‐de Groot AC, Mahtab EAF, Hahurij ND et al. Nkx2.5‐negative myocardium of the posterior heart field and its correlation with podoplanin expression in cells from the developing cardiac pacemaking and conduction system. Anat Rec (Hoboken) 2007;290(1):115–122. [DOI] [PubMed] [Google Scholar]
- 52. Stieber J, Herrmann S, Feil S et al. The hyperpolarization‐activated channel HCN4 is required for the generation of pacemaker action potentials in the embryonic heart. Proc Natl Acad Sci USA 2003;100(25):15235–15240. [DOI] [PMC free article] [PubMed] [Google Scholar]
- 53. Tian Q, Oberhofer M, Ruppenthal S et al. Optical action potential screening on adult ventricular myocytes as an alternative QT‐screen. Cell Physiol Biochem 2011;27(3-4):281–290. [DOI] [PubMed] [Google Scholar]
- 54. Müller O, Tian Q, Zantl R et al. A system for optical high resolution screening of electrical excitable cells. Cell Calcium 2010;47(3):224–233. [DOI] [PubMed] [Google Scholar]
- 55. Leyton‐Mange JS, Mills RW, Macri VS et al. Rapid cellular phenotyping of human pluripotent stem cell‐derived cardiomyocytes using a genetically encoded fluorescent voltage sensor. Stem Cell Rep 2014;2(2):163–170. [DOI] [PMC free article] [PubMed] [Google Scholar]
- 56. Lopez‐Izquierdo A, Warren M, Riedel M et al. A near‐infrared fluorescent voltage‐sensitive dye allows for moderate‐throughput analyses of human induced pluripotent stem cell‐derived cardiomyocytes. Am J Physiol Heart Circ Physiol 2014;307:H1370–H1377. [DOI] [PMC free article] [PubMed] [Google Scholar]
- 57. Wobus AM, Rohwedel J, Maltsev V et al. Development of cardiomyocytes expressing cardiac‐specific genes, action potentials, and ionic channels during embryonic stem cell‐derived cardiogenesis. Ann N Y Acad Sci 1995;752:460–469. [DOI] [PubMed] [Google Scholar]
- 58. Moretti A, Bellin M, Welling A et al. Patient‐specific induced pluripotent stem‐cell models for long‐QT syndrome. N Engl J Med 2010;363(15):1397–1409. [DOI] [PubMed] [Google Scholar]
- 59. Bucchi A, Tognati A, Milanesi R et al. Properties of ivabradine‐induced block of HCN1 and HCN4 pacemaker channels. J Physiol 2006;572(Pt 2):335–346. [DOI] [PMC free article] [PubMed] [Google Scholar]
- 60. Wang P, Tang M, Gao L et al. Roles of I(f) and intracellular Ca2+ release in spontaneous activity of ventricular cardiomyocytes during murine embryonic development. J Cell Biochem 2013;114(8):1852–1862. [DOI] [PubMed] [Google Scholar]
- 61. Bucchi A, Baruscotti M, DiFrancesco D. Current‐dependent block of rabbit sino‐atrial node I(f) channels by ivabradine. J Gen Physiol 2002;120(1):1–13. [DOI] [PMC free article] [PubMed] [Google Scholar]
- 62. Semmler J, Lehmann M, Pfannkuche K et al. Functional expression and regulation of hyperpolarization‐activated cyclic nucleotide‐gated channels (HCN) in mouse iPS cell‐derived cardiomyocytes after UTF1‐neo selection. Cell Physiol Biochem 2014;34(4):1199–1215. [DOI] [PubMed] [Google Scholar]
- 63. David R, Stieber J, Fischer E et al. Forward programming of pluripotent stem cells towards distinct cardiovascular cell types. Cardiovasc Res 2009;84(2):263–272. [DOI] [PubMed] [Google Scholar]
- 64. Baruscotti M, Barbuti A, Bucchi A. The cardiac pacemaker current. J Mol Cell Cardiol 2010;48(1):55–64. [DOI] [PubMed] [Google Scholar]
- 65. Liao J, Aggarwal VS, Nowotschin S et al. Identification of downstream genetic pathways of Tbx1 in the second heart field. Dev Biol 2008;316(2):524–537. [DOI] [PMC free article] [PubMed] [Google Scholar]
- 66. Park EJ, Ogden LA, Talbot A et al. Required, tissue‐specific roles for Fgf8 in outflow tract formation and remodeling. Development 2006;133(12):2419–2433. [DOI] [PMC free article] [PubMed] [Google Scholar]
- 67. Hoffmann S, Berger IM, Glaser A et al. Islet1 is a direct transcriptional target of the homeodomain transcription factor Shox2 and rescues the Shox2‐mediated bradycardia. Basic Res Cardiol 2013;108(2):339. [DOI] [PMC free article] [PubMed] [Google Scholar]
- 68. Kang J, Nathan E, Xu S‐M et al. Isl1 is a direct transcriptional target of Forkhead transcription factors in second‐heart‐field‐derived mesoderm. Dev Biol 2009;334(2):513–522. [DOI] [PMC free article] [PubMed] [Google Scholar]
- 69. Kappen C, Salbaum JM. Identification of regulatory elements in the Isl1 gene locus. Int J Dev Biol 2009;53(7):935–946. [DOI] [PMC free article] [PubMed] [Google Scholar]
- 70. Liu Y, Li Y, Li T et al. POU homeodomain protein OCT1 modulates islet 1 expression during cardiac differentiation of P19CL6 cells. Cell Mol Life Sci 2011;68(11):1969–1982. [DOI] [PMC free article] [PubMed] [Google Scholar]
- 71. Cai C‐L, Zhou W, Yang L et al. T‐box genes coordinate regional rates of proliferation and regional specification during cardiogenesis. Development 2005;132(10):2475–2487. [DOI] [PMC free article] [PubMed] [Google Scholar]
- 72. Watanabe Y, Zaffran S, Kuroiwa A et al. Fibroblast growth factor 10 gene regulation in the second heart field by Tbx1, Nkx2‐5, and Islet1 reveals a genetic switch for down‐regulation in the myocardium. Proc Natl Acad Sci USA 2012;109(45):18273–18280. [DOI] [PMC free article] [PubMed] [Google Scholar]
- 73. Brade T, Pane LS, Moretti A et al. Embryonic heart progenitors and cardiogenesis. Cold Spring Harb Perspect Med 2013;3(10):a013847. [DOI] [PMC free article] [PubMed] [Google Scholar]
- 74. Wang R, Liang J, Jiang H, et al. Promoter‐dependent EGFP expression during embryonic stem cell propagation and differentiation. Stem Cells Dev 2008;17(2):279–289. [DOI] [PubMed] [Google Scholar]
- 75. Pandur P, Sirbu IO, Kühl SJ et al. Islet1‐expressing cardiac progenitor cells: A comparison across species. Dev Genes Evol 2013;223(1-2):117–129. [DOI] [PMC free article] [PubMed] [Google Scholar]
- 76. Mann T, Bodmer R, Pandur P. The Drosophila homolog of vertebrate Islet1 is a key component in early cardiogenesis. Development 2009;136(2):317–326. [DOI] [PMC free article] [PubMed] [Google Scholar]
- 77. Kwon C, Qian L, Cheng P et al. A regulatory pathway involving Notch1/beta‐catenin/Isl1 determines cardiac progenitor cell fate. Nat Cell Biol 2009;11(8):951–957. [DOI] [PMC free article] [PubMed] [Google Scholar]
- 78. Bondue A, Tännler S, Chiapparo G et al. Defining the earliest step of cardiovascular progenitor specification during embryonic stem cell differentiation. J Cell Biol 2011;192(5):751–765. [DOI] [PMC free article] [PubMed] [Google Scholar]
- 79. Hescheler J, Fleischmann BK, Lentini S et al. Embryonic stem cells: A model to study structural and functional properties in cardiomyogenesis. Cardiovasc Res 1997;36(2):149–162. [DOI] [PubMed] [Google Scholar]
- 80. Kleger A, Seufferlein T, Malan D et al. Modulation of calcium‐activated potassium channels induces cardiogenesis of pluripotent stem cells and enrichment of pacemaker‐like cells. Circulation 2010;122(18):1823–1836. [DOI] [PubMed] [Google Scholar]
- 81. Pfaff SL, Mendelsohn M, Stewart CL et al. Requirement for LIM homeobox gene Isl1 in motor neuron generation reveals a motor neuron‐dependent step in interneuron differentiation. Cell 1996;84(2):309–320. [DOI] [PubMed] [Google Scholar]
- 82. Shirasaki R, Pfaff SL. Transcriptional codes and the control of neuronal identity. Annu Rev Neurosci 2002;25:251–281. [DOI] [PubMed] [Google Scholar]
- 83. Thaler JP, Lee S‐K, Jurata LW et al. LIM factor Lhx3 contributes to the specification of motor neuron and interneuron identity through cell‐type‐specific protein‐protein interactions. Cell 2002;110(2):237–249. [DOI] [PubMed] [Google Scholar]
- 84. Tsuchida T, Ensini M, Morton SB et al. Topographic organization of embryonic motor neurons defined by expression of LIM homeobox genes. Cell 1994;79(6):957–970. [DOI] [PubMed] [Google Scholar]
- 85. Suga A, Taira M, Nakagawa S. LIM family transcription factors regulate the subtype‐specific morphogenesis of retinal horizontal cells at post‐migratory stages. Dev Biol 2009;330(2):318–328. [DOI] [PubMed] [Google Scholar]
- 86. Mommersteeg MTM, Hoogaars WMH, Prall OWJ et al. Molecular pathway for the localized formation of the sinoatrial node. Circ Res 2007;100(3):354–362. [DOI] [PubMed] [Google Scholar]
- 87. Mommersteeg MTM, Domínguez JN, Wiese C et al. The sinus venosus progenitors separate and diversify from the first and second heart fields early in development. Cardiovasc Res 2010;87(1):92–101. [DOI] [PubMed] [Google Scholar]
- 88. Sun Y, Liang X, Najafi N et al. Islet 1 is expressed in distinct cardiovascular lineages, including pacemaker and coronary vascular cells. Dev Biol 2007;304(1):286–296. [DOI] [PMC free article] [PubMed] [Google Scholar]
- 89. Khattar P, Friedrich FW, Bonne G et al. Distinction between two populations of islet‐1‐positive cells in hearts of different murine strains. Stem Cells Dev 2011;20(6):1043–1052. [DOI] [PMC free article] [PubMed] [Google Scholar]
- 90. Weinberger F, Mehrkens D, Friedrich FW et al. Localization of Islet‐1‐positive cells in the healthy and infarcted adult murine heart. Circ Res 2012;110(10):1303–1310. [DOI] [PMC free article] [PubMed] [Google Scholar]
- 91. Tessadori F, van Weerd JH, Burkhard SB et al. Identification and functional characterization of cardiac pacemaker cells in zebrafish. PLoS ONE 2012;7(10):e47644. [DOI] [PMC free article] [PubMed] [Google Scholar]
- 92. de Pater E, Clijsters L, Marques SR et al. Distinct phases of cardiomyocyte differentiation regulate growth of the zebrafish heart. Development 2009;136(10):1633–1641. [DOI] [PMC free article] [PubMed] [Google Scholar]
- 93. Wiese C, Nikolova T, Zahanich I et al. Differentiation induction of mouse embryonic stem cells into sinus node‐like cells by suramin. Int J Cardiol 2011;147(1):95–111. [DOI] [PMC free article] [PubMed] [Google Scholar]
- 94. Hoogaars WMH, Tessari A, Moorman AFM et al. The transcriptional repressor Tbx3 delineates the developing central conduction system of the heart. Cardiovasc Res 2004;62(3):489–499. [DOI] [PubMed] [Google Scholar]
- 95. Hoogaars WMH, Engel A, Brons JF et al. Tbx3 controls the sinoatrial node gene program and imposes pacemaker function on the atria. Genes Dev 2007;21(9):1098–1112. [DOI] [PMC free article] [PubMed] [Google Scholar]
- 96. Harrelson Z, Kelly RG, Goldin SN et al. Tbx2 is essential for patterning the atrioventricular canal and for morphogenesis of the outflow tract during heart development. Development 2004;131(20):5041–5052. [DOI] [PubMed] [Google Scholar]
- 97. Bakker ML, Boink GJJ, Boukens BJ et al. T‐box transcription factor TBX3 reprogrammes mature cardiac myocytes into pacemaker‐like cells. Cardiovasc Res 2012;94(3):439–449. [DOI] [PubMed] [Google Scholar]
Associated Data
This section collects any data citations, data availability statements, or supplementary materials included in this article.
Supplementary Materials
Supplementary Figure 1
Supplementary Figure 2
Supplementary Figure 2
Supplementary Figure 4
Supplementary Figure 5
Supplementary Figure 6
Supplementary Figure 7
Supplementary Figure 8
Supplementary Figure 9
Supplementary Figure 10
Supplementary Figure 11
Supplementary Figure 12
Supplementary Materials and Methods
Supplementary Table 1