Abstract
In the present work, in vivo transporter knockout (KO) mouse models were used to characterize the disposition of diclofenac (DCF) and its primary metabolites following a single subtoxic dose in mice lacking breast cancer resistance protein (Bcrp) or multidrug resistance-associated protein (Mrp)3. The results indicate that Bcrp acts as a canalicular efflux mediator for DCF, as wild-type (WT) mice had biliary excretion values that were 2.2- to 2.6-fold greater than Bcrp KO mice, although DCF plasma levels were not affected. The loss of Bcrp resulted in a 1.8- to 3.2-fold increase of diclofenac acyl glucuronide (DCF-AG) plasma concentrations in KO animals compared with WT mice, while the biliary excretion of DCF-AG increased 1.4-fold in WT versus KO mice. Furthermore, Mrp3 was found to mediate the basolateral transport of DCF-AG, but not DCF or 4ʹ-hydroxy diclofenac. WT mice had DCF-AG plasma concentrations 7.0- to 8.6-fold higher than Mrp3 KO animals; however, there were no changes in biliary excretion of DCF-AG. Vesicular transport experiments with human MRP3 demonstrated that MRP3 is able to transport DCF-AG via low- and high-affinity binding sites. The low-affinity MRP3 transport had a Vmax and Km of 170 pmol/min/mg and 98.2 µM, respectively, while the high-affinity Vmax and Km parameters were estimated to be 71.9 pmol/min/mg and 1.78 µM, respectively. In summary, we offer evidence that the disposition of DCF-AG can be affected by both Bcrp and Mrp3, and these findings may be applicable to humans.
Introduction
The nonsteroidal anti-inflammatory drug diclofenac (DCF) is used to treat arthritis and pain management. Its primary mechanism of action is to inhibit the metabolism of arachidonic acid by cyclooxygenase (COX) enzymes, COX-1 and COX-2, into proinflammatory mediators (Menassé et al., 1978). The pharmacokinetics of DCF have been extensively characterized in human and animal models. It has been shown that rodents, nonhuman primates, and humans generate hydroxylated metabolites, whereas glucuronide conjugates are the primary metabolites observed in the bile of dogs and rats (Stierlin and Faigle, 1979; Stierlin et al., 1979). In humans receiving DCF as either an intravenous or oral dose, 65% of the dose is excreted in the urine, and the remaining 35% is eliminated in feces (Riess et al., 1978).
The metabolic profile of DCF has likewise been carefully profiled, and only a small portion of DCF is eliminated as unchanged parent compound (Stierlin and Faigle, 1979; Stierlin et al., 1979). DCF is metabolized in vivo into a variety of hydroxylated and conjugated metabolites (Bort et al., 1999; Tang et al., 1999; King et al., 2001; Kenny et al., 2004). A multitude of major and minor metabolites have also been detected, and most of their structures have been elucidated (Pickup et al., 2012; Sarda et al., 2012). Nearly 100% of DCF is absorbed after an oral dose due, in part, to the high passive uptake of DCF, categorizing it as an extended clearance classification system class 1A compound (Varma et al., 2015). The extensive absorption leads to a large fraction of the dose entering the portal circulation, resulting in significant hepatic first-pass metabolism involving phase I and phase II enzymes. There is a need to better understand the role that transporters possibly play in DCF clearance.
The liver contains numerous uptake and efflux transporters that are exclusively localized to either the basolateral membrane or the (apical) canalicular domain (Giacomini et al., 2010). Uptake and efflux transporters are expressed on the basolateral membrane and modulate the transport of endogenous as well as xenobiotic compounds from blood into the liver and vice versa. Other efflux transporters are expressed on the canalicular domains of hepatocytes and serve to excrete substrates into the bile canaliculi, whereupon biliary flow carries the substrates into the common bile duct, which drains into the duodenal region of the small intestine. Sinusoidal transporter–mediated efflux results in substrates entering the blood, often leading to excretion into the urine. The interplay of these transporters can result in extensive elimination and reuptake of substances, prolonging their residence time in the body (Roberts et al., 2002).
The efflux transporters have broad substrate affinity. The multidrug resistance-associated proteins [MRPs; encoded by ABCCx (ATP-binding cassette transporter family C) genes] transport endogenous substances such as organic anions, bile salts, glutathione, and steroids, as well as xenobiotics and their conjugated metabolites. For example, MRP3 (encoded by ABCC3) was observed to transport acetaminophen glucuronide, estradiol-17-β-glucuronide, leukotriene C4, and morphine-3-glucuronide (Hirohashi et al., 1999; Manautou et al., 2005; Zelcer et al., 2005). Breast cancer resistance protein (BCRP; encoded by ABCG2) transports substrates such as estrone-3-sulfate, methotrexate, and SN-38, which is the pharmacologically active metabolite of irinotecan (Kawabata et al., 2001; Vlaming et al., 2009). MRP2 overlaps with the aforementioned transporters and can mediate the excretion of pravastatin, carboxydichlorofluorescein, as well as 4-methylumbelliferone conjugated metabolites (Zamek-Gliszczynski et al., 2006a; Elsby et al., 2011).
Experiments with rats that contain a mutated Mrp2 provided evidence that this transporter had a role in the elimination of diclofenac acyl glucuronide (DCF-AG) from the liver into bile (Seitz et al., 1998). This finding was particularly impactful as it was one of the first reports to ascribe the importance of transporters in mediating toxicity from DCF exposure. In that study, rats lacking Mrp2 had significantly lower intestinal injury after DCF dosing compared with rats with functional Mrp2. Thus, exploration of other efflux transporters that may efflux DCF or its metabolites is warranted to enhance understanding of how DCF clearance by transporters can modulate its kinetics and toxicity.
The purpose of the current work was to identify other efflux transporters that are responsible for mediating the disposition of either DCF or its primary metabolites. To accomplish this goal, mouse transporter knockout models in which either Bcrp or Mrp3 was genetically deleted were used. The selection of Bcrp and Mrp3 would allow insight into how a major canalicular (in addition to Mrp2) or a basolateral transporter, respectively, can potentially impact the dispositional profile of DCF or its conjugated metabolites. Furthermore, the affinity of DCF and its metabolites for human MRP3 was also investigated via in vitro assays with commercial vesicles.
Materials and Methods
Chemicals and Reagents.
Alamethicin, AMP, ATP, DCF, formic acid, indomethacin (used as the internal standard), KCl, MgCl2, 3-(N-morpholino)propanesulfonic acid (MOPS), NADPH, 4′-hydroxy diclofenac (OH-DCF), Tris-HCl, and uridine 5ʹ-diphosphoglucuronic acid (UDPGA) were purchased from Sigma-Aldrich Corporation (St. Louis, MO). DCF-AG was purchased from Toronto Research Chemicals Incorporated (Toronto, Canada). Solutol HS 15 was provided by the BASF Corporation (Florham Park, NJ). MRP2 and MRP3 vesicles were purchased from GenoMembrane Corporation (Kanazawa, Japan). All liquid chromatography–tandem mass spectrometry (LC-MS/MS) solvents were of high analytical grade and were purchased from Burdick & Jackson (Muskegon, MI).
Animals.
Wild-type FVB mice were purchased from Charles River (Wilmington, MA). Mrp3-null mice of FVB 129/Ola background were provided by Dr. Piet Borst (Netherlands Cancer Institute, Amsterdam, Netherlands). Wild-type C57BL/6 mice and Bcrp-null mice having a C57BL/6 background were obtained from Taconic (Rensselaer, NY). Mice were housed in an American Animal Associations Laboratory Animal Care–accredited facility of the University of Kansas Medical Center under a standard temperature-, light-, and humidity-controlled environment. Mice had free access to Laboratory Rodent Chow 8604 (Harlan, Madison, WI) and drinking water. All animal studies were performed in accordance with the Guide for the Care and Use of Laboratory Animals using protocols reviewed and approved by the local Institutional Animal Care and Use Committee of the University of Kansas Medical Center (Kansas City, KS).
In Vivo Studies.
Male 2- to 4-month-old FVB 129/Ola wild-type (WT), FVB 129/Ola Mrp3 knockout (KO), C57BL/6 WT, and C57BL/6 Bcrp KO mice were anesthetized as detailed earlier (Scialis et al., 2015). The mice received a single intra-arterial dose of 3 or 10 mg/kg DCF in 10:90 (v/v) Solutol HS 15:0.9% saline at a dosing volume of 10 ml/kg. Bile was collected in 15-minute intervals from −15 to 0, 0–15, 15–30, 30–45, 45–60, 60–75, and 75–90 minutes post administration. Blood samples were collected into heparinized tubes at 2, 7.5, 22.5, 37.5, 52.5, 67.5, and 90 minutes after administration. At the conclusion of the study (90 minutes post administration), mice were euthanized, and livers were harvested. Samples were subsequently processed and stored as previously described (Scialis et al., 2015).
Bioanalytical Analysis.
Bile and plasma were prepared as previously reported (Scialis et al., 2015). Samples and standards were vigorously vortex mixed and centrifuged at 1000g for 15 minutes and 5°C. An aliquot of supernatant (200 µl) was removed, evaporated, and reconstituted with mobile phase prior to injecting 10 µl onto the LC-MS/MS system.
In Vitro Metabolism.
Untreated livers from three male FVB (WT and KO) and C57 (WT and KO) mice were homogenized using a Dounce Teflon homogenizer in ice-cold Tris-HCL buffer (50 mM Tris, 15.4 mM KCl, 2 mM EDTA) in a ratio of 4 parts buffer to 1 part liver. The homogenate was centrifuged at 9000g for 30 minutes and 4°C, and the S9 supernatant fraction was removed, separated into aliquots, and kept frozen at −80°C. The S9 fraction was analyzed for protein content using a Pierce BCA kit (Thermo Fisher Scientific Inc., Grand Island, NY) following the manufacturer’s recommendations. Incubation reactions were conducted in duplicate in the presence of increasing DCF concentrations. The reaction mixture consisted of DCF, 0.1 M phosphate buffer (pH 7.4) at 37°C, 1 mg/ml S9 protein, 10 µg/ml alamethicin, 1 mM glutathione (GSH), 5 mM MgCl2, 1 mM NADPH, and 1 mM UDPGA. Incubations without cofactors (NADPH, MgCl2, UDPGA) served as the control. The total incubation volume was 300 µl, and the reaction mixture was open to air. Aliquots of 50 µl were taken at 0, 7.5, 15, 30, and 45 minutes; immediately quenched with 200 µl of ice-cold solvent B; and kept on ice. At the end of the experiment, samples were mixed with 50 µl of internal standard, and 200 µl of the mixture was removed to be evaporated to dryness under N2 at 40°C. The resulting residue was reconstituted in 200 µl of 90:10 (v/v) solvents A:B, vigorously vortex mixed, and injected onto the LC-MS/MS. The samples were monitored for the disappearance of DCF. The LC-MS/MS response (DCF peak area/internal standard peak area) was converted to percentage remaining, with 0 minutes serving as 100%. All percentage values were log transformed and plotted against incubation time to yield an elimination rate (k) that was derived from the slope of the resulting line. The elimination rate was converted into an apparent half-life using the following formula:
 |
(1) |
The initial enzyme velocity was calculated using the following equation:
 |
(2) |
where v0 is expressed as picomoles per minute per milligram, and [S] is the DCF substrate concentration (micromolar). The kinetic parameters Km and Vmax were then calculated by plotting v0 as a function of [S].
In Vitro Transport.
Commercially available MRP2 and MRP3 inside-out vesicles were quickly thawed from storage and placed on ice. Incubation reactions consisted of uptake buffer at pH 7.0 (50 mM MOPS-Tris, 70 mM KCl, and 7.5 mM MgCl2), 25 µg of vesicle protein, 5 mM AMP or ATP, and 2.5 mM GSH. After a 5-minute preincubation period of reaction mixture, incubations were commenced by addition of various concentrations of DCF-AG. Incubations were conducted at 37°C in a total volume of 75 µl. Reactions were quenched by the addition of 100 µl of ice-cold stopping buffer (40 mM MOPS-Tris and 70 mM KCl), and the quenched mixtures were quickly transferred to a 96-well glass-fiber filter plate (EMD Millipore, Billerica, MA). The filter plate was subjected to vacuum filtration followed by five rapid washes of 100 µl/well ice-cold stopping buffer. The filter plate was allowed to completely dry before extraction of samples. DCF-AG was extracted by filling each well of the filter plate with 200 µl of 80:20 (v/v) methanol:0.1% formic acid in water. Plates were shaken for 15 minutes on ice, and the filtrate was collected via centrifugation at 3000g for 10 minutes and 4°C. The filtrate was evaporated to dryness under warm N2 at 40°C. The resulting residue was reconstituted with 200 µl of 90:10 (v/v) solvents A:B, vigorously vortex mixed, and injected onto the LC-MS/MS. The accumulation of DCF-AG was quantified against a standard curve, and the uptake data were expressed as pmol normalized to mg vesicle protein.
LC-MS/MS Method.
Chromatographic separation of analytes was performed using methodology detailed in our earlier work (Scialis et al., 2015). Concentrations of analytes in the samples were determined by comparing the peak area ratios to those in the standard curve using a linear regression model. The criterion of acceptance for standards was defined as ±20% of the nominal concentration.
Statistical Analysis.
Data are expressed as the mean ± S.E.M. P values ≤0.05 were considered as statistically significant. Statistical analysis of data was performed using R version 3.2.1 (R Core Team, 2015). Two groups were compared by Student’s t test, and multiple groups were compared by an analysis of variance followed by Tukey’s post hoc test. GraphPad Prism version 6.0 (GraphPad Software Incorporated, La Jolla, CA) was used to calculate kinetic parameters (Vmax and Km).
Results
In Vivo Studies.
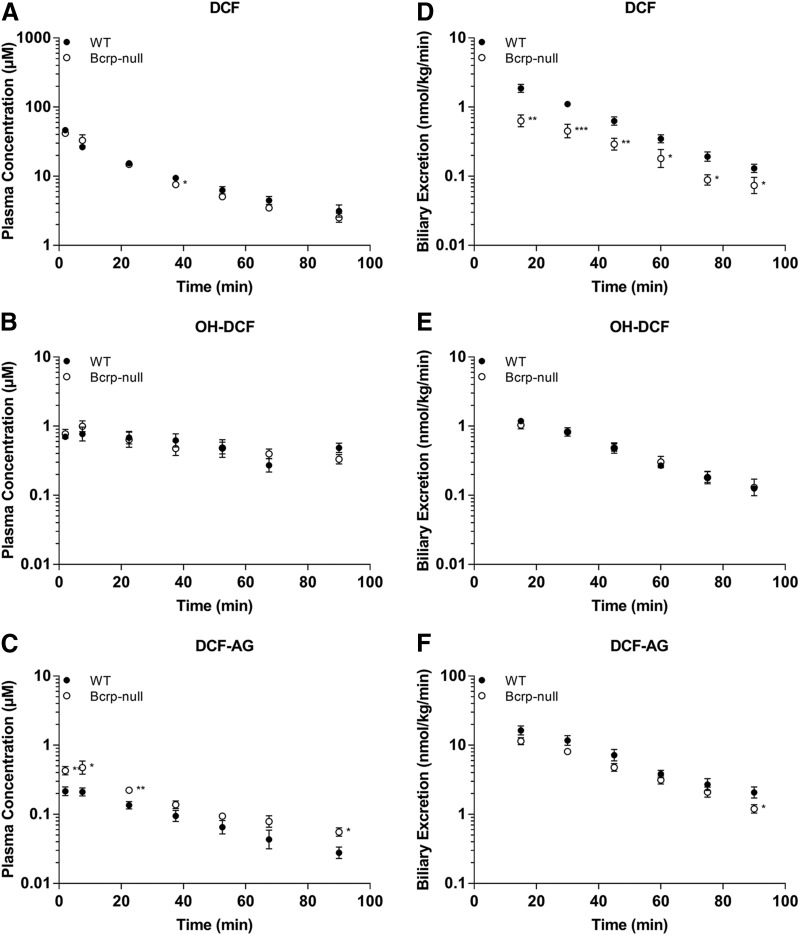
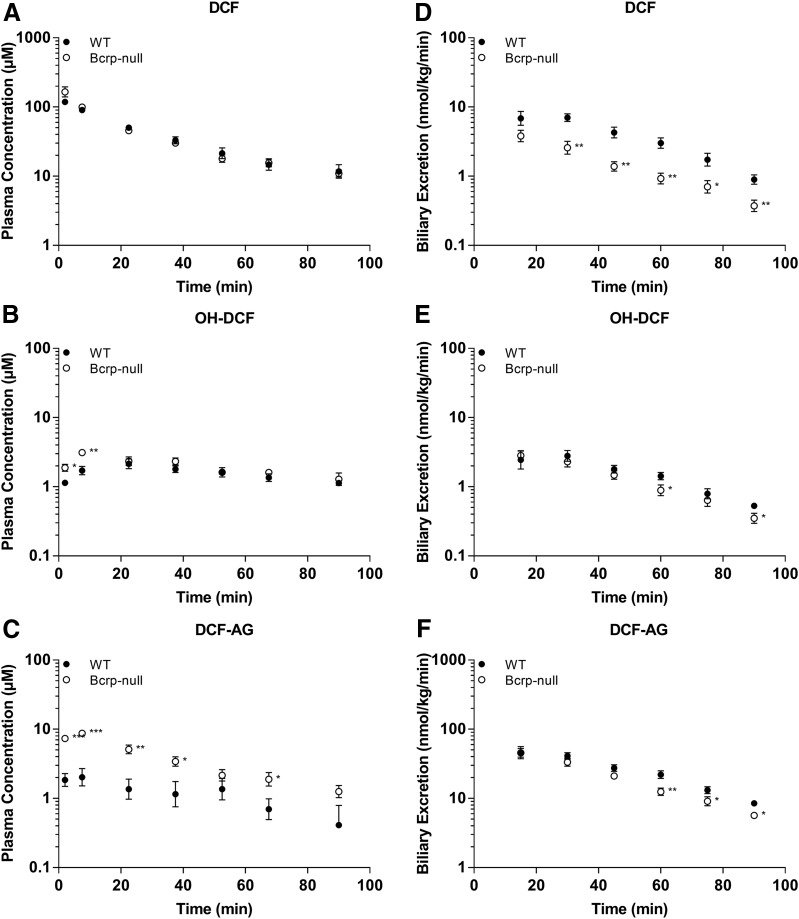
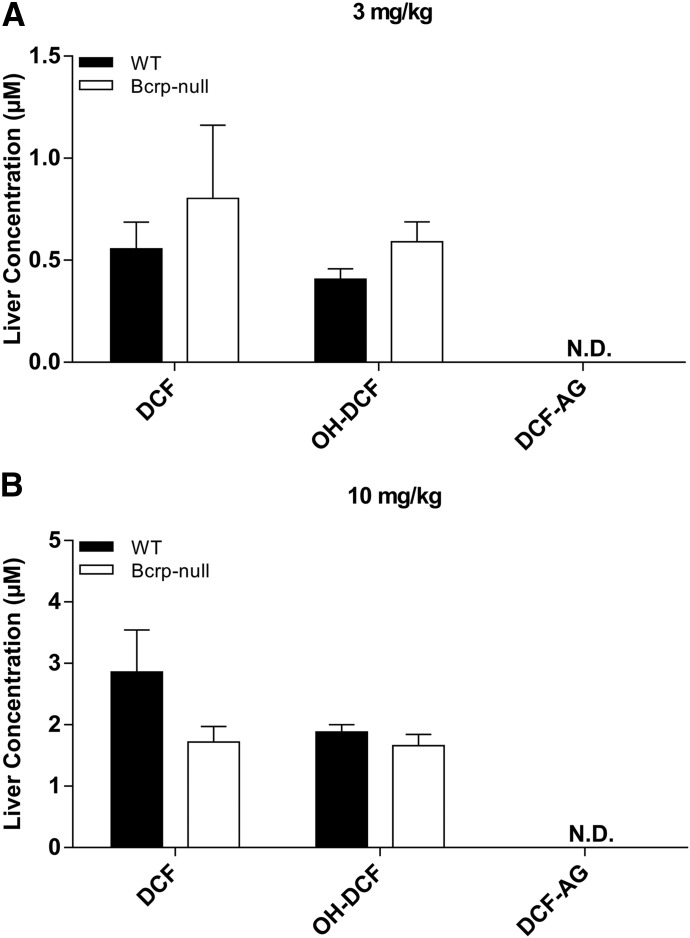
Plasma concentrations of DCF and OH-DCF in C57 WT and C57 Bcrp KO mice receiving 3 mg/kg DCF were nearly equal (Fig. 1, A and B), whereas KO animals had, on average, 1.8-fold higher DCF-AG plasma levels compared with WT (Fig. 1C). Biliary excretion of DCF was 2.2-fold higher in WT animals relative to KO (Fig. 1D). OH-DCF biliary levels were relatively unchanged between WT and KO mice (Fig. 1E), although the biliary excretion of DCF-AG in WT was 1.4-fold greater than in KO mice at 90 minutes after DCF administration (Fig. 1F). The trends observed at the 3-mg/kg dose were also evident following administration of 10 mg/kg DCF. DCF and OH-DCF plasma concentrations were approximately equal in WT and Bcrp KO mice (Fig. 2, A and B), whereas the DCF-AG KO plasma concentrations were increased 3.2-fold compared with WT mice (Fig. 2C). Biliary excretion of DCF was, on average, 60% lower in KO mice compared with WT mice (Fig. 2D). The biliary excretion of OH-DCF and DCF-AG was decreased in KO mice relative to WT mice (Fig. 2, E and F). Analysis of whole liver collected 90 minutes after 3 or 10 mg/kg DCF showed no significant differences between the concentrations of DCF or OH-DCF, whereas DCF-AG was not detected in the samples (Fig. 3, A–C).
Fig. 1.
Plasma concentrations and biliary excretion rates of DCF, OH-DCF, and DCF-AG in C57 WT and C57 Bcrp KO mice after 3-mg/kg-DCF dose. Pharmacokinetics of DCF and its metabolites in Bcrp KO (○) and WT (●) mice after a single intra-arterial dose of 3 mg/kg DCF. (A–C) Plasma concentration profiles for DCF (A), OH-DCF (B), and DCF-AG (C) at discrete time points. (D–F) Biliary excretion profiles for DCF (D), OH-DCF (E), and DCF-AG (F). Biliary flow was captured in 15-minute intervals. All data are expressed as the mean ± S.E.M. for five to six subjects/group. *P < 0.05; **P < 0.01; ***P < 0.001 vs. WT.
Fig. 2.
Plasma concentrations and biliary excretion rates of DCF, OH-DCF, and DCF-AG in C57 WT and C57 Bcrp KO mice after 10-mg/kg-DCF dose. Pharmacokinetics of DCF and its metabolites in WT (○) and Bcrp KO (●) mice after a single intra-arterial dose of 10 mg/kg DCF. (A–C) Plasma concentration profiles for DCF (A), OH-DCF (B), and DCF-AG (C) at discrete time points. (D–F) Biliary excretion profiles for DCF (D), OH-DCF (E), and DCF-AG (F).
Fig. 3.
Terminal liver concentrations of DCF, OH-DCF, and DCF-AG in C57 WT and C57 Bcrp KO mice after 3- (A) or 10-mg/kg-DCF dose (B). Hepatic concentrations of DCF, OH-DCF, and DCF-AG in KO (□) and WT (■) mice were determined 90 minutes after DCF administration. Data are expressed as the mean ± S.E.M. for five to six subjects/group. N.D., XXX.
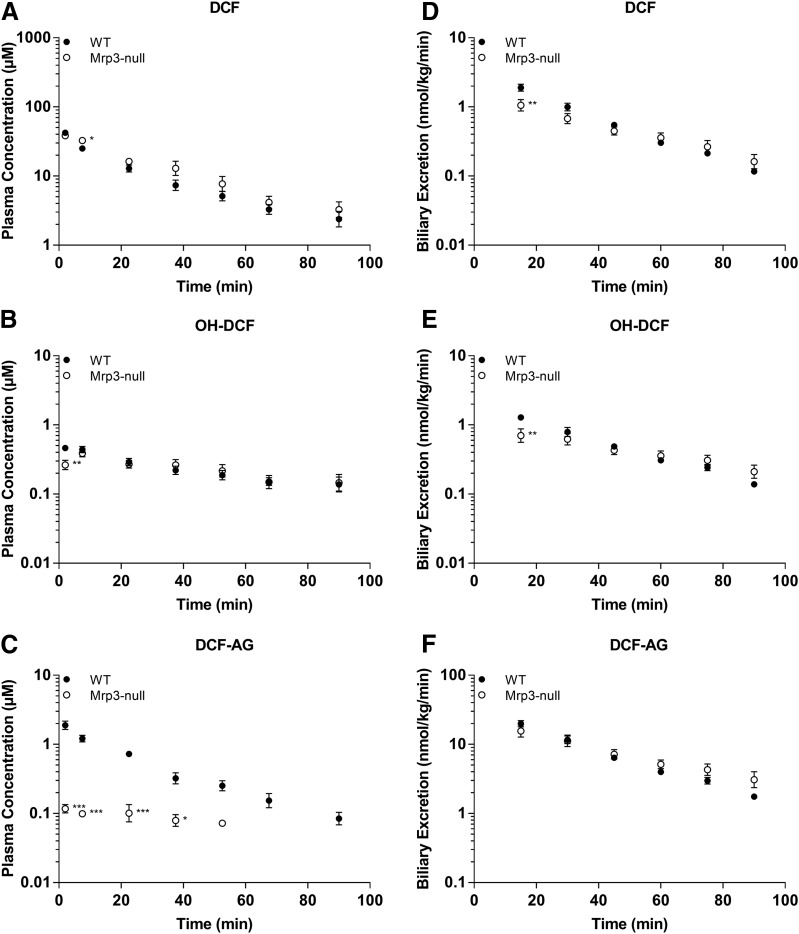
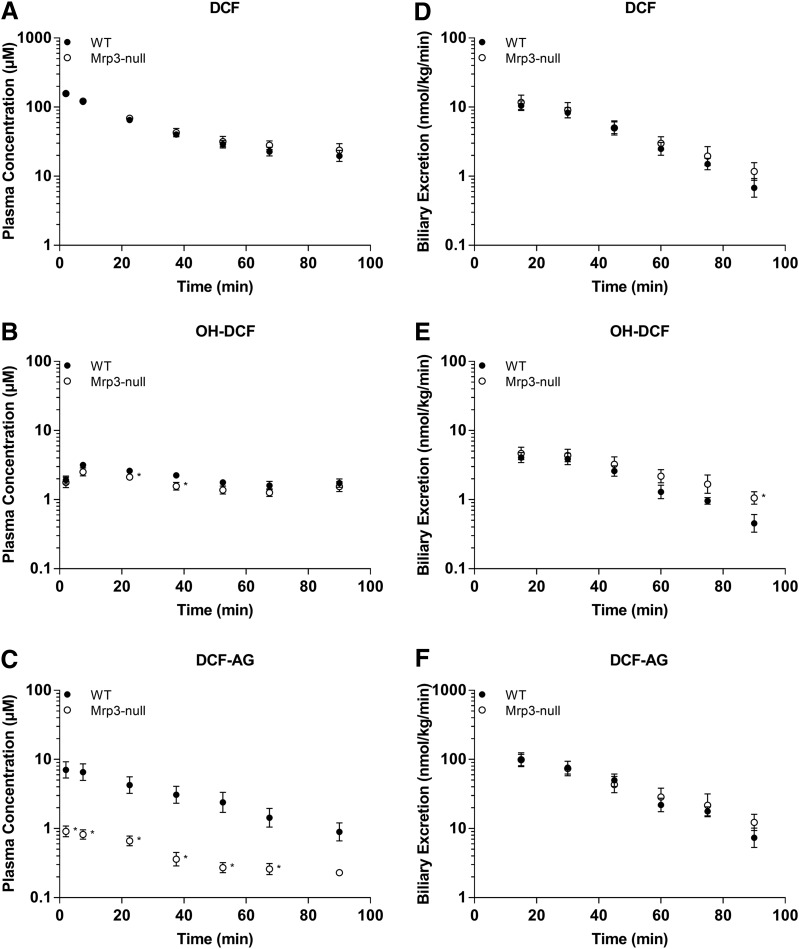
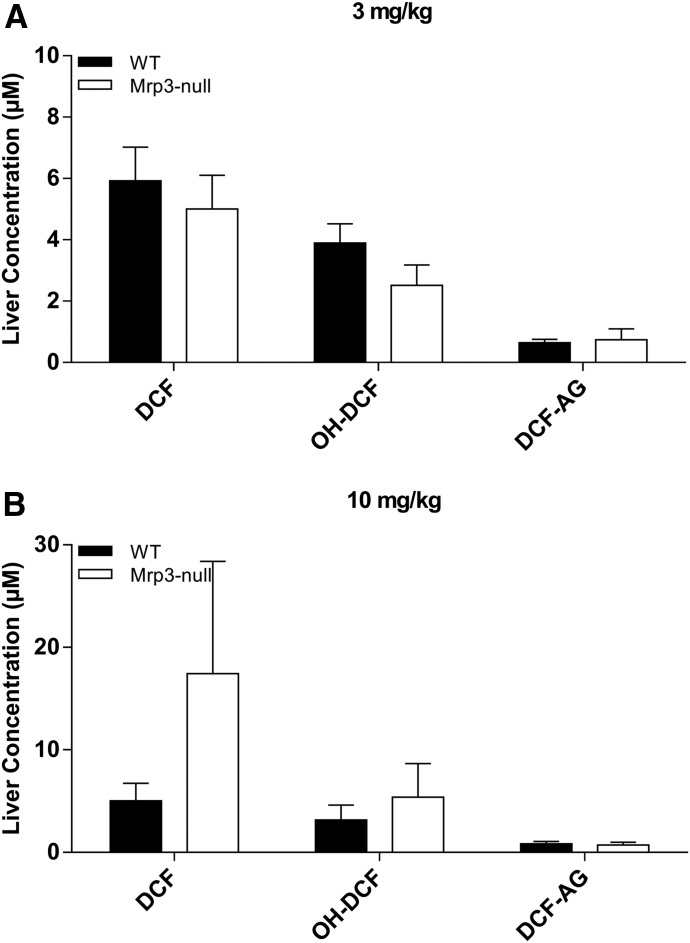
The plasma concentrations of DCF and its metabolites in FVB WT and FVB Mrp3 KO animals are shown in Figs. 4 and 5. With the 3-mg/kg dose of DCF, only minor differences in plasma concentrations of DCF and OH-DCF were observed (Fig. 4, A and B). Strikingly, there was an 84% decrease in the plasma concentrations of DCF-AG in Mrp3-null mice compared with WT mice (Fig. 4C). With regards to biliary excretion, all three analytes had similar concentrations between Mrp3-null and WT mice (Fig. 4, D–F). The 10-mg/kg data for the FVB mice produced similar plasma profiles of DCF and OH-DCF in Mrp3-null and WT mice (Fig. 5, A and B). DCF-AG plasma concentrations in KO mice were 85% lower than the concentrations observed in WT mice (Fig. 5C). Biliary excretion of DCF, OH-DCF, and DCF-AG was similar between WT and Mrp3-null mice after a 10-mg/kg dose (Fig. 5, D–F), although OH-DCF began to show a slight increase in KO biliary output relative to WT. Liver concentrations were determined 90 minutes post administration and were found to be similar between the genotypes, and this was true for the 3- and 10-mg/kg doses (Fig. 6).
Fig. 4.
Plasma concentrations and biliary excretion rates of DCF, OH-DCF, and DCF-AG in FVB WT and FVB Mrp3 KO mice after 3-mg/kg-DCF dose. Pharmacokinetics of DCF and its metabolites in KO (○) and Mrp3 WT (●) mice after a single intra-arterial dose of 3 mg/kg DCF. (A–C) Plasma concentration profiles for DCF (A), OH-DCF (B), and DCF-AG (C) at discrete time points. (D–F) Biliary excretion profiles for DCF (D), OH-DCF (E), and DCF-AG (F). Each value represents the mean ± S.E.M. of six to seven subjects/group.
Fig. 5.
Plasma concentrations and biliary excretion rates of DCF, OH-DCF, and DCF-AG in FVB WT and FVB Mrp3 KO mice after 10-mg/kg-DCF dose. Pharmacokinetics of DCF and its metabolites in WT (○) and Mrp3 KO (●) mice after a single intra-arterial dose of 10 mg/kg DCF. (A–C) Plasma concentration profiles for DCF (A), OH-DCF (B), and DCF-AG (C) at discrete time points. (D–F) Biliary excretion profiles for DCF (D), OH-DCF (E), and DCF-AG (F).
Fig. 6.
Terminal liver concentrations of DCF, OH-DCF, and DCF-AG in FVB WT and FVB Mrp3 KO mice after 3- (A) or 10-mg/kg-DCF dose (B). Hepatic concentrations of DCF, OH-DCF, and DCF-AG in KO (□) and WT (■) mice were determined 90 minutes after DCF administration. Data are expressed as the mean ± S.E.M. for six to seven subjects/group.
The pharmacokinetics of DCF at each dose for all genotypes is summarized in Table 1. Considering the short duration (90 minutes) of the studies, only C0, AUC0-tlast, and t1/2 were calculated because other pharmacokinetic parameters, such as clearance and volume of distribution, would require a longer time course for an accurate estimation. The data show that the relative half-lives of DCF at each dose for each genotype were comparable, with the exception of the 10-mg/kg Mrp3 KO mice that had a t1/2 of 52.9 ± 9.8 minutes, which was slightly elevated compared with the rest of the dosing groups. The overall exposure of DCF, as assessed by AUC0-tlast normalized by dose, further demonstrated that the absorption and distribution of DCF were fairly alike.
TABLE 1.
Summary of DCF pharmacokinetic parameters in plasma of WT and KO mice after a single 3- or 10-mg/kg-DCF dose
Parameters of C0, t1/2, and AUC0-tlast were calculated using noncompartmental analysis. Each value represents the mean ± S.E.M. of five to seven subjects/group.
| Genotype | C0 | t1/2 | AUC0-tlast |
|---|---|---|---|
| µM | min | µM × min | |
| 3 mg/kg | |||
| C57 WT | 57.8 ± 6.0 | 31.2 ± 4.0 | 1050 ± 50 |
| C57 BCRP KO | 46.0 ± 5.1 | 27.8 ± 3.6 | 1020 ± 80 |
| 10 mg/kg | |||
| C57 WT | 132 ± 8 | 30.5 ± 3.1 | 3420 ± 290 |
| C57 BCRP KO | 201 ± 44 | 33.5 ± 2.5 | 3570 ± 340 |
| 3 mg/kg | |||
| FVB WT | 51.4 ± 5.1 | 24.0 ± 4.1 | 862 ± 86 |
| FVB Mrp3 KO | 41.2 ± 3.3 | 37.5 ± 9.2 | 1110 ± 130 |
| 10 mg/kg | |||
| FVB WT | 178 ± 16 | 37.8 ± 5.6 | 4220 ± 420 |
| FVB Mrp3 KO | 172 ± 13 | 52.9 ± 9.8 | 4770 ± 280 |
AUC0-tlast, from time 0 to the last measurable concentration.
Metabolite Identification.
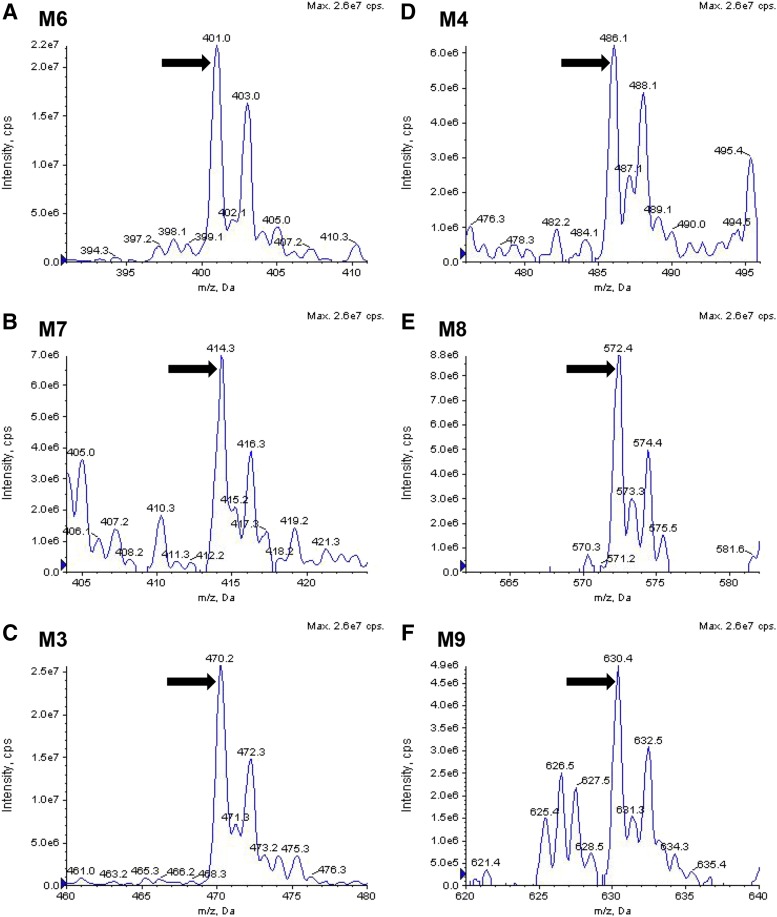
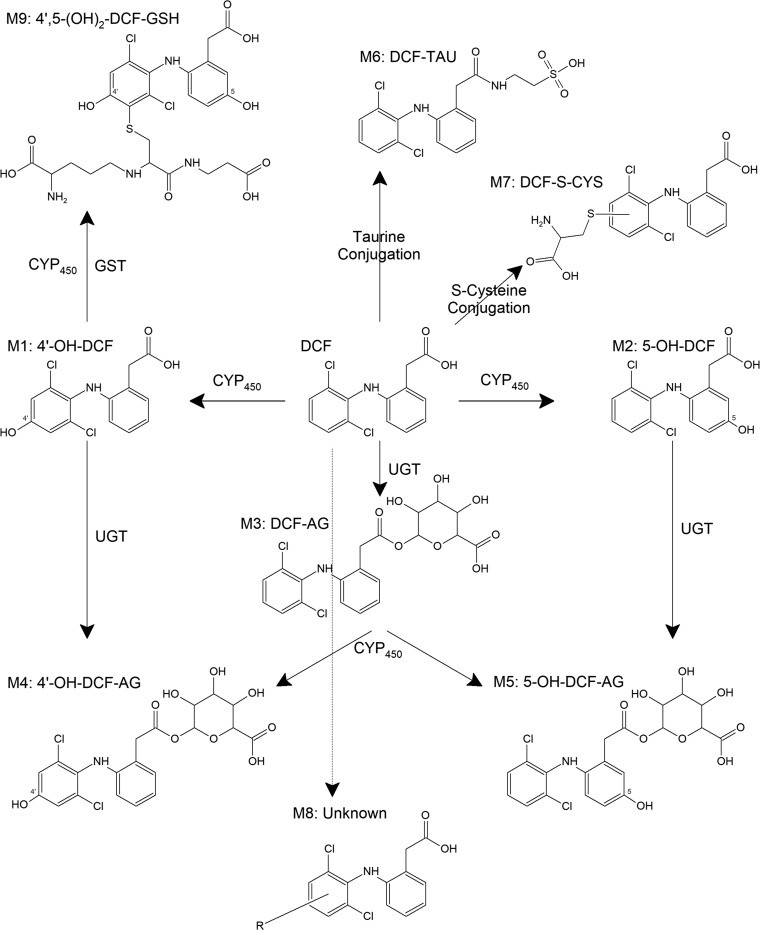
To account for metabolism of DCF that extended beyond generation of OH-DCF and DCF-AG, bile from WT and Mrp3 KO mice was pooled from a number of animals, extracted with organic solvent, and infused onto the LC-MS/MS. Spectra from 100 to 1000 atomic mass units were acquired in both the positive ion and negative ion mode and compared between genotypes. The WT spectra were subtracted from KO spectra, and the resulting signals were analyzed for traces of DCF metabolites. As shown in Fig. 7, several metabolites possessing an isotopic distribution similar to DCF were identified (for reference, DCF-AG is shown in Fig. 7C). The masses of the primary peaks were compared using MetabolitePilot software (Framingham, MA). Structures of the proposed biliary metabolites are shown in Fig. 8. M1 and M2 are the hydroxylated metabolites, whereas M3 is DCF-AG. M4 is positively identified, based on product ion fragmentation, as hydroxy diclofenac acyl glucuronide (Fig. 7D); however, no distinction as to whether it was a 5- or 4ʹ-OH was made. M6, a taurine conjugate, corresponds to the peak shown in Fig. 7A. M3 exactly matches the profile of the DCF-AG synthetic standard, whereas M4 and M6 have the same m/z as reported for hydroxy diclofenac acyl glucuronide and DCF-Taurine, respectively, in the literature (Sarda et al., 2012). M7, a possible S-cysteine conjugate, matches the profile observed in Fig. 7B. M9, a dihydroxylated glutathione adduct, is putatively identified as the peak shown in Fig. 7F. M9’s structure is hypothesized based on the finding by Waldon et al. (2010) of a singly hydroxylated diclofenac glutathione adduct that was reported to have an m/z of 615. The structure of M8, the profile of which is indicated by Fig. 7E, is uncertain because its mass does not match up to typical combinations.
Fig. 7.
Mass spectral identification of major DCF conjugated metabolites excreted in bile. Bile from WT and Mrp3 KO mice were pooled, extracted with organic solvent, and infused onto a mass spectrometer. The infusion was then scanned across a range of masses for which multiple acquisitions were made to determine masses of putative metabolites. The WT spectral profile was subtracted from the KO profile, resulting in a range of masses (i.e., metabolites) that can be considered to be in excess in KO compared with WT. DCF taurine conjugate (A), DCF cysteine conjugate (B), DCF-AG (C), either 4ʹ- or 5-hydroxy diclofenac acyl glucuronide (D), unknown DCF conjugate (E), and di-hydroxy-DCF glutathione (F). cps, counts per second; MCA, XXX.
Fig. 8.
Structures of DCF metabolites based on biliary MS/MS infusion data. M1 and M2 are hydroxylated metabolites (OH-DCF) that have the same parental mass as M4 and M5 [hydroxy diclofenac acyl glucuronide (OH-DCF-AG)], which can be generated from M1, M2, or M3 (DCF-AG). DCF can also be conjugated to M6 (taurine conjugate), M7 (cysteine conjugate), and M9 (di-hydroxy glutathione conjugate), which were identified in spectral scans. The structure of M8 has not been elucidated; however, it appears to have a negative ion mode mass (m/z) of 572. CYP, cytochrome P450; CYS, cysteine; GST, glutathione S-transferase; TAU, taurine; UGT, uridine 5'-diphospho-glucuronosyltransferase.
In Vitro Metabolism.
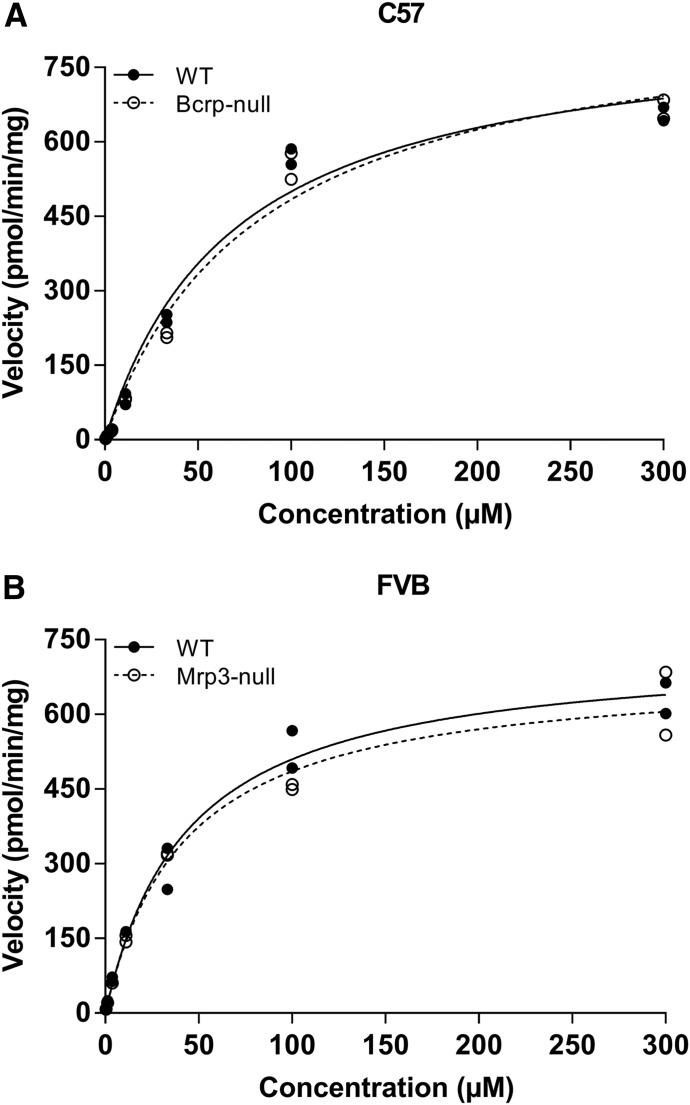
To determine whether the two strains of mice have similar metabolic capacity, S9 fraction was generated by pooling naïve liver homogenates from several WT or KO mice. S9 was chosen for metabolic studies to afford a system capable of multiple biotransformation pathways (Wu and McKown, 2004). The range of DCF was selected to cover the plasma concentrations that were observed in the in vivo studies. Conditions for the assay were based on the work by Fisher et al. (2000) to promote phase II metabolism. Incubations conducted in the presence of cofactors (e.g., GSH and UDPGA) required for phase II metabolism showed that the background-matched strains (e.g., C57 WT and C57 Bcrp KO) had indistinguishable profiles (Fig. 9). The metabolic data were analyzed to determine relevant kinetic parameters, and these values are summarized in Table 2. C57 WT and Bcrp KO mice had apparent Vmax values of 846 ± 31 and 882 ± 26 pmol/min/mg, respectively, whereas the Km values were 69.3 ± 4.3 and 82.4 ± 1.1 µM, respectively. Likewise, the Vmax data for FVB WT and Mrp3 KO mice were 734 ± 32 and 696 ± 79 pmol/min/mg, respectively, and the Km parameters were determined to be 44.3 ± 3.5 and 43.3 ± 9.0 µM, respectively. From the Vmax and Km data, the intrinsic metabolic clearances were calculated with the following equation:
 |
(3) |
The resulting intrinsic uptake clearance values for C57 WT and Bcrp KO were 12.2 and 10.7 µl/min/kg, respectively, whereas those for FVB WT and Mrp3 KO were 16.7 and 16.4 µl/min/mg, respectively.
Fig. 9.
In vitro metabolism of DCF using hepatic S9 fraction from C57 and FVB mice. Pooled S9 fraction was prepared from C57 WT and C57 Bcrp KO (A) and FVB WT and FVB Mrp3 KO mice (B). Incubations consisted of 1 mg/ml S9 protein and were conducted at 37°C. Cofactors (e.g., GSH and UDPGA) were added to permit phase II metabolism. Initial incubations were conducted in duplicate at 0, 7.5, 15, 30, and 45 minutes, and the responses at each concentration were used to generate a velocity for the corresponding concentration. The results indicate the two WT and KO pairings (i.e., FVB and C57) have nearly equal intrinsic metabolic capacity. Each data point represents the velocity for a given concentration from two separate studies.
TABLE 2.
Summary of in vitro DCF metabolism in mouse models
Metabolic parameters were determined using S9 fraction from FVB and C57 strains of mice that were WT or KO for Mrp3. Data represent the mean ± S.E.M. from two separate studies.
| Genotype | Vmax | Km | Metabolic CLint |
|---|---|---|---|
| pmol/min/mg | µM | µl/min/mg | |
| C57 WT | 846 ± 31 | 69.3 ± 4.3 | 12.2 |
| C57 KO | 882 ± 26 | 82.4 ± 1.1 | 10.7 |
| FVB WT | 734 ± 32 | 44.3 ± 3.5 | 16.7 |
| FVB KO | 696 ± 79 | 43.3 ± 9.0 | 16.4 |
CLint, intrinsic uptake clearance.
In Vitro Transport of DCF-AG with Human MRP2 and MRP3.
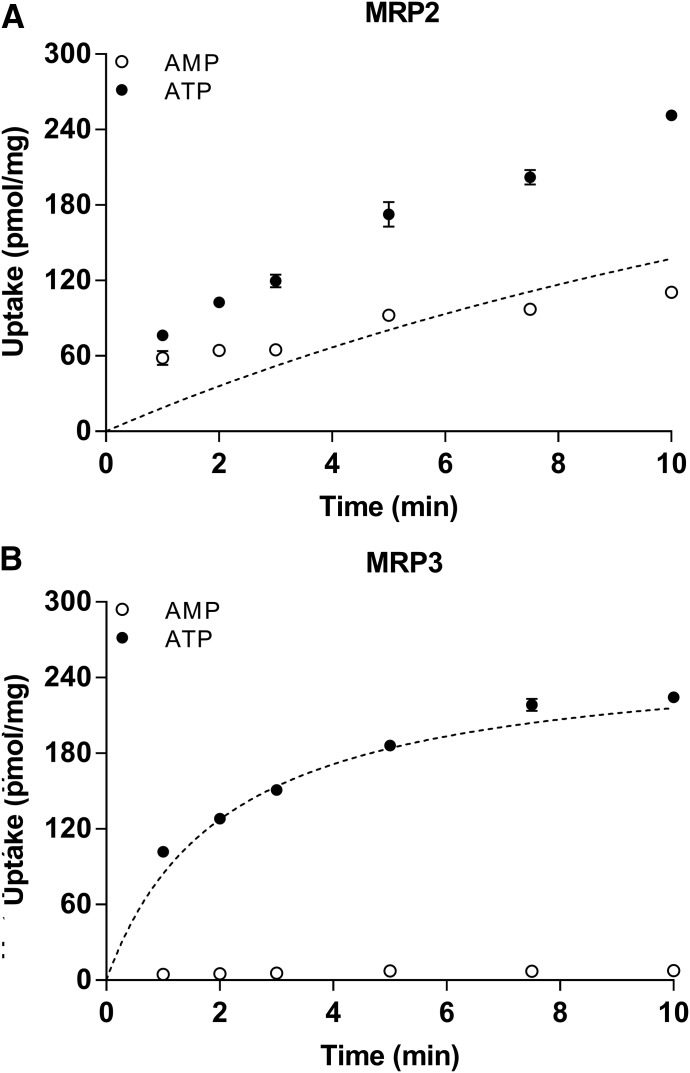
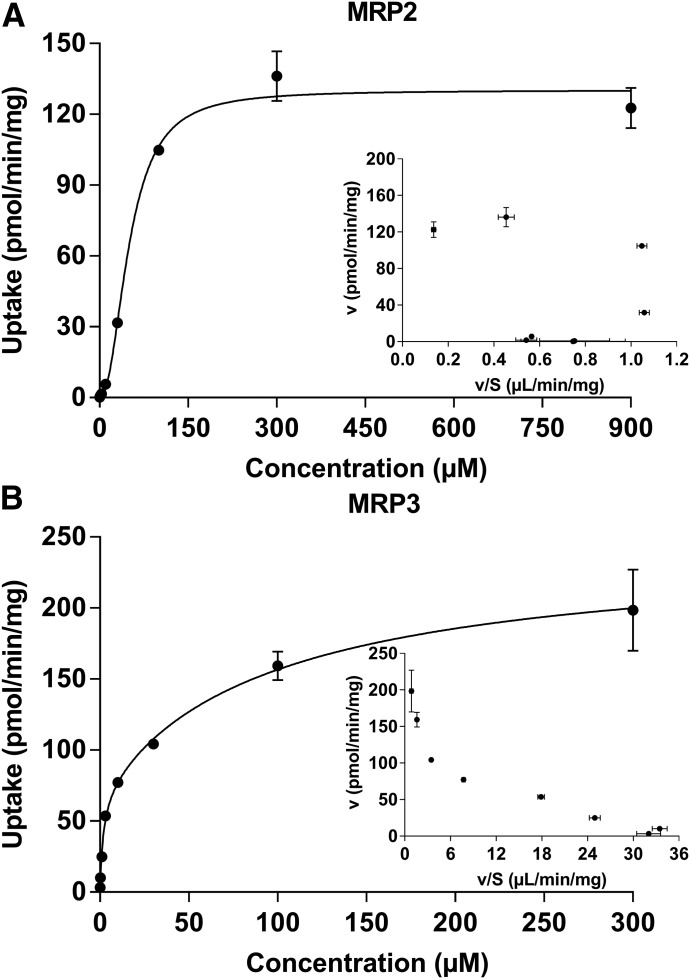
The mouse models indicate that Mrp3 can mediate the efflux of DCF-AG in vivo; therefore, the next objective was to determine the interaction of DCF-AG with human MRP3. As rodent Mrp2 was previously shown to modulate DCF-AG toxicity (Seitz et al., 1998), human MRP2 was also examined for DCF-AG affinity. MRP2 and MRP3 inside-out vesicles were assessed for DCF-AG transport (Fig. 10). The uptake of DCF-AG into MRP2- and MRP3-containing vesicles was found to be ATP- and time-dependent. Having established an optimal incubation time for further studies, vesicles were incubated for 5 minutes in the presence of various DCF-AG concentrations. The concentration-dependent uptake of DCF-AG by MRP2 and MRP3 was determined to be saturable (Fig. 11). The Eadie-Hofstee plot for MRP2 uptake suggests an allosteric sigmoidal interaction; hence, the ATP-dependent data were fit using this model. MRP3 uptake of DCF-AG, when graphed using an Eadie-Hofstee plot, indicated a biphasic profile. Therefore, MRP3 data were fit using a two-Km model. The results of the model outputs for MRP2 and MRP3 are summarized in Table 3. The Vmax and Km for MRP2 vesicular uptake of DCF-AG were determined to be 130 pmol/min/mg and 50.5 µM, respectively, yielding a transporter intrinsic clearance (using eq. 3) of 2.58 µl/min/mg. Analysis of MRP3 kinetics led to identification of a possible low-affinity and high-affinity binding site for DCF-AG transport. The low-affinity Vmax and Km for MRP3 were 170 pmol/min/mg and 98.2 µM, respectively, with a transporter clearance of 2.37 µl/min/mg for the low-affinity site. The high-affinity Vmax and Km parameters were estimated to be 71.9 pmol/min/mg and 1.78 µM, respectively, and the high-affinity transporter clearance was calculated to be 40.3 µl/min/mg.
Fig. 10.
Time-dependent transport of DCF-AG by MRP2 and MRP3 using inside-out vesicles. DCF-AG was incubated with vesicles in the presence of 5 mM AMP (○) or 5 mM ATP (●) at 37°C. (A) Uptake of 10 µM DCF-AG by MRP2. (B) Uptake of 1 µM DCF-AG by MRP3. The dotted lines in both plots represent the nonlinear fit of DCF-AG active uptake and were determined by subtracting the AMP values (background and passive uptake) from the ATP response. Each data point reflects the mean ± the S.E.M. for n = 3 measurements per time point.
Fig. 11.
Determination of the concentration-dependent transporter kinetics of MRP2 and MRP3 for DCF-AG. MRP2 and MRP3 vesicles were incubated with increasing concentrations of DCF-AG in the presence of 5 mM AMP or ATP for 5 minutes at 37°C. AMP response was subtracted from ATP, and the resulting data were fit to determine kinetic parameters. (A) MRP2 data were fit according to an allosteric sigmoidal model that yielded an apparent Hill slope of 2.2. (Inset) Eadie-Hofstee plot. (B) MRP3 data were fit according to a two-Km indicating the presence of high-affinity and low-affinity binding sites. (Inset) Eadie-Hofstee plot. Each data point reflects the mean ± S.E.M. for n = 3 measurements per concentration.
TABLE 3.
Summary of MRP2 and MRP3 vesicle kinetic studies for DCF-AG
MRP2 had single-Km transport affinity for DCF-AG, whereas MRP3 demonstrated biphasic kinetics. Intrinsic transporter clearance (Vmax/Km) for MRP2 and the low-affinity MRP3 clearance was comparable. In contrast, the high-affinity MRP3 efflux clearance was over an order of magnitude greater than that of MRP2.
| Transporter | Vmax | Km | Transport CLint |
|---|---|---|---|
| pmol/min/mg | µM | µl/min/mg | |
| MRP2 | 130 | 50.5 | 2.58 |
| MRP3 (low affinity) | 170 | 98.2 | 2.37 |
| MRP3 (high affinity) | 71.9 | 1.78 | 40.3 |
CLint, intrinsic uptake clearance.
Discussion
The intention of the present work was to investigate the impact of efflux transporters on DCF. Studies in Transport Deficient (TR-)− rats that have a spontaneous mutation of the Abcc2 gene and lack Mrp2 demonstrated that these mutants are resistant to intestinal injury compared with nonmutant rats (Kitamura et al., 1990; Seitz et al., 1998). Although intestinal injury in the TR− rats was significantly less than in nonmutants, gastrointestinal damage was not completely abolished due to COX inhibition by DCF. The mechanism of the decreased injury stems from the reduced biliary translocation of reactive intermediates, such as DCF-AG, from the hepatocyte into the bile canaliculi (Seitz and Boelsterli, 1998; Seitz et al., 1998; Atchison et al., 2000). Last, administration of bile containing DCF-AG directly into the intestinal lumen of TR− rats resulted in formation of ulcers and intestinal injury with the argument that DCF-AG, as a reactive metabolite, was mediating the toxicity (Seitz and Boelsterli, 1998).
The DCF doses were set to 3 and 10 mg/kg to establish linearity and not saturate either metabolism or transport pathways. Metabolic saturation was thought to have occurred at a 75-mg/kg-DCF dose that was associated with toxicity in Mrp3-null mice (Scialis et al., 2015). Additionally, since DCF is a known hepatotoxicant and transporter inhibitor, the selected doses permitted pharmacokinetic analysis while limiting DCF exposure that may contribute to animal toxicity or inhibition of transporter function. Data from two subtoxic doses of DCF indicate that Bcrp and Mrp3 are both able to transport DCF and its metabolites. Bcrp KO mice had less biliary excretion of DCF than WT mice after a 3- or 10-mg/kg dose of DCF (Figs. 1D and 2D). The reduction in biliary excretion of DCF in the KO mice did not alter the DCF plasma concentration or the liver concentrations in the Bcrp KO mice. Bcrp-null mice had higher DCF-AG plasma concentrations compared with WT mice (Figs. 1C and 2C), and the Bcrp KO mice also exhibited a decrease in the biliary excretion of DCF-AG (Figs. 1F and 2F). Our hypothesis for the increase in plasma DCF-AG in Bcrp-null mice is that decreased Bcrp-mediated biliary excretion of DCF led to further hepatic glucuronidation of DCF to DCF-AG, which was then excreted out of the liver into blood via Mrp3. Taken together, these results indicate that Bcrp does play a role, in vivo, in the biliary excretion of DCF and DCF-AG.
Lagas et al. (2009) reported Bcrp transport of DCF using transfected MDCK cells in a transwell format wherein murine Bcrp exhibited greater DCF transport compared with human BCRP. Curiously, a follow-up study by Lagas et al. (2010) with an in vivo Bcrp knockout mouse model from an FVB background contradicted their in vitro data in that Bcrp-null mice had 1.2-fold (not statistically significant) more biliary DCF compared with WT. In contrast, we observed that Bcrp-null mice had 55%–62% less biliary excretion of DCF compared with WT mice. The authors acknowledge a disconnect between their in vitro and in vivo data, yet there was no rationale given for the divergent results. DCF-AG WT plasma concentrations in the Lagas in vivo study were modestly higher without statistical significance, in contrast to the present data that reflect 1.8- and 3.2-fold higher plasma concentrations in KO mice relative to WT mice (Figs. 1C and 2C). The Lagas study did indicate biliary DCF-AG levels were 52% lower in Bcrp KO mice compared with WT mice; however, only a single time point and dose were used for the comparison. In contrast, we report plasma and bile profiles over a greater span of time and at two doses, giving more power to make dispositional characterizations.
We report that Mrp3 is responsible for the in vivo transport of DCF-AG. This key outcome was observed in the plasma profiles at each subtoxic dose, for which Mrp3-null mice had 86%–88% lower DCF-AG plasma concentrations compared with WT mice (Figs. 4C and 5D). In the same Lagas et al. (2010) publication referenced previously, Mrp3-null mice had approximately 50% lower DCF-AG plasma concentrations (at 60 minutes) compared with WT mice; hence, our data are confirmatory. Whereas Bcrp deletion led to altered disposition of plasma and biliary profiles for DCF and DCF-AG, Mrp3 deletion only affected DCF-AG basolateral transport with no changes to DCF-AG biliary output (Figs. 4F and 5F) or in hepatic levels of DCF-AG (Fig. 6). These observations are consistent with our 75-mg/kg-DCF toxicokinetic data (Scialis et al., 2015). One might have anticipated an increase in hepatic accumulation or biliary excretion of DCF-AG in Mrp3 KO mice given the prior reports of increased biliary excretion of 4-methylumbelliferyl glucuronide and acetaminophen glucuronide in Mrp3-null mice (Manautou et al., 2005; Zamek-Gliszczynski et al., 2006b). A precedent for decreased hepatic elimination without concomitant increase in hepatic accumulation was observed by Lagas et al. (2010), for which deletion of Mrp2 in mice resulted in an 8-fold elevation in plasma DCF-AG compared with WT mice; however, the hepatic concentrations of DCF-AG were the same between WT and Mrp2-null mice. DCF-AG is inherently unstable at physiologic pH, for which we have observed a half-life of approximately 90 minutes at 37°C (Supplemental Fig. 1). The aqueous half-life determined in our laboratory supports the position that DCF-AG would possess sufficient stability in bile during our 15-minute collection interval to quantify potential differences in biliary excretion between WT and KO mice. There remains a possibility that DCF-AG may have undergone further metabolism in Mrp3 KO mice, potentially explaining the lack of hepatic accumulation or biliary elimination. Nonetheless, we believe the lack of difference between WT and Mrp3-null mice in biliary DCF-AG is a bona fide outcome rather than an artifact.
The two mouse strains were evaluated for their intrinsic metabolic capacity to metabolize DCF using S9 fraction. S9 was chosen as the modality for this assessment due to the presence of microsomal and cytosolic enzymes (Lu, 2014). The results from in vitro metabolism studies suggest that the C57 and FVB mice have a similar metabolic capacity to metabolize DCF (Fig. 9). From these data, it can be inferred that deletion of transporters did not result in any compensatory changes to enzymatic (phase I and phase II) activity. Therefore, changes in the biliary excretion or plasma dispositional profiles are reflective of diminished transporter capacity, due to selective genetic deletion, rather than innate differences in metabolic competency.
The bile from WT and KO mice was examined by LC-MS/MS to quantify biliary elimination and determine if additional metabolites of DCF were present. The biliary concentrations of DCF-AG were 10-fold greater than DCF and OH-DCF, and the amount of DCF-AG excreted in bile accounted for nearly 12% of the administered dose of DCF. A diclofenac taurine conjugate (designated as M6 in Fig. 8) was also detected and found to have a signal intensity (Fig. 7A) nearly equal to DCF-AG (Fig. 7C). The diclofenac taurine<space>(DCF-TAU) response suggests that taurine conjugation may be as dominant of a metabolic process as glucuronidation. Taurine conjugates of DCF in mice and dogs were previously reported, furthering the notion that taurine conjugation constitutes a significant clearance mechanism (Riess et al., 1978; Stierlin et al., 1979; Pickup et al., 2012; Sarda et al., 2012). Taurine conjugation is an important detoxification step because the amide formed results in a more stable chemical structure compared with the ester bond that is present in DCF-AG (Montalbetti and Falque, 2005; Choudhary and Raines, 2011). Another biliary metabolite of high intensity observed at m/z of 572 was categorized as M7 (Fig. 8). The structure of M7 remains to be elucidated; however, it may be similar to a glutathione adduct that was described by Yu et al. (2005). The significance of the spectral scans and identification of other conjugated metabolites implies that the portion of DCF-AG which was not excreted into plasma was putatively converted into other metabolites that were ultimately transported into bile.
With data demonstrating in vivo DCF-AG transport in rodents, studies were performed to assess the affinity of DCF-AG to be transported by human MRP2 and MRP3. Prior studies with MRP2 and MRP3 vesicles have been conducted; however, these analyses were carried out under nonphysiologic conditions such as pH 6 and the absence of glutathione, which is thought to enhance MRP function (Zaman et al., 1995; Zhang et al., 2016). Our study corrects for such conditions by performing experiments at pH 7 in the presence of glutathione positioning our data as more reflective of the intracellular enviroment that DCF-AG would be exposed to in vivo.. The present results indicate that DCF-AG is a substrate of MRP2 (Fig. 10A), and that transport by MRP2 is saturable (Fig. 11A). The affinity of DCF-AG for MRP2 was relatively weak, as ATP-dependent transport was 1.5- to 2.0-fold greater than AMP responses. Furthermore, the activity of MRP2 for DCF-AG appears to have an element of allosteric modulation, evident by a Hill slope estimate of 2.2. The Eadie-Hofstee plot for MRP2 is in agreement with an allosteric effect (Hutzler and Tracy, 2002). The allosterism is a function of MRP2 having multiple binding sites (Zelcer et al., 2003). Similar to DCF-AG, estradiol glucuronide was demonstrated to be transported with cooperative binding by human MRP2 vesicles, as it had a Hill slope of 2.4 (Elsby et al., 2011; Li et al., 2011). MRP3-mediated transport of DCF-AG was determined to be biphasic with a high-affinity and low-affinity binding site (Fig. 11B). Whereas the dynamic response by MRP2 was low, MRP3 had a maximal fold ratio (ATP/AMP) of 37 at the low end of the concentration range, while the minimal ratio was 1.5-fold at the highest tested concentration. The intrinsic transporter clearance of the high-affinity site indicated that DCF-AG can be transported by MRP3 to a greater degree at low DCF-AG concentrations compared with MRP2 (Table 3).
Overall, these data indicate Bcrp can translocate DCF and DCF-AG from hepatocytes, and that Mrp3 is involved in the basolateral efflux of DCF-AG from liver. A limitation of our study was the inability to collect urine due to the anesthetization of the mice and short duration of the time course for sample collection. Had urine been collected, it is possible that Bcrp-KO mice would have less DCF eliminated in urine given that Bcrp is apically expressed in renal proximal tubule cells. Nevertheless, our bile and plasma data offer substantial evidence on the transporter interplay affecting DCF and DCF-AG disposition. The deletion of Bcrp not only diminished biliary DCF-AG efflux but also resulted in increased plasma DCF-AG concentrations. Despite the profound differences in DCF-AG plasma concentrations between WT and KO, there was no effect on DCF-AG biliary clearance. Human MRP3, in an in vitro assay, also appeared able to transport DCF-AG. Based on the in vitro MRP3 vesicle assay and the in vivo Mrp3 KO study, it is highly likely that MRP3 transports DCF-AG in vivo in humans. It has previously been shown that a C24-T polymorphism in MRP2, which causes reduced expression, was linked to higher risk of hepatotoxicity in patients receiving DCF (Daly et al., 2007). As MRP2 is known to transport DFC-AG, the increased toxicity in human MRP2 polymorphs was likely driven by attenuated biliary elimination of the reactive DCF-AG. Consequently, investigations into human MRP3 polymorphisms are warranted to ascertain the extent to which patients may experience dispositional changes to MRP3 substrates.
Abbreviations
- ABCC
ATP-binding cassette transporter family C
- BCRP
breast cancer resistance protein
- COX
cyclooxygenase
- DCF
diclofenac
- DCF-AG
diclofenac acyl glucuronide
- GSH
glutathione
- KO
knockout
- LC-MS/MS
liquid chromatography–tandem mass spectrometry
- MOPS
3-(N-morpholino)propanesulfonic acid
- MRP
multidrug resistance-associated protein
- OH-DCF
4′-hydroxy diclofenac
- UDPGA
uridine 5ʹ-diphosphoglucuronic acid
- WT
wild-type
Authorship Contributions
Participated in research design: Scialis, Manautou.
Conducted experiments: Scialis, Csanaky, Aleksunes.
Performed data analysis: Scialis.
Wrote or contributed to the writing of the manuscript: Scialis, Manautou, Klaassen, Csanaky, Aleksunes.
Footnotes
This research was financially supported by the National Institutes of Health National Institute of Diabetes and Digestive and Kidney Diseases [Grant DK069557] and National Institute of Environmental Health Sciences [Grants ES09649, ES09716, and ES013714].
The authors state no conflict of interests.
 This article has supplemental material available at dmd.aspetjournals.org.
References
- Atchison CR, West AB, Balakumaran A, Hargus SJ, Pohl LR, Daiker DH, Aronson JF, Hoffmann WE, Shipp BK, Treinen-Moslen M. (2000) Drug enterocyte adducts: possible causal factor for diclofenac enteropathy in rats. Gastroenterology 119:1537–1547. [DOI] [PubMed] [Google Scholar]
- Bort R, Macé K, Boobis A, Gómez-Lechón MJ, Pfeifer A, Castell J. (1999) Hepatic metabolism of diclofenac: role of human CYP in the minor oxidative pathways. Biochem Pharmacol 58:787–796. [DOI] [PubMed] [Google Scholar]
- Choudhary A, Raines RT. (2011) An evaluation of peptide-bond isosteres. ChemBioChem 12:1801–1807. [DOI] [PMC free article] [PubMed] [Google Scholar]
- Daly AK, Aithal GP, Leathart JB, Swainsbury RA, Dang TS, Day CP. (2007) Genetic susceptibility to diclofenac-induced hepatotoxicity: contribution of UGT2B7, CYP2C8, and ABCC2 genotypes. Gastroenterology 132:272–281. [DOI] [PubMed] [Google Scholar]
- Elsby R, Smith V, Fox L, Stresser D, Butters C, Sharma P, Surry DD. (2011) Validation of membrane vesicle-based breast cancer resistance protein and multidrug resistance protein 2 assays to assess drug transport and the potential for drug-drug interaction to support regulatory submissions. Xenobiotica 41:764–783. [DOI] [PubMed] [Google Scholar]
- Fisher MB, Campanale K, Ackermann BL, VandenBranden M, Wrighton SA. (2000) In vitro glucuronidation using human liver microsomes and the pore-forming peptide alamethicin. Drug Metab Dispos 28:560–566. [PubMed] [Google Scholar]
- Giacomini KM, Huang SM, Tweedie DJ, Benet LZ, Brouwer KL, Chu X, Dahlin A, Evers R, Fischer V, Hillgren KM, et al. International Transporter Consortium (2010) Membrane transporters in drug development. Nat Rev Drug Discov 9:215–236. [DOI] [PMC free article] [PubMed] [Google Scholar]
- Hirohashi T, Suzuki H, Sugiyama Y. (1999) Characterization of the transport properties of cloned rat multidrug resistance-associated protein 3 (MRP3). J Biol Chem 274:15181–15185. [DOI] [PubMed] [Google Scholar]
- Hutzler JM, Tracy TS. (2002) Atypical kinetic profiles in drug metabolism reactions. Drug Metab Dispos 30:355–362. [DOI] [PubMed] [Google Scholar]
- Kawabata S, Oka M, Shiozawa K, Tsukamoto K, Nakatomi K, Soda H, Fukuda M, Ikegami Y, Sugahara K, Yamada Y, et al. (2001) Breast cancer resistance protein directly confers SN-38 resistance of lung cancer cells. Biochem Biophys Res Commun 280:1216–1223. [DOI] [PubMed] [Google Scholar]
- Kenny JR, Maggs JL, Meng X, Sinnott D, Clarke SE, Park BK, Stachulski AV. (2004) Syntheses and characterization of the acyl glucuronide and hydroxy metabolites of diclofenac. J Med Chem 47:2816–2825. [DOI] [PubMed] [Google Scholar]
- King C, Tang W, Ngui J, Tephly T, Braun M. (2001) Characterization of rat and human UDP-glucuronosyltransferases responsible for the in vitro glucuronidation of diclofenac. Toxicol Sci 61:49–53. [DOI] [PubMed] [Google Scholar]
- Kitamura T, Jansen P, Hardenbrook C, Kamimoto Y, Gatmaitan Z, Arias IM. (1990) Defective ATP-dependent bile canalicular transport of organic anions in mutant (TR-) rats with conjugated hyperbilirubinemia. Proc Natl Acad Sci USA 87:3557–3561. [DOI] [PMC free article] [PubMed] [Google Scholar]
- Lagas JS, Sparidans RW, Wagenaar E, Beijnen JH, Schinkel AH. (2010) Hepatic clearance of reactive glucuronide metabolites of diclofenac in the mouse is dependent on multiple ATP-binding cassette efflux transporters. Mol Pharmacol 77:687–694. [DOI] [PubMed] [Google Scholar]
- Lagas JS, van der Kruijssen CM, van de Wetering K, Beijnen JH, Schinkel AH. (2009) Transport of diclofenac by breast cancer resistance protein (ABCG2) and stimulation of multidrug resistance protein 2 (ABCC2)-mediated drug transport by diclofenac and benzbromarone. Drug Metab Dispos 37:129–136. [DOI] [PubMed] [Google Scholar]
- Li N, Parikh SN, Xiao D, Stresser D, Crespi CL, and Patten CJ (2011) Development and validation of liquid chromatography-tandem mass spectrometry method for inside-out vesicle uptake assay. Drug Metabolism Reviews, 43:sup2, 37-211
- Lu C. (2014) Metabolic stability screen in drug discovery, in Handbook of Metabolic Pathways of Xenobiotics, John Wiley & Sons, Ltd., Hoboken, NJ. [Google Scholar]
- Manautou JE, de Waart DR, Kunne C, Zelcer N, Goedken M, Borst P, Elferink RO. (2005) Altered disposition of acetaminophen in mice with a disruption of the Mrp3 gene. Hepatology 42:1091–1098. [DOI] [PubMed] [Google Scholar]
- Menassé R, Hedwall PR, Kraetz J, Pericin C, Riesterer L, Sallmann A, Ziel R, Jaques R. (1978) Pharmacological properties of diclofenac sodium and its metabolites. Scand J Rheumatol Suppl (22):5–16. [DOI] [PubMed] [Google Scholar]
- Montalbetti CAGN, Falque V. (2005) Amide bond formation and peptide coupling. Tetrahedron 61:10827–10852. [Google Scholar]
- Pickup K, Gavin A, Jones HB, Karlsson E, Page C, Ratcliffe K, Sarda S, Schulz-Utermoehl T, Wilson I. (2012) The hepatic reductase null mouse as a model for exploring hepatic conjugation of xenobiotics: application to the metabolism of diclofenac. Xenobiotica 42:195–205. [DOI] [PubMed] [Google Scholar]
- R Core Team (2015) R: A Language and Environment for Statistical Computing, R Foundation for Statistical Computing, Vienna, Austria. [Google Scholar]
- Riess W, Stierlin H, Degen P, Faigle JW, Gérardin A, Moppert J, Sallmann A, Schmid K, Schweizer A, Sulc M, et al. (1978) Pharmacokinetics and metabolism of the anti-inflammatory agent Voltaren. Scand J Rheumatol Suppl (22):17–29. [DOI] [PubMed] [Google Scholar]
- Roberts MS, Magnusson BM, Burczynski FJ, Weiss M. (2002) Enterohepatic circulation: physiological, pharmacokinetic and clinical implications. Clin Pharmacokinet 41:751–790. [DOI] [PubMed] [Google Scholar]
- Sarda S, Page C, Pickup K, Schulz-Utermoehl T, Wilson I. (2012) Diclofenac metabolism in the mouse: novel in vivo metabolites identified by high performance liquid chromatography coupled to linear ion trap mass spectrometry. Xenobiotica 42:179–194. [DOI] [PubMed] [Google Scholar]
- Scialis RJ, Csanaky IL, Goedken MJ, Manautou JE. (2015) Multidrug resistance-associated protein 3 plays an important role in protection against acute toxicity of diclofenac. Drug Metab Dispos 43:944–950. [DOI] [PMC free article] [PubMed] [Google Scholar]
- Seitz S, Boelsterli UA. (1998) Diclofenac acyl glucuronide, a major biliary metabolite, is directly involved in small intestinal injury in rats. Gastroenterology 115:1476–1482. [DOI] [PubMed] [Google Scholar]
- Seitz S, Kretz-Rommel A, Oude Elferink RP, Boelsterli UA. (1998) Selective protein adduct formation of diclofenac glucuronide is critically dependent on the rat canalicular conjugate export pump (Mrp2). Chem Res Toxicol 11:513–519. [DOI] [PubMed] [Google Scholar]
- Stierlin H, Faigle JW. (1979) Biotransformation of diclofenac sodium (Voltaren) in animals and in man. II. Quantitative determination of the unchanged drug and principal phenolic metabolites, in urine and bile. Xenobiotica 9:611–621. [DOI] [PubMed] [Google Scholar]
- Stierlin H, Faigle JW, Sallmann A, Küng W, Richter WJ, Kriemler HP, Alt KO, Winkler T. (1979) Biotransformation of diclofenac sodium (Voltaren) in animals and in man. I. Isolation and identification of principal metabolites. Xenobiotica 9:601–610. [DOI] [PubMed] [Google Scholar]
- Tang W, Stearns RA, Bandiera SM, Zhang Y, Raab C, Braun MP, Dean DC, Pang J, Leung KH, Doss GA, et al. (1999) Studies on cytochrome P-450-mediated bioactivation of diclofenac in rats and in human hepatocytes: identification of glutathione conjugated metabolites. Drug Metab Dispos 27:365–372. [PubMed] [Google Scholar]
- Varma MV, Steyn SJ, Allerton C, El-Kattan AF. (2015) Predicting clearance mechanism in drug discovery: extended clearance classification system (ECCS). Pharm Res 32:3785–3802. [DOI] [PubMed] [Google Scholar]
- Vlaming ML, Pala Z, van Esch A, Wagenaar E, de Waart DR, van de Wetering K, van der Kruijssen CM, Oude Elferink RP, van Tellingen O, Schinkel AH. (2009) Functionally overlapping roles of Abcg2 (Bcrp1) and Abcc2 (Mrp2) in the elimination of methotrexate and its main toxic metabolite 7-hydroxymethotrexate in vivo. Clin Cancer Res 15:3084–3093. [DOI] [PubMed] [Google Scholar]
- Waldon DJ, Teffera Y, Colletti AE, Liu J, Zurcher D, Copeland KW, Zhao Z. (2010) Identification of quinone imine containing glutathione conjugates of diclofenac in rat bile. Chem Res Toxicol 23:1947–1953. [DOI] [PubMed] [Google Scholar]
- Wu W-N, McKown L. (2004) In vitro drug metabolite profiling using hepatic S9 and human liver microsomes, in Optimization in Drug Discovery (Yan Z and Caldwell G eds) pp 163–184, Humana Press, Totowa, NJ. [Google Scholar]
- Yu LJ, Chen Y, Deninno MP, O’Connell TN, Hop CE. (2005) Identification of a novel glutathione adduct of diclofenac, 4′-hydroxy-2′-glutathion-deschloro-diclofenac, upon incubation with human liver microsomes. Drug Metab Dispos 33:484–488. [DOI] [PubMed] [Google Scholar]
- Zaman GJ, Lankelma J, van Tellingen O, Beijnen J, Dekker H, Paulusma C, Oude Elferink RP, Baas F, Borst P. (1995) Role of glutathione in the export of compounds from cells by the multidrug-resistance-associated protein. Proc Natl Acad Sci USA 92:7690–7694. [DOI] [PMC free article] [PubMed] [Google Scholar]
- Zamek-Gliszczynski MJ, Hoffmaster KA, Humphreys JE, Tian X, Nezasa K, Brouwer KL. (2006a) Differential involvement of Mrp2 (Abcc2) and Bcrp (Abcg2) in biliary excretion of 4-methylumbelliferyl glucuronide and sulfate in the rat. J Pharmacol Exp Ther 319:459–467. [DOI] [PubMed] [Google Scholar]
- Zamek-Gliszczynski MJ, Nezasa K, Tian X, Bridges AS, Lee K, Belinsky MG, Kruh GD, Brouwer KL. (2006b) Evaluation of the role of multidrug resistance-associated protein (Mrp) 3 and Mrp4 in hepatic basolateral excretion of sulfate and glucuronide metabolites of acetaminophen, 4-methylumbelliferone, and harmol in Abcc3-/- and Abcc4-/- mice. J Pharmacol Exp Ther 319:1485–1491. [DOI] [PubMed] [Google Scholar]
- Zelcer N, Huisman MT, Reid G, Wielinga P, Breedveld P, Kuil A, Knipscheer P, Schellens JH, Schinkel AH, Borst P. (2003) Evidence for two interacting ligand binding sites in human multidrug resistance protein 2 (ATP binding cassette C2). J Biol Chem 278:23538–23544. [DOI] [PubMed] [Google Scholar]
- Zelcer N, van de Wetering K, Hillebrand M, Sarton E, Kuil A, Wielinga PR, Tephly T, Dahan A, Beijnen JH, Borst P. (2005) Mice lacking multidrug resistance protein 3 show altered morphine pharmacokinetics and morphine-6-glucuronide antinociception. Proc Natl Acad Sci USA 102:7274–7279. [DOI] [PMC free article] [PubMed] [Google Scholar]
- Zhang Y, Han YH, Putluru SP, Matta MK, Kole P, Mandlekar S, Furlong MT, Liu T, Iyer RA, Marathe P, et al. (2016) Diclofenac and its acyl glucuronide: determination of in vivo exposure in human subjects and characterization as human drug transporter substrates in vitro. Drug Metab Dispos 44:320–328. [DOI] [PubMed] [Google Scholar]


