SUMMARY
The serotonin transporter (SERT) regulates neurotransmitter homeostasis through the sodium-and chloride-dependent recycling of serotonin into presynaptic neurons1–3. Major depression and anxiety disorders are treated using selective serotonin reuptake inhibitors (SSRIs), small molecules that competitively block substrate binding, prolonging neurotransmitter action2,4. The dopamine and norepinephrine transporters, together with SERT, are members of the neurotransmitter sodium symporter (NSS) family. Cocaine and amphetamines inhibit or modulate the transport activities of NSSs2,3 and genetic variants are associated with multiple neuropsychiatric disorders including attention deficit hyperactivity disorder, autism, and bipolar disorder2,5. Studies of bacterial NSS homologs, including LeuT, have shown how transmembrane helices (TMs) undergo conformational changes during the transport cycle, exposing a central binding site to either side of the membrane1,6–12. However, the conformational changes associated with transport in eukaryotic NSSs remain obscure. To elucidate structure-based mechanisms for transport in SERT, we turned to complexes with ibogaine, a centuries old hallucinogenic natural product with psychoactive and anti-addictive properties13,14 (Fig. 1a). Interestingly, ibogaine displays non-competitive inhibition of transport, yet it exhibits competitive binding toward SSRIs15,16. Here we report cryo-EM structures of SERT-ibogaine complexes captured in outward-open, occluded, and inward-open conformations. Ibogaine binds to the central binding site and closure of the extracellular gate largely involves movements of TMs 1b and 6a. Opening of the intracellular gate involves a hinge-like movement of TM1a and partial unwinding of TM5, which together create a permeation pathway enabling substrate and ion diffusion to the cytoplasm. These structures define the structural rearrangements that occur from outward-open to the inward-open conformations, providing insight into the mechanism of neurotransmitter transport and ibogaine inhibition.
SERT, a ~70 kDa monomeric membrane protein, poses a challenge for single particle cryo-EM, and thus we used antibody fragments to provide mass and molecular features to facilitate cryo-EM reconstruction17. We also employed a N- and C-terminally truncated SERT construct, deemed ΔN72,C13, as well as three thermostable variants: ts2-active SERT, which maintains wild-type-like transport properties; ts2-inactive SERT18 which is locked in the outward-open conformation; and C7x, which is devoid of reactive cysteines19. To interrogate ibogaine modulation of SERT, we determined ibogaine inhibition of serotonin uptake for the ts2-active and ΔN72,C13 variants, finding that the IC50 is 5 ± 1 µM (Extended Data Fig. 1a). Upon addition of 5 µM ibogaine, the Vmax was reduced by approximately 50% and the Km for serotonin was unchanged (Extended Data Fig. 1b), consistent with ibogaine acting as a non-competitive inhibitor16. We also investigated the consequences of antibody binding, demonstrating that the ts2-active 15B8 Fab/8B6 scFv complex is transport inactive (Fig. 1b) while the ΔN72,C13 SERT-15B8 Fab complex is transport competent (Fig. 1b).
Figure 1. Ibogaine binding, uptake and labeling experiments.
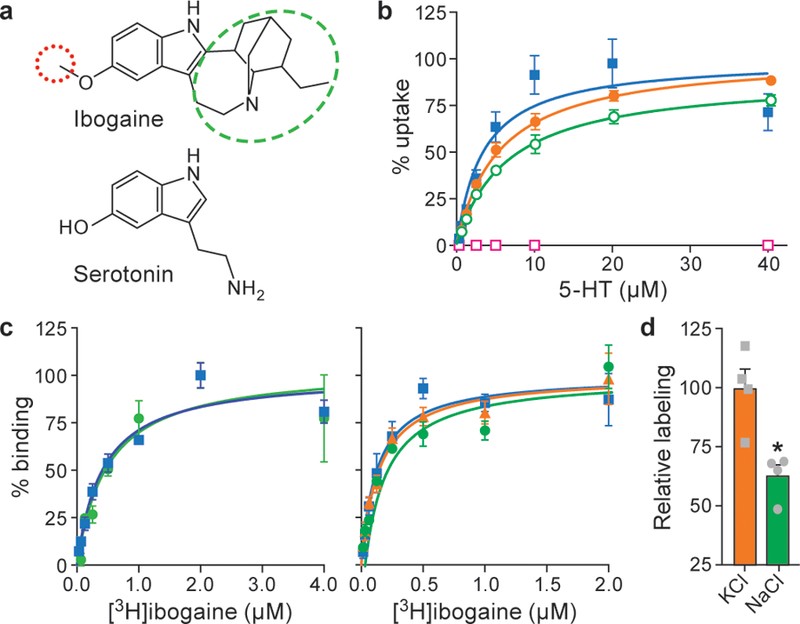
a, Ibogaine and serotonin with the methoxy group and bicyclic cage highlighted by red and green dashed ovals, respectively. Demethylation of the methoxy group of ibogaine produces noribogaine. b, Plots of [14C]5-HT uptake for ts2-active SERT in the absence (blue, squares) or presence (red, open squares) of 1 μM 15B8 and 8B6. [14C]5-HT uptake for ΔN72,C13 SERT (orange, circles) and in the presence of 1μM 15B8 (green, open circles). Symbols show the mean derived from n=3 biological replicates. Error bars show the s.e.m. Experiment was performed three times independently with the same results. c, Left panel, plot of a [3H]ibogaine saturation binding to ts2-active SERT (blue, squares) and in the presence of 15B8 (green, circles) in 100 mM NaCl. Symbols show the mean derived from n=3 technical replicates. Error bars show the s.e.m. Experiment was performed four times independently with the same results. Right panel, graph of [3H]ibogaine saturation binding to ts2-active SERT in 100 mM KCl (blue, squares), 100 mM NMDG-Cl (orange, triangles) and in presence of 15B8 in 100 mM KCl (green, circles), symbols show the mean derived from n=6 biological replicates. Error bars show the s.e.m. Experiment was performed four times independently with the same results. d, Ser277Cys was labeled for 10 min with 10 μM MTS-ACMA in the presence of 100 mM KCl or 100 mM NaCl. The bars show the means and points show the value for each technical replicate. Error bars show the s.e.m. *P < 0.05, One-sided student’s t-test.
Saturation binding experiments of [3H]ibogaine in NaCl to ts2-active SERT without or with the 15B8 Fab yielded Kd values of 400 ± 100 nM and 500 ± 200 nM (Fig. 1c), respectively. To investigate if ibogaine can also bind to the outward-open conformation, we carried out binding experiments on two variants locked in the outward-open conformation. Via direct binding experiments of [3H]ibogaine to the ts2-active 15B8 Fab/8B6 scFv complex and the ts2-inactive variant, we estimate a Kd of 5–8 µM while in [3H]paroxetine competition experiments with the ts2-active 15B8 Fab/8B6 scFv complex we measured a Ki of 3 ± 0.4 µM (Extended Data Fig. 1c,d), experiments which together demonstrate that ibogaine binds ~10-fold more weakly to the outward-open conformation. Moreover, electrophysiological recordings demonstrate that the ibogaine binding site is accessible from the extracellular solution15,20, reinforcing the notion that ibogaine can bind to the transporter by way of the outward-open conformation. We further explored ion dependence and found that ibogaine binds to SERT more tightly in KCl (Kd of 130 ± 30 nM) or N-methyl-d-glucamine hydrochloride (NMDG-Cl; Kd of 140 ± 20 nM) than in NaCl, in agreement with prior studies21, and that the 15B8 Fab does not perturb ibogaine binding in KCl ( Kd of 180 ± 50 nM) (Fig. 1c).
To probe the conformation of SERT employed in the cryo-EM studies reported here, we examined the Ser277Cys mutant, a residue located in the intracellular portion of TM5 that is solvent accessible in the inward-open conformation15,16,19,22,23 (Extended Data Fig 1e). As reported previously15,16, the Ser277Cys mutant in the C7x background, when bound to ibogaine, is more reactive to methanethiosulfonate reagents than when bound to inhibitors that stabilize the outward-open conformation (Extended Data Fig. 1f,g); this differential reactivity of the Ser277Cys variant is further pronounced in KCl in comparison to NaCl (Fig. 1d). Taken together, these observations are consistent with the notion that ibogaine increases the accessibility of the cytoplasmic permeation pathway.
To understand where ibogaine binds to SERT and how ibogaine binding influences the conformation of the transporter, we studied SERT using single particle cryo-EM. To first validate that such studies were feasible, we carried out a ‘control’ reconstruction using the ts2-inactive 15B8 Fab/8B6 scFv complex with the SSRI, paroxetine. We discovered that the cryo-EM map is well fit by the x-ray structure of the ts2-inactive, outward-open paroxetine complex (Extended Data Table 1), and that the map has clear density features for aromatic side-chains and for paroxetine in the central binding site, thus demonstrating the feasibility of single particle cryo-EM of SERT-antibody complexes (Extended Data Fig. 1h–j, Extended Data Fig. 2). With the feasibility of single particle studies established, we employed the ts2-active SERT-15B8 Fab/8B6 scFv complex to investigate ibogaine binding to the outward-open conformation. This ibogaine-bound complex was determined at a resolution of ~4.1 Å (Fig. 2a, Extended Data Table 1). The TM densities were well-defined, continuous and of sufficient strength and connectivity to fit the main chain and to position many of the side chains (Extended Data Fig. 3a–g). Comparison of this complex with known structures of SERT and other transporters allowed unambiguous assignment as the outward-open conformation (Extended Data Fig 3g–i, Extended Data Table 1).
Extended Data Table 1.
Cryo-EM data collection, refinement and validation statistics*
| #1 (EMDB-8941) (PDB 6DZW) |
#2 (EMDB-8942) (PDB 6DZY) |
#3 (EMDB-8940) (PDB 6DZV) |
#4 (EMDB-8943) (PDB 6DZZ) |
#5 (EMDB-0437) | |
|---|---|---|---|---|---|
| Data collection and processing | |||||
| Magnification | 47,893 | 47,893 | 60,753 | 60,753 | 54,945 |
| Voltage (kV) | 300 | 300 | 300 | 300 | 200 |
| Electron exposure (e–/Å2) | 50 | 60 | 48 | 50 | 51 |
| Defocus range (μm) | −1.0 to −2.8 | −0.9 to −2.7 | −1.2 to −2.5 | −0.7 to −2.5 | −0.8 to −2.4 |
| Pixel size (Å) | 1.044 | 1.044 | 0.823 | 0.823 | 0.910 |
| Symmetry imposed | C1 | C1 | C1 | C1 | C1 |
| Initial particle images (no.) | 1,278,876 | 592,117 | 2,615,403 | 1,220,861 | 392,588 |
| Final particle images (no.) | 214,537 | 153,986 | 724,394 | 368,656 | 155,821 |
| Map resolution (Å) | 4.7 | 4.1 | 4.2 | 3.6 | 6.3 |
| FSC threshold | 0.143 | 0.143 | 0.143 | 0.143 | 0.143 |
| Map resolution range (Å)† | 7.5–3.5 | 7.0–3.0 | 7.5–3.5 | 7.0–3.0 | |
| Refinement | |||||
| Initial model used (PDB code) | 6AWN, 5I66, 6D9G | 6AWN, 5I66, 6D9G | 6AWN, 6D9G | 6AWN, 6D9G | |
| Initial model CC | 0.78 | 0.82 | 0.74 | 0.69 | |
| Model resolution (Å)‡ | 7.4 | 4.5 | 5.2 | 4.1 | |
| FSC threshold | 0.5 | 0.5 | 0.5 | 0.5 | |
| Model resolution range (Å) | 251–4.7 | 313–4.1 | 296–4.2 | 313–3.6 | |
| Map sharpening B factor (Å2) | −147 | −400 | −90 | −150 | |
| Model composition | |||||
| Non-hydrogen atoms | 7829 | 7884 | 6121 | 6144 | |
| Protein residues | 1000 | 1005 | 765 | 765 | |
| Ligands (atoms) | 66 | 114 | 86 | 86 | |
| B factors (Å2) | |||||
| Protein | 213 | 140 | 219 | 138 | |
| Ligand | 223 | 161 | 221 | 146 | |
| R.m.s. deviations | |||||
| Bond lengths (Å) | 0.007 | 0.005 | 0.005 | 0.003 | |
| Bond angles (°) | 1.21 | 1.10 | 1.05 | 0.79 | |
| Validation | |||||
| Refined model CC | 0.78 | 0.82 | 0.75 | 0.81 | |
| MolProbity score | 1.34 | 1.57 | 1.18 | 1.47 | |
| Clashscore | 3.61 | 4.50 | 1.65 | 2.79 | |
| Poor rotamers (%) | 0.36 | 0.12 | 0.00 | 0.00 | |
| Ramachandran plot | |||||
| Favored (%) | 96.83 | 95.09 | 96.18 | 93.96 | |
| Allowed (%) | 3.17 | 4.91 | 3.82 | 6.04 | |
| Disallowed (%) | 0 | 0 | 0 | 0 |
Data set #1 is the ts2-inactive paroxetine 15B8 Fab/8B6 scFv reconstruction, #2 is the ts2-active ibogaine outward-open 15B8 Fab/8B6 scFv, #3 ΔN72,C13 ibogaine occluded 15B8 Fab, #4 ΔN72,C13 ibogaine inward-open 15B8 Fab, #5 ΔN72,C13 noribogaine inward-open 15B8 Fab.
Local resolution range.
Resolution at which FSC between map and model is 0.5.
Figure 2. Cryo-EM reconstructions of outward-open, occluded and inward-open conformations.
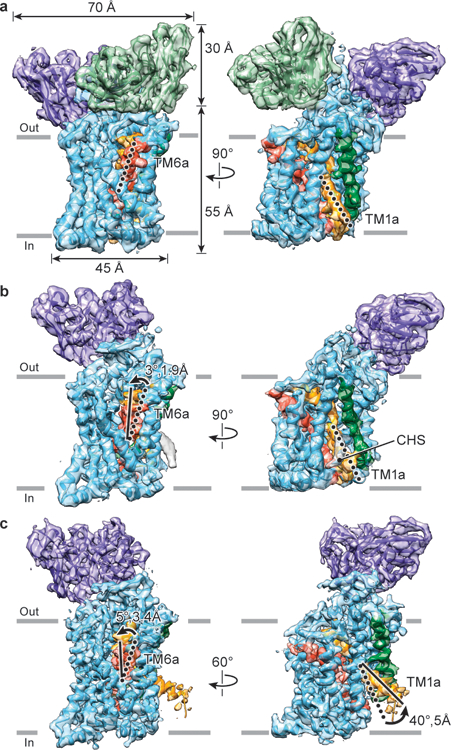
a, Outward-open maps of ts2-active SERT (4.1 Å resolution, contour level ~6.2) bound to 15B8 Fab/8B6 scFv. b, Occluded conformation of ΔN72,C13 SERT bound to 15B8 Fab, in 100 mM NaCl (4.2 Å resolution, contour level ~2.7). c, Inward-open conformation of the ΔN72,C13 SERT-15B8 complex, in the presence of 100 mM KCl (3.6 Å resolution, contour level ~6.7). SERT, 15B8 Fab and 8B6 scFv are in cyan, purple and green respectively; TM1 is orange and TM6 is red and a CHS molecule is in grey. Movements of TM6a and TM1a from outward-open (dotted lines) to occluded and inward-open conformations (filled lines) are indicated.
To further explore the conformations of SERT-ibogaine complexes, we employed Fabs that preserve uptake activity, first elucidating the structure of the ΔN72,C13 SERT-15B8 Fab complex in NaCl, obtaining a reconstruction of the complex at ~4.2 Å, revealing a conformation distinct from the outward-open (Extended Data Fig. 4, Extended Data Table 1). Adjacent to TM1a, a density feature was found that is fit well by a molecule of cholesteryl hemisuccinate (CHS), similar to that observed in the dopamine transporter24,25 (Fig. 2b). Comparison of the positions of TM1 and 6 and the extracellular gate to the equivalent elements of the outward-open complex indicates that this SERT-15B8 Fab-ibogaine complex, in NaCl, adopts an occluded conformation (Fig. 2b, Extended Data Fig. 4h).
In the presence of sodium, the accessibility of residues in the cytoplasmic permeation pathway is reduced19, showing that these conditions populate the inward-closed conformation while removal of sodium increases Thr276 phosphorylation23 and favors the inward-open conformation (Fig. 1d). Thus, we examined the conformation of the ΔN72,C13 SERT-15B8 Fab-ibogaine complex in KCl; the resulting reconstruction yielded a density map at a resolution of ~3.6 Å (Fig. 2c, Extended Data Fig. 5, Extended Data Table 1, Supplementary Video 1). At the cytoplasmic side, a distinct density feature associated with TM1a was observed in this reconstruction, corresponding to a ‘splayed’ conformation of TM1a away from the transporter core, opening the intracellular pathway. The density feature for CHS near TM1a in the occluded conformation (Extended Data Fig. 6a) was not observed in the inward conformation, suggesting that its association may be conformation-dependent. Removal of cholesterol from membranes increases ibogaine binding and mutation of residues lining the CHS binding site favors the inward conformation26. Non-proteinaceous features were also found near Thr276 and Ser277, sites of phosphorylation that influence transporter conformational equilibria 23 (Extended Data Fig. 6b). To further explore the influence of small molecules on the conformation of SERT, we examined noribogaine, an ibogaine metabolite27 and non-competitive inhibitor of serotonin uptake (Fig. 1a, Extended Data Fig. 6c–e). A 3D reconstruction of the ΔN72,C13 SERT-15B8 Fab complex with noribogaine in 100 mM KCl yielded a density map at 6.3 Å, allowing visualization of helical segments (Extended Data Table 1). Subsequent rigid-body fitting of outward-open, occluded or the inward-open conformations into the density map showed that the best fit was obtained with inward-open (Extended Data Fig. 6f–h), demonstrating that in KCl, ibogaine and noribogaine populate the inward-open conformation.
The quality of the density maps allowed localization of ibogaine at the central site and no other density features attributable to ibogaine. Because the density maps are between 3.6–4.2 Å resolution, however, we employed computational docking followed by molecular dynamics simulations to determine the optimal binding poses of ibogaine in the central site (Fig. 3a–c, Extended Data Fig. 7, Supplementary Video 2). We discovered that the tertiary amine of ibogaine interacts with Asp98 (Fig 3a,b, Extended Data Fig. 7b) while the tricyclic ring system lodges between the aromatic groups of Tyr176 and Tyr95 in the outward-open and occluded conformations. SERT-ibogaine interactions which are largely preserved in all three conformations include: the methoxy- group of ibogaine which protrudes into a cavity between TM3 and TM8, near Asn177; Ile172 which sits ‘above’ the tryptamine group and restrains the drug within the central site; and the aromatic ring of Phe341 which is adjacent to the indole nitrogen. Phe335 undergoes conformational changes in going from outward-open and occluded to the inward-open conformation where it moves further into the central site, ultimately blocking ibogaine release from the extracellular side (Fig 3a–c; Supplementary Video 3), while the movement of TM1a in the inward-open conformation disrupts interactions of Tyr95 and Asp98 with ibogaine (Fig 3c). Thus, upon transition of the transporter from outward-open to inward-open, the position of ibogaine adjusts in the direction of TM1a and TM8 toward the cytoplasmic permeation pathway (Fig 3d, Supplementary Video 3).
Figure 3. Ibogaine binding site and conformational changes upon isomerization from the outward-open to the occluded and inward-open states.
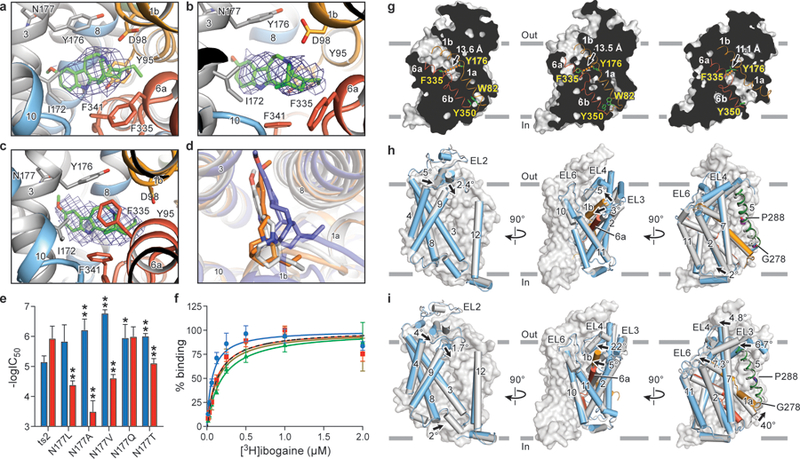
Poses of ibogaine (green) from molecular dynamics studies in the a, outward-open, b, occluded, and c, inward-open conformations. d, Comparison of ibogaine binding poses in outward-open (grey), occluded (orange) and inward-open (blue) conformations. e, The −logIC50 of each mutant for inhibition of uptake for ibogaine (blue) or noribogaine (red) is shown. The mean −logIC50 was determined using the curves in Extended Data Fig. 8a with the error of the fit (s.e.m.) shown. *P < 0.05; **P < 0.01, One-sided student’s t-test. f, [3H]-ibogaine saturation binding experiments of Asn177 mutants in 100 mM KCl, and the corresponding mean Kd values determined using the curves with the error of fit (s.e.m.): Asn177Val (blue circles, 70 ± 20 nM), Asn177Ala (red squares, 130 ± 40 nM), Asn177Thr (green triangles, 200 ± 20 nM), and Asn177Gln (olive inverted triangles, 140 ± 50 nM); binding of [3H]-ibogaine to ts2-active (dotted line) from Figure 1c is shown for comparison. Symbols show the mean derived from n=6 biological replicates. Error bars show the s.e.m. Experiment was performed five times independently with the same results. g, ‘Slab’ views of the extracellular and intracellular cavities in the outward-open (left panel), occluded (middle panel) and inward-open conformations (right panel). TM1 and TM6 are shown as cartoon representations and are orange and red, respectively. Residues defining the extracellular and intracellular gate are in sticks. The distance between extracellular (F335 and Y176) and intracellular gating residues (Y350 and W82) is shown. h, Comparison of the occluded and outward-open (grey) conformations. i, Superposition of inward-open and occluded (grey) conformations.
Upon assessing the binding pose of ibogaine, we observed that the side chain of Asn177 resides near the methoxy group of ibogaine and we reasoned that if the pose is accurate, mutation of the Asn to a smaller, less polar residue should enhance and diminish ibogaine and noribogaine affinity, respectively. We thus measured the inhibition of transport by ibogaine and noribogaine and also the binding of [3H]ibogaine for the Asn177Val, Asn177Ala, Asn177Thr and Asn177Leu mutants, finding more robust inhibition of 5-HT uptake by ibogaine and a weakening of inhibition by noribogaine (Fig. 3e, Extended Data Fig.8a). Strikingly, the Asn177Val variant has a substantially higher binding affinity for [3H]-ibogaine (70 ± 20 nM, P < 0.01, one-sided student’s t-test) in KCl, additionally supporting the binding pose for ibogaine.
We next analyzed the position of the extracellular and intracellular gates to further define the conformation of SERT, finding that the ibogaine-bound, outward-open reconstruction is similar to the x-ray structure of paroxetine-bound SERT28 (Extended Data Fig. 8b). Ibogaine and ions can access the central binding site from the extracellular side, because gating residues (Arg104-Glu493, Cα-Cα distance: 12.0 Å; Tyr176-Phe335: 13.6 Å), conform to an open gate (Fig. 3g) while the closed intracellular gate prevents exposure to the cytoplasm. Upon formation of the occluded conformation, SERT undergoes movements within the core TMs closing the extracellular gate, preventing access of the central binding site. In addition to the closure of the extracellular gate, the most substantial structural changes which occur during the transition from outward-open to the occluded conformation are found in TMs 1b, 5, 6, 7, 10 and in EL6 (Extended Data Fig. 8c). The changes in helical position associated with TM6a include a tilting of 3° and a shift of 1.9 Å toward the scaffold. EL6 also moves by 1.3 Å toward TM1b and TM6a while TM10 tilts by 2° and shifts 0.9 Å in the same direction. TM7 shifts by 1.3 Å in the extracellular side toward the scaffold domain while TM5 experiences a 3.2° rotation and 1.3 Å shift toward TM7 and TM1b (Extended Data Fig. 8c–e). In NSSs, an allosteric site formed by residues in an extracellular vestibule modulates dissociation from the central site28–30. The closure of the extracellular gate (Arg104-Glu493: 9.7 Å; Tyr176-Phe335: 13.5 Å) changes the nature of the extracellular vestibule, as the movement of TM6a toward the scaffold results in the collapse of the allosteric site as evidenced by a reduction in the solvent accessible surface area (SASA) (1448 vs. 1247 Å2), thus reducing the likelihood of association of ibogaine or similar small molecules to the allosteric site (Fig. 3g,h). EL3, which connects TM5 to TM6, further packs against the extracellular halves of these TMs. Subtle changes are also observed in EL4 which experiences a minor shift toward the scaffold, and localized changes in the intracellular portion of TM5 were observed, which may facilitate the transition to the inward-open conformation and opening of TM1a (Fig 3h).
We also investigated the conformational transitions from the occluded to the inward-open states, finding that the most noteworthy structural rearrangements are at the closed extracellular and open intracellular gates. TM1b shifts and tilts by 5.1 Å and 22° while TM6a moves by 3.4 Å and 5° further toward the scaffold, closing the extracellular gate as evidenced by a further reduction in the SASA of the allosteric site (973 Å2) and the distance between extracellular gating residues (Arg104-Glu493: 9.9 Å; Tyr176-Phe335: 11.0 Å) (Fig. 3h,i, Extended Data Fig. 8c). TM2 and TM7 undergo an associated movement of 2.8 and 1.0 Å in the extracellular Cα marker positions with an overall angular change of 7.3 and 4.8° toward the scaffold, respectively. A hinge-like movement of TM1a by 40° toward the plane of the membrane disrupts interactions between its N-terminus and the cytoplasmic half of TM6 (Tyr350, Trp82) that are present in the outward-open and occluded conformations (Cα-Cα distance: 7.0 Å in occluded), opening the cytoplasmic permeation pathway and granting cytoplasmic accessibility to the central binding site (Fig. 3g,i, Extended Data Fig. 8c–e). The movement of TM1a is accompanied by structural changes in TM5 which unwinds at the GlyX9Pro motif7 and expands laterally into the membrane, facilitating a shift of 1.8 Å in the intracellular side and 1 Å in the extracellular side and an angular change of 7° (Fig. 3i, Extended Data Fig. 8f–h). The net result of these movements is a constriction of the extracellular surface and an expansion of the intracellular diameter of the transporter as it transitions from occluded to inward-open (Extended Data Fig. 8c–h, Supplementary Video 4).
The movement of key helices against the scaffold domain mirrors the conformational changes observed in bacterial amino acid transporters, although deviations from the prototypical model are also present (Extended Data Fig. 9). The occluded conformation of SERT most closely resembles the outward-facing occluded conformation of LeuT11 (Extended Data Fig. 9b). The inward-open conformation, the unwound region of TM5 and the degree of the extracellular gate closure most closely resembles MhsT while the open intracellular gate is reminiscent of inward-open LeuT (Extended Data Fig. 9c,e). In LeuT, EL4 undergoes a large-scale movement plugging the extracellular pathway (outward-open vs. inward-open RMSD 5.4 Å, Extended Data Fig. 9d). EL6 likely restricts EL4 in SERT, and more subtle adjustments of EL4 (outward-open vs. inward-open, RMSD 2.7 Å) were observed while changes in EL6 appear to be largely more critical for extracellular gate closure (outward-open vs. inward-open, RMSD 2.7 Å) (Extended Data Fig. 8h). Given the heterogeneity observed for TM1a in the MD simulations of LeuT10, it is possible that TM1a in SERT may also sample different orientations upon the rupture of the intracellular gate.
To gain insight into the occupancy of the sodium sites in the outward-open, occluded and inward-open conformations, we examined the conformations of the surrounding protein residues because, at the present resolutions, we are unable to resolve density for ions. In the outward-open and occluded conformations, the position of residues surrounding Na1 and Na2 sites suggest that these conformations are compatible with two bound sodium ions (Extended Data Fig. 10a). The shift of TM5 toward the membrane together with the unwinding of IL2 allows the cytoplasmic access of Na2 in the inward conformation (Fig. 3i, Extended Data Figs. 8f, 10b,c) similar to MhsT where the unwinding of TM5 at the GX9P motif is also thought to result in the release of sodium from the Na2 site7. Sodium coordinating residues at the Na1 site also undergo considerable displacement in the inward-open conformation but their arrangement suggests that they may still be capable of ion binding. The arrangement of chloride coordinating residues is also consistent with an occupied Cl− site which is not coupled to substrate flux31. Thus, the position of the ion sites suggest distinct roles of Na1, Na2, and for Cl−, where Na2 may be directly coupled to substrate transport32.
We observe that ibogaine interacts with SERT in outward-open, occluded, and inward-open conformations and can be classified as an active site-binding inhibitor which displays non-competitive inhibition characteristics33. As ibogaine cannot directly access the central binding site in the occluded conformation, we speculate that ibogaine binds to either the outward-open or inward-open conformations, suggesting the possibility that it may remain bound and allow for transporter isomerization (Fig. 4). Binding of ibogaine to the inward conformation likely forms the basis for the non-competitive inhibition because serotonin does not compete for binding to this conformation and the SERT-ibogaine complex may exist in dynamic equilibrium with the occluded conformation, depending on the ionic conditions. Ibogaine binding in KCl is in accord with an isomechanistic mechanism33 via direct binding to the inward-open conformation. However, the observation that there is an extracellularly accessible ibogaine binding site15,20 is suggestive of a more complex two-step mechanism, where the first step involves binding to outward-open and the second step involves the stabilization of an occluded or inward-open33. The larger steric bulk of ibogaine, compared to serotonin, may preclude it from binding and unbinding from the central site through the intracellular pathway without considerable conformational fluctuation, even in the inward-open conformation, thus explaining why ibogaine is not a substrate (Extended Data Fig. 10b,c).
Figure 4. Mechanisms of transport and ibogaine action.
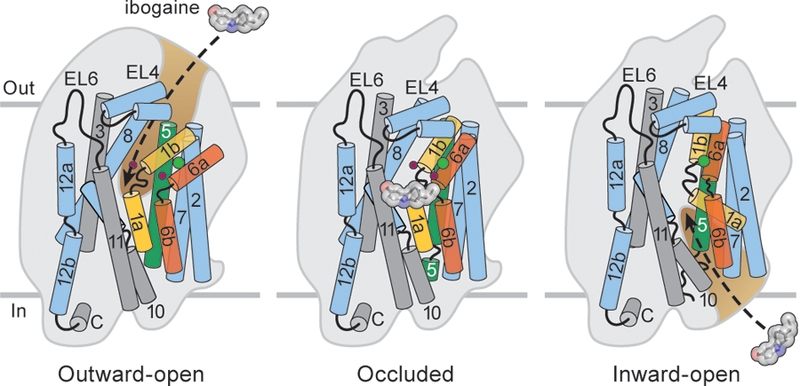
Cartoon depicts conformational differences among outward-open, occluded and inward-open conformations. Ibogaine inhibits SERT either by binding to the outward-open followed by stabilization of the occluded or inward-open conformations or by directly binding to the inward-open conformation. The scaffold domain and associated TMs (grey) and TM2, 7, 8, 10, and 12 are shown in light blue. TM1, TM5 and TM6 are highlighted with orange, red and green. TM 4 and 9 are omitted for clarity. Sodium and chloride are shown as red and green spheres.
METHODS
Data reporting
No statistical methods were used to predetermine sample size. The experiments were not randomized and the investigators were not blinded to allocation during experiments and outcome assessment.
Antibody production
The 15B8 Fab was produced either by papain digestion of 15B8 mAb and purified by cation exchange chromatography, using standard methods28, or by isolation from Sf9 supernatant by metal affinity chromatography for crystallization34. The 8B6 heavy and light chains of the variable domain were fused to a PelB signal sequence, an N-terminal 8-His tag, and connected by a (GGGGS)3 linker to create the 8B6 scFv. The 8B6 scFv was expressed overnight at 25°C in BL21 induced with 0.1 mM isopropyl-β-D-1-thiogalactopyranoside. Periplasmic proteins were extracted by homogenizing cells in 200 mM Tris pH 8, 20% sucrose, 1 mM EDTA, 1 mM phenylmethylsulfonyl fluoride. The buffer was exchanged to 50 mM phosphate pH 8.0, 300 mM NaCl, 10 mM imidazole by dialysis. The 8B6 scFv was purified by metal affinity chromatography and size-exclusion chromatography on a Superdex 75 column.
SERT expression and purification
The human SERT constructs used in this study are the N- and C-terminally truncated wild-type (ΔN72, ΔC13), ts2-active (Ile291Ala, Thr439Ser)28,35, C7x made in the ts2-active background (Cys109Ala, Cys147Ala, Cys155Ser, C166Leu, Cys522Ser, C357Leu, Cys369Leu), and ts2-inactive (Tyr110Ala, Ile291Ala)18. The expression and purification of the aforementioned constructs was carried out as described previously28 with minor changes. SERT was expressed as a C-terminal GFP fusion using baculovirus-mediated transduction of HEK-293S GnTI- cells36. Cells were solubilized in 20 mM Tris pH 8, 150 mM NaCl or 100 mM KCl containing 20 mM n-dodecyl-β-D-maltoside (DDM), 2.5 mM cholesteryl hemisuccinate (CHS), in the presence of 1 µM paroxetine, or 10 µM ibogaine, or 10 µM noribogaine and purified into 1 mM DDM, 0.2 mM CHS, and 1 µM paroxetine, or 10 µM ibogaine, or 10 µM noribogaine in 20 mM Tris pH 8, 100 mM NaCl or 100 mM KCl by Strep-Tactin affinity. The N- and C-terminal GFP and purification tags were removed by thrombin digestion. For the SERT-Fab/scFv complex, 15B8 Fab and 8B6 ScFv were mixed with SERT at a 1:1.2:1.2 molar ratio and purified by size-exclusion on a Superdex 200 column in TBS (20 mM Tris pH 8, 100 mM NaCl) containing 9 mM nonylmaltoside, 0.2 mM CHS, 1 µm paroxetine or 10 µM ibogaine. For the ΔN72,C13 SERT-Fab complex, 15B8 Fab was mixed with SERT at a 1:1.2 ratio and separated by size-exclusion on a Superdex 200 column in 20 mM Tris pH 8, 100 mM NaCl or 100 mM KCl containing 1 mM DDM, 0.2 mM CHS, 10 µM ibogaine or 10 µM noribogaine. The peak fraction containing the SERT complexes was concentrated to 4 mg/ml prior to adding either 250 µM paroxetine, 1 mM ibogaine or 1 mM noribogaine.
Crystallization of 15B8 Fab
The 15B8 Fab was crystallized by hanging drop vapor diffusion. Crystals appeared after several days under conditions with a reservoir solution composed of 80 mM sodium citrate pH 5.2, 2.2 M ammonium sulfate at a 1:1 ratio of protein:reservoir. The 15B8 Fab crystals were cryoprotected with 25% ethylene glycol prior to flash cooling in liquid nitrogen.
Cryo-EM sample preparation and data acquisition
The SERT-antibody complexes (2.5 µl) at a concentration of 40–80 µM were applied to glow-discharged Quantifoil holey carbon grids (gold, 1.2/1.3 or 2.0/2.0 µm size/hole space, 200 mesh). For ‘multi-shot’ data collection37, 100 µM fluorinated n-octyl-β-d-maltoside (final concentration) was added to the sample prior to freezing. The grids were blotted for 1.5–2.5 s at 100% humidity using a Vitrobot Mark IV, followed by plunging into liquid ethane cooled by liquid nitrogen. Images were acquired using a FEI Titan Krios equipped with a Gatan Image Filter operating at 300 kV or an Arctica transmission electron microscope (TEM) at 200 kV. A Gatan K2 Summit direct electron detector was used, on both TEMs, to record movies in super-resolution counting mode with a binned pixel size of 1.044 or 0.823 Å/pixel on the Krios or 0.910 Å/pixel on the Arctica, respectively. The defocus values ranged from −1.0 to −2.5 µm. Exposures of 8–10 s were dose-fractionated into 40–100 frames, resulting in a total dose of 50–60 e−/Å2. Images were recorded using the automated acquisition program SerialEM37.
Image processing
Micrographs were corrected for beam-induced drift using MotionCor238. The contrast transfer function (CTF) parameters for each micrograph were determined using GCTF39. Particles were picked using DoG-picker40. Particles were subjected to reference-free 2D classification in either RELION 2.141 or CryoSPARC42 followed by homogenous refinement in CryoSPARC. Local refinement was performed in cisTEM43 with a mask which excludes the micelle and Fab constant domain to remove low resolution features (Extended Data Fig. 2–5). The molar masses of the SERT-15B8 Fab/8B6 scFv and SERT-15B8 Fab complexes were 135 and 105 kDa respectively. Focused 3D classification44 was also performed in cisTEM using a spherical mask centered on SERT to discover additional conformational heterogeneity. The resolution of the reconstructions was assessed using the FSC criterion and a threshold of 0.14345 in cisTEM43. The high-resolution refinement limit was incrementally increased while maintaining a correlation of 0.95 or greater until no further improvement in map quality was observed. The FSC of the model vs. the full map and half-maps were calculated using the standalone program calculate_fsc which is part of the cisTEM package. The local resolution was calculated using RELION 3.0. Maps were sharpened using cisTEM unless otherwise noted.
For the ts2-inactive paroxetine Fab/scFv data set, a total of 1,278,876 particles with a box size of 240 pixels were selected from 2,904 micrographs (Extended Data Fig. 2a). After two rounds of 2D classification using CryoSPARC, particles that had clearly defined and recognizable features were combined for further analysis. CryoSPARC was used to generate an ab-initio model with 2 classes. Particles belonging to a class with well-defined features were further refined using local refinement in cisTEM. The high-resolution limit cutoff for refinement was 7.5 Å. The map was sharpened using local sharpening in Phenix46. For the ts2-active ibogaine Fab/scFv data set, a total of 592,117 particles with a box size of 300 pixels were selected from 1,639 micrographs. After rounds of 2D classification and ab-initio reconstruction using CryoSPARC, 153,986 particles that had clearly defined features were selected. Particle coordinates were used to calculate the local CTF using GCTF and local refinement was performed in cisTEM (Extended Data Fig. 3a). The high-resolution limit cutoff for refinement was 7.5 Å. The optimal sharpening B factor of −400 Å2 inside the same mask used for refinement was determined by comparing map features for various sharpening factors in cisTEM. A similar strategy was used for ΔN72,C13–15B8 Fab complex with ibogaine in NaCl. A total 2,615,403 particles with a box size of 360 pixels were selected from 10,632 micrographs followed by rounds of 2D classification, ab-initio reconstruction and homogeneous refinement using CryoSPARC. The final particle set contained 724,394 particles which were subjected for local refinement using cisTEM (Extended Data Fig. 4a). The high-resolution limit cutoff for refinement was 7.0 Å. For the ΔN72,C13–15B8 Fab complex with ibogaine in 100 mM KCl containing buffer, 1,220,861 particles with a box size of 380 pixels were selected from 7,732 micrographs. After multiple rounds of 2D classification, ab-initio reconstruction, 3D classification in RELION 2.1, and homogeneous refinement using cryoSPARC, 383,617 particles were subjected to local refinement in cisTEM. (Extended Data Fig. 5a). The high-resolution limit cutoff for refinement was 7.5 Å.
Model building and refinement
Interpretation of the cryo-EM maps relied upon rigid body fitting of the higher resolution SERT and antibody models derived from x-ray crystallography. While the quality of the EM maps precludes a precise analysis of atom-atom interactions, we were able to model the main chain of SERT and position most bulky side-chains. A starting model was generated by fitting SERT (PDB code: 6AWN)18 into the outward-open ibogaine bound reconstruction together with the variable domains of 8B6 (PDB code: 5I66) and 15B8 (PDB code: 6D9G, Extended Data Table 2) Fabs derived from high-resolution crystal structures in Chimera47. Model refinement was performed in Rosetta using iterative local rebuilding48. Models were scored according to the fit to the density and overall Rosetta score. The best models were selected and used as templates for further refinement in RosettaCM. The paroxetine-bound model was refined separately in RosettaCM starting from SERT (PDB code: 6AWN) with the variable domains of 8B6 and 15B8. To build the occluded and inward-open conformation models, the 8B6 variable domain was removed from the outward-open ibogaine ts2-active model followed by fitting of the model into the occluded or inward-open reconstructions. Several rounds of iterative local rebuilding were performed, followed by combining pieces from multiple templates and refinement with RosettaCM. The final stages of model building involved manual adjustments and building where merited by the quality of the EM maps in Coot49 followed by real space refinement in Phenix. For cross-validation, the FSC curve between the refined model and half-maps was calculated and compared to avoid overfitting. Molprobity was used to evaluate the stereochemistry and geometry of the structures50. For the outward-open and occluded reconstructions, residues 79–615 were modeled into the cryo-EM maps while residues 78–617 were modeled for the inward-open reconstruction. This strategy, coupled with docking and molecular dynamics (MD) simulations, furthered our interpretation of the large-scale rearrangements of structural elements in each conformation and provided a basis for molecular details of ibogaine interactions within the central site. Figures were prepared in PyMOL51 and Chimera47. The profile of the intracellular pathways shown in ED Figure 10b,c was calculated using Caver52.
Extended Data Table 2.
Data collection and refinement (statistics for x-ray structure of 15B8 Fab)
| *15B8 Fab (PDB code: 6D9G) | |
|---|---|
| Data collection | |
| Space group | P22121 |
| Cell dimensions | |
| a, b, c (Å) | 82.87, 85.49, 141.70 |
| α,β, γ (°) | 90, 90, 90 |
| Resolution (Å) | 19.9–2.3 (2.38–2.30)† |
| Rmerge | 9.24 (41.33) |
| I / σI | 17.88 (2.68) |
| Completeness (%) | 99.12 (94.15) |
| Redundancy | 10.8 (4.6) |
| Refinement | |
| Resolution (Å) | 19.93–2.3 (2.38–2.30) |
| No. reflections | 45074 (4199) |
| Rwork / Rfree | 19.68/22.67 (29.9/35.6) |
| No. atoms | |
| Protein | 6628 |
| Ligand/ion | 0 |
| Water | 364 |
| B-factors | |
| Protein | 47.3 |
| Ligand/ion | N/A |
| Water | 42.4 |
| R.m.s. deviations | |
| Bond lengths (Å) | 0.002 |
| Bond angles (°) | 0.59 |
A single crystal was used to determine the 15B8 Fab structure.
Values in parentheses are for highest-resolution shell.
Measurements
All distance measurements represent the center of mass calculated from Cα positions. Extracellular measurements were made from Tyr186 in TM3 to marker positions in TM1b (Gln111), 2 (Ala116), 4 (Gln254), 5 (Gly299), 6a (Asp328), 7 (Met386), 8 (Thr421), 9 (Thr480), 10 (Ala486), 11 (Phe556), and 12 (Ser574). Intracellular measurements were made from Gly160 in TM3 to marker positions in TM1a (Lys85), 2 (His143), 4 (Tyr267), 5 (Trp282), 6b (Ser349), 7 (Tyr358), 8 (Glu453), 9 (Arg462), 10 (Phe515), 11 (Trp535), and 12 (Ile599). To measure the angular change between conformations, the TM helices were superimposed and the angle between helices was measured using Cα positions in PyMOL. The uncertainty of each measurement and the position of ibogaine was calculated from 100 models which were randomly perturbing by ~1.0 Å RMSD and real space refined back into each map in Phenix, as described53. The solvent accessible surface area of the allosteric site was calculated from residues within 5 Å of S-citalopram structure (PDB code: 5i73); residues (100, 103–105, 175, 327–338, 368, 490–503, 549–557, 561, 563, 579).
Protein preparation for docking and molecular dynamics simulations
The outward-open ts2-active, occluded ΔN72,C13, and inward-open ΔN72,C13 conformations of SERT were prepared for simulations by removing antibodies, adding missing hydrogen atoms and side chains in PSFGEN54, and by removing CHS from the occluded conformation. For the outward-open conformation, the backbones of Gly83, Lys84, Thr219, and Trp220 were corrected to a trans form using the CISPEPTIDE plugin55 of VMD54. Glu136 and Glu508 were modeled with protonated side chains according to pKa calculations using PROPKA 3.056 for the outward-open and inward-open conformations. For the outward-open and occluded conformations, two Na+ and one Cl− ion were modeled based on the (S)-citalopram and paroxetine-bound x-ray structures of SERT (PDB codes: 5I71 and 5I6X)28, while a Cl− ion was modeled in the inward-open conformation. The models were aligned with the orientation of the paroxetine-bound SERT crystal structure (5I6X) from the OPM (Orientation of Protein in Membranes) database57, available at: [http://opm.phar.umich.edu/].
Force field parameterization
The force field parameters of protonated ibogaine were developed based on the CHARMM General Force Field (CGenFF)58. The atom types and initial parameters were determined using the CGenFF webserver [https://cgenff.paramchem.org]58,59, and the parameters were further optimized using the Force Field Toolkit (ffTK)60 plugin of VMD. The detailed strategy of optimizing parameters are described as follows. First, partial atomic charges were assigned to aliphatic carbon and hydrogen atoms according to the convention of CHARMM force fields (+0.09e per aliphatic hydrogen, neutralized by the negative charge assigned to the carbon atom carrying hydrogens). The partial atomic charges of the methoxyindole group were optimized according to the calculated water interactions of the corresponding atoms in the model compound (5-methoxy-2,3-dimethylindole, MDI) at the HF/6–31G* level. The partial charges of the tertiary amine group were assigned as protons at +0.32e and nitrogen at −0.40e, and all three α-carbons were assigned equal partial charges at +0.21e so that a sum of +1e net charge at the tertiary amine group was satisfied. This partial charge assignment scheme is based on those of other tertiary amine species in CGenFF (e.g., N-methylpiperidine).
The bonded parameters of ibogaine also contain 2 novel bonds, 11 novel angles, and 41 novel dihedrals that were not defined in the standard CGenFF force field. All of these parameters except two dihedrals were directly adopted from the initial parameter set generated from the CGenFF webserver through analogy to existing parameters without further optimization, a standard procedure for CGenFF parameters with low predicted penalty scores59,61 (assigned by the CGenFF webserver). The only two dihedral terms which were optimized were both centered around the rotation of the bond connecting positions 2 and 3 of the indole ring, which were calibrated with a 180° dihedral scan at 15° intervals using the MP2/6–31G* level of theory on the MDI model compound. All quantum mechanical calculations were performed using Gaussian0962 [http://gaussian.com/glossary/g09/].
Computational search for docking poses of ibogaine
A workflow (Extended Data Fig. 7a, Supplementary Video 2) was developed to systematically search for optimal binding poses of ibogaine in the outward-open, occluded, and inward-open conformations of SERT, independently. Using the approximate geometric center of the binding pocket (defined as Tyr95, Ala96, Asp98, Ile172, Ala173, Tyr175, Phe335, Ser336, Gly338, Phe341, Ser438, Gly442, Leu443, Thr497, Gly498, and Val501) as the origin, a 6 × 6 × 6 search grid (1- Å spacing) was defined. For each conformation of SERT, an energy-minimized copy of ibogaine was placed at every grid point, rotated around all combinations of three Euler angles (at 18° intervals), and all six rotameric forms of the methoxy and ethyl groups which resulted in 7.5 million SERT-ibogaine models with different ibogaine poses. These poses were analyzed using the following four steps: 1) a 20-step energy minimization of all the SERT-ibogaine models in NAMD263 to remove straightforward steric clashes, during which the protein backbone was not allowed to move; 2) calculating pair interaction energy (PIE) between ibogaine and the protein by evaluating the sum of van der Waals and electrostatic interaction energies with the PAIRINTERACTION module in NAMD263, only ibogaine poses with negative (favorable) PIE are included in the clustering step; 3) clustering of binding poses of ibogaine based on the mass-weighted root-mean-square deviation (RMSD) of ibogaine using a hybrid k-centers k-medoids clustering method64 with a 2-Å cutoff; and 4) disposing insignificant clusters of binding poses, defined as those with <1% population, or those with negative ΔCCC (the difference in the cross-correlation coefficient with the cryo-EM density between the model with and the model without ibogaine). Steps 1–4 were iterated until the number of clusters converged. From the resulting final clusters (20 clusters for outward-open, 30 for occluded, and 46 for inward-open), the SERT-ibogaine model with the strongest PIE in each cluster was selected for an additional 3000 steps of minimization and a 10-ns MD simulation in NAMD263 (96 independent simulations in total) in a membrane environment (see Methods describing ‘dynamics simulations’). During these steps the protein backbone atoms were harmonically restrained with a 1 kcal/mol/Å2 force constant. Simulation trajectories were recorded every 10 ps. The first 2 ns were discarded to allow for equilibration, resulting in 800 snapshots of ibogaine per simulation. For each SERT conformation, the resulting snapshot sets (20 for outward-open, 30 for occluded, and 46 for inward-open, each set with 800 snapshots) were ranked by their averaged ΔCCC, from which the best snapshot set was selected for each SERT conformation. From these highest-ranked sets the ibogaine pose with the highest ΔCCC was selected as the optimal pose for each conformation.
Molecular dynamics (MD) simulations
The following procedures were used for all the MD simulations performed on ligand-bound SERT systems. Each SERT-ibogaine model was first internally hydrated by adding water molecules with the Dowser plugin65 of VMD, followed by the insertion of the hydrated protein into a lipid bilayer composed of 236 1-palmitoyl-2-oleoyl-sn-glycero-3-phosphocholine (POPC) molecules obtained from CHARMM-GUI66, and solvated with ~100 mM of NaCl (for outward-open and occluded) or ~100 mM of KCl (for inward-open) in VMD54, resulting in a box of ~100×100×105 Å3 dimensions containing ~100,000 atoms.
To investigate the stability of the ibogaine binding poses determined by the ligand docking procedure, two 50-ns simulations were performed with each ibogaine-bound conformation (3 systems in total) in a POPC lipid bilayer, resulting in six trajectories. After 3,000 steps of minimization, the systems were equilibrated for 600 ps, during which Cα atoms, non-hydrogen atoms of ibogaine and the bound ions were restrained by harmonic potentials with decreasing force constants (k=1, 0.5, and 0.1 kcal/mol/Å2 for 200 ps each) to allow for relaxation of protein side chains and hydration of the protein. Weak harmonic potentials (k = 0.1 kcal/mol/Å2) were applied to the Cα atoms (excluding N- and C-termini).
The same simulation protocols were applied to both 10-ns and 50-ns MD simulations. All simulations were performed using NAMD263 and CHARMM36m force fields67 for SERT, CHARMM36 force fields68 for lipids, and the TIP3P model69 for water. The force field parameters for ibogaine were developed based on the CGenFF58, with further optimization using ffTK (see Force field parameterization)60. All simulations were carried out as NPT ensembles, where the system pressure was independently coupled along the XY (membrane plane) and Z (membrane normal) dimensions to allow for their independent changes. Constant temperature was maintained at 310 K using Langevin dynamics with a 1.0 ps−1 damping coefficient, while constant pressure was maintained at 1.01325 bar with the Langevin piston Nosé-Hoover method70,71. Non-bonded interactions were calculated in a pairwise manner within the 12 Å cutoff, with a switching function applied between 10–12 Å. Long-range non-bonded interactions were calculated with the particle mesh Ewald (PME) method72. Bond lengths involving hydrogen atoms were fixed using the SHAKE algorithm73. Simulations were integrated in 2-fs time steps, and trajectories recorded every 10 ps.
Data analysis of simulation trajectories
Hybrid k-centers k-medoids clustering64 was done with MDToolbox [https://mdtoolbox.readthedocs.io/en/latest/introduction.html]. Trajectory analysis was carried out in VMD54 and MDAnalysis74,75. VMD was used for visualization. The cross-correlation coefficient between the cryo-EM map and the model was calculated using the Molecular Dynamics Flexible Fitting plugin76. PIE was calculated in NAMD263. The RMSD and distance plots were smoothed using a sliding window of 50 frames (0.5 ns).
Reconstitution and labeling of SERT in nanodiscs
The Ser277Cys mutant was introduced into the C7x variant in which all reactive endogenous cysteines have been mutated. For labeling studies, purified SERT was mixed with soybean asolectin and MSP1E3D177 and reconstituted into nanodiscs at a molar ratio of 1:5:400 to reduce background labeling. Detergent was removed by incubation with biobeads overnight at room temperature, followed by size-exclusion chromatography on a Superdex 200 column in TBS. SERT in nanodiscs was incubated with 1 mM ibogaine or 0.2 mM paroxetine for 30 minutes at room temperature, followed by labeling with 10 µM MTS-ACMA for the indicated time. Labeled SERT was desalted and analyzed on a non-reducing SDS-PAGE gel.
Radioligand binding and uptake assays
To measure uptake, 1 × 10⁵ HEK-293S GnTI- cells transduced with either ts2-active, Asn177 mutants or ΔN72,C13 SERT were plated into 96-well plates coated with poly-D-lysine. After 24 hrs, cells were washed with uptake buffer (25 mM HEPES-Tris, pH 7.0, 130 mM NaCl, 5.4 mM KCl, 1.2 mM CaCl2, 1.2 mM MgSO4, 1 mM ascorbic acid and 5 mM glucose). In some cases, antibodies were added to cells at a concentration of 1 µM which is in excess of the estimated KD for the 8B6 scFv and the 15B8 Fab (< 10 nM). To measure the background counts, 100 µM paroxetine was added to the cells. [3H]5-hydroxytryptamine (5-HT) diluted 1:500 with unlabeled 5-HT, or [14C]5-HT at concentrations of 0.03–40.0 μM was also added to the cells. In the case of [3H]5-HT, uptake was stopped by rapidly washing cells 3x with 100 µl uptake buffer, solubilizing with 20 µl of 1% Triton-X100, followed by addition of 200 µl of scintillation fluid to each well. The amount of labeled 5-HT was measured by counting in a standard 96-well plate or in a Cytostar-T plate using a MicroBeta scintillation counter. Data were fit to a Michaelis–Menten equation.
Competition binding experiments were performed using scintillation proximity assays (SPA) with 5 nM SERT, 0.5 mg/ml Cu-Ysi beads in TBS containing 1 mM DDM, 0.2 mM CHS, and 5 nM [3H]paroxetine and at 0.1nM–1 mM of the cold competitors. Where indicated, antibodies were added to SERT at a concentration of 1 µM. Experiments were measured in triplicate, and each experiment was performed three times. The error bars for each data point represent the s.e.m. Ki values were determined with the Cheng–Prusoff equation78 in GraphPad Prism.
Ibogaine binding was measured via SPA using ts2-active SERT purified in SPA buffer (20 mM Tris pH 8, 100 mM NaCl or 100 mM KCl containing 50 µM lauryl maltose neopentyl glycol and 10 µM CHS). Each experiment contained SERT at a concentration of 50 nM mixed with 0.5 mg/ml Cu Ysi beads and [3H]ibogaine at a concentration of 15–4000 nM (1:10 hot:cold) in SPA buffer. The background was determined by addition of 100 µM paroxetine to SERT. In the case of binding experiments in KCl or NMDG the buffer was also supplemented with 25 mM NaCl to measure the background. Data was analyzed as a single-site binding function.
Extended Data
Extended Data Figure 1. Non-competitive inhibition of transport by ibogaine, ibogaine binding to outward-open, detection of the inward-open conformation, and the paroxetine ts2-inactive reconstruction.
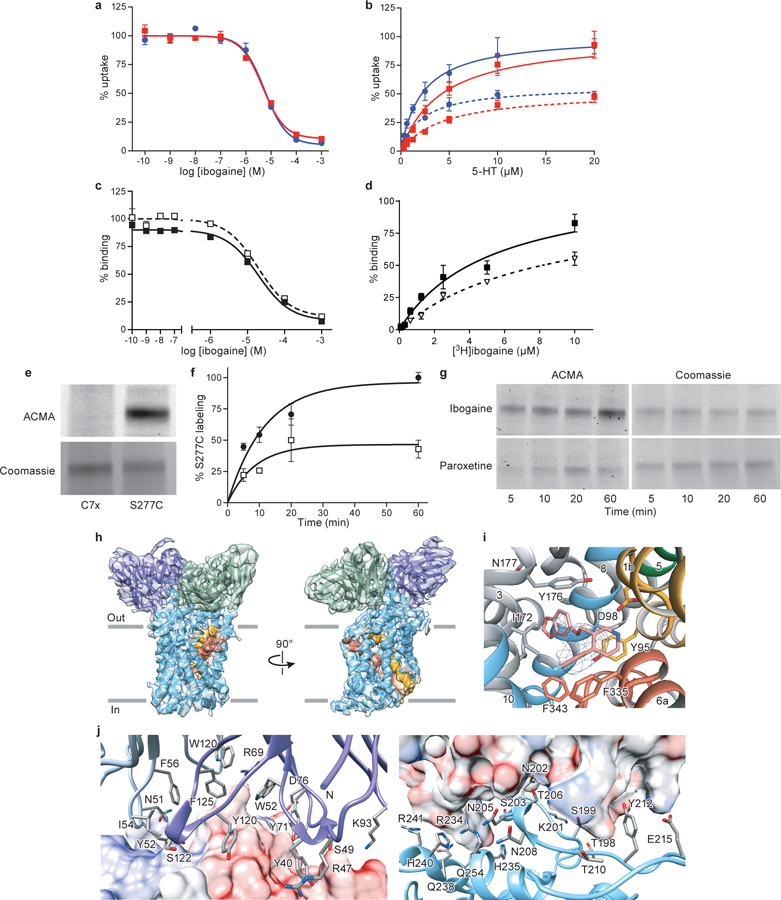
a, Ibogaine inhibition of 5-HT transport for wild type (blue, circles) and ts2 (red, squares) variants using 20 μM [3H]5-HT. Symbols show the mean derived from n=3 biological replicates. Error bars show the s.e.m. Experiment was performed three times independently with the same results. b, Michaelis–Menten plots of 5-HT uptake for wild type (blue) transporter in the absence (circles), or in the presence (dash, circles) of 5 μM ibogaine, and for ts2 (red) in the absence (squares), or in the presence (dash, squares) of 5 μM ibogaine. Symbols show the mean derived from n=3 biological replicates. Error bars show the s.e.m. Experiment was performed three times independently with the same results. The mean Km and error (s.e.m.) of curve fitting for ΔN72,C13: 2.2 ± 0.3 µM; ts2-active: 4 ± 1 µM. c, Competition binding of ibogaine with [3H]paroxetine for ts2 in the absence (filled squares) or presence (open squares) of 1μM 15B8 and 8B6 yields a Ki value 3.2 ± 0.4 µM. Symbols show the mean derived from n=3 technical replicates. Error bars show the s.e.m. The mean Ki and error (s.e.m.) of curve fitting are reported. Experiment was performed three times independently with the same results. d, [3H]-ibogaine saturation binding experiments of ts2-inactive and ts2-active 15B8 Fab/8B6 scFv complex in 100 mM NaCl, and corresponding mean Kd values derived from the curve fit: ts2-inactive (filled squares, > 5 µM), ts2-active 15B8 Fab/8B6 scFv complex (open triangles, > 8 µM). Symbols show the mean derived from n=6 biological replicates. Error bars show the s.e.m. Experiment was performed twice with similar results. e, SDS-PAGE of Ser277Cys labeling with MTS-ACMA compared with the C7X construct in nanodiscs in the presence of 1 mM ibogaine and 100 mM NaCl. There is no detectable labeling of the C7X construct. Experiment was performed three independent times with similar results. f, Time-dependent labeling of Ser277Cys (background construct: ts2-active, C7X) with MTS-ACMA in the presence of ibogaine (filled circles) and paroxetine (open squares) in 100 mM NaCl. Symbols show the mean derived from n=3 technical replicates. Error bars show the s.e.m. Experiment was performed three times with similar results. g, Analysis of Ser277Cys labeling experiments using MTS-ACMA in the presence of ibogaine or paroxetine analyzed by SDS-PAGE and visualized by in-gel fluorescence. Experiment was performed three independent times with similar results. h, Three-dimensional reconstruction and fit to the density map with the model derived from the paroxetine-bound x-ray structure (PDB code: 6AWN)18. SERT is cyan, 15B8 is purple and 8B6 is green; TM1 and TM6 are orange and red, respectively. i, The fit of paroxetine into the EM density map (blue mesh) and interacting residues. j, Left panel, details of the 15B8-SERT interface with the EL2 region shown as an electrostatic surface potential map and 15B8 shown in ribbon representation. The Fab is colored dark blue (heavy chain) or light blue (light chain), selected Fab residues within 5 Å of SERT are shown as sticks. The right panel is a similar view but with the Fab shown as a semitransparent electrostatic surface potential. EL2 of SERT is shown in ribbon representation and colored cyan.
Extended Data Figure 2. Cryo-EM reconstruction of ts2-inactive 15B8 Fab/8B6 scFv/paroxetine complex.
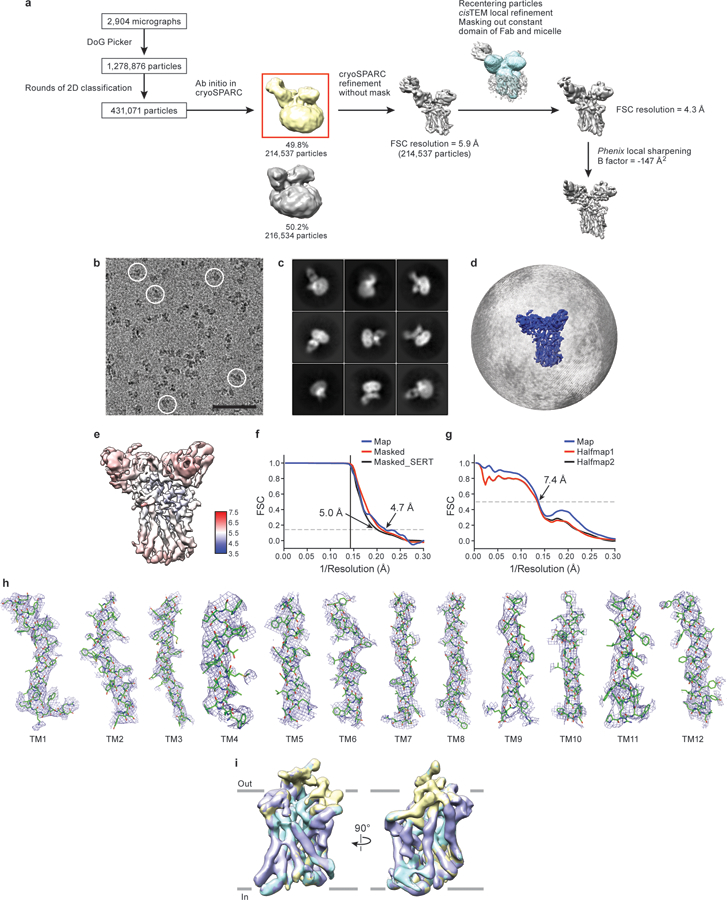
a, Work-flow of cryo-EM data processing of the ts2-inactive Fab/scFv complex with paroxetine in outward-open conformation. After particle picking, particles were sorted using 2D classification. 3D ab-initio classification was performed after 2D classification on cryoSPARC. One out of two predominant classes (boxed) exhibited a subset of homogeneous particles which were used for further processing and global alignment in cryoSPARC. The other class upon refinement only yielded a low-resolution map which did not exhibit any significant differences upon comparison between classes. cisTEM local refinement improved the resolution upon masking of the Fab constant domain and micelle (mask is shown overlaid in blue on top of the reconstruction). The final reconstructed volume was sharpened using Phenix. b, Representative cryo-EM micrograph. Individual single particles are circled in white. Bar equals 50 nm. c, 2D class averages after three rounds of classification. d, The angular distribution of particles used in the final reconstruction. e, Cryo-EM density map colored by local resolution estimation. f, FSC curves for cross-validation, the final map (blue), masked SERT-Fab complex (red), and a mask which isolated SERT (black). The high-resolution limit cutoff for refinement was 7.5 Å. g, model vs. half map 1 (working, red), half map 2 (free, black), model vs. final map (blue). h, Cryo-EM density segments of TM1 - TM12. i, A spherical mask placed over SERT was used for focused 3D classification with 3 classes. Comparison of the classes did not reveal any substantial differences. The antibodies were removed for clarity. The number of particles belonging to each class average are: class 1, purple (11.9%, 25,530 particles); class 2, yellow (54.9%, 117,781 particles); class 3, cyan (33.2%, 71,226 particles).
Extended Data Figure 3. Cryo-EM reconstruction of ts2-active 15B8 Fab/8B6 scFv/ ibogaine complex.
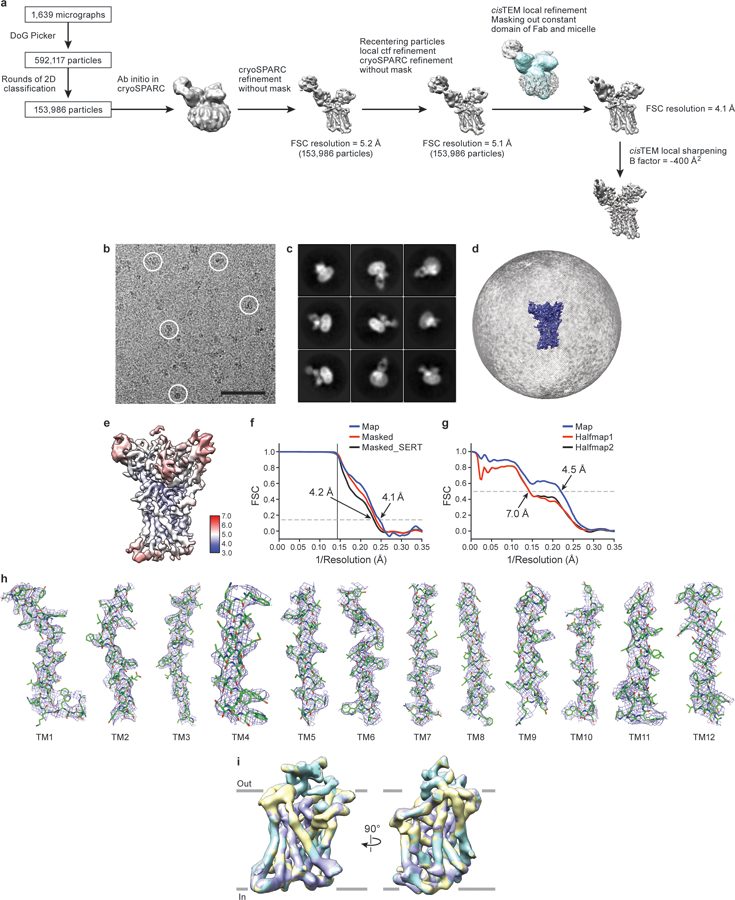
a, Work-flow of cryo-EM data processing of the ts2-active Fab/scFv complex with ibogaine in outward-open conformation. After particle picking, particles were sorted using 2D classification. Ab-initio was performed in cryoSPARC after 2D classification to obtain an initial reconstruction. Particles were used for further processing and global alignment in cryoSPARC followed by recentering in Relion and calculation of the local CTF using GCTF. cisTEM local refinement improved the resolution upon masking of the Fab constant domain and micelle (mask is shown overlaid in blue on top of the reconstruction). The final reconstructed volume was sharpened using cisTEM. b, Representative cryo-EM micrograph. Individual single particles are circled in white. Bar equals 50 nm. c, 2D class averages after three rounds of classification. d, The angular distribution of particles used in the final reconstruction. e, Cryo-EM density map colored by local resolution estimation. f, FSC curves for cross-validation, the final map (blue), masked SERT-Fab complex (red), and a mask which isolated SERT (black). The high-resolution limit cutoff for refinement was 7.5 Å. g, Model vs. half map 1 (working, red), half map 2 (free, black), model vs. final map (blue). h, Cryo-EM density segments of TM1 – TM12. i, A spherical mask placed over SERT was used for focused 3D classification with 3 classes. Comparison of the classes did not reveal any substantial differences. The antibodies were removed for clarity. The number of particles belonging to each class average are: class 1, purple (33.6%, 51,739 particles); class 2, yellow (38.8%, 59,747 particles); class 3, cyan (27.6%, 42,500 particles).
Extended Data Figure 4. Cryo-EM reconstruction of ΔN72,C13 SERT/15B8 Fab/ibogaine complex in NaCl.
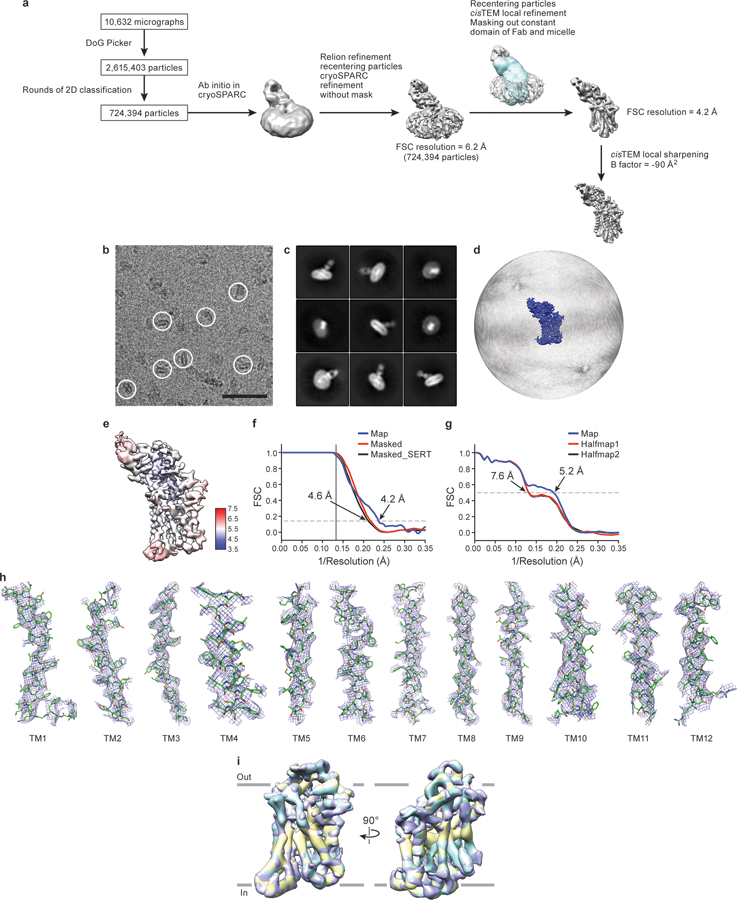
a, Work-flow of cryo-EM data processing of the ΔN72,C13 SERT/15B8 Fab complex with ibogaine in occluded conformation. After particle picking, particles were sorted using 2D classification. Ab-initio was performed in cryoSPARC after 2D classification to obtain an initial reconstruction. Particles were used for further processing and global alignment in cryoSPARC followed by recentering in Relion and calculation of the local CTF using GCTF. cisTEM local refinement improved the resolution upon masking of the Fab constant domain and micelle (mask is shown overlaid in blue on top of the reconstruction). The final reconstructed volume was sharpened using cisTEM. b, Representative cryo-EM micrograph. Individual single particles are circled in white. Bar equals 50 nm. c, 2D class averages after three rounds of classification. d, The angular distribution of particles used in the final reconstruction. e, Cryo-EM density map colored by local resolution estimation. f, FSC curves for cross-validation, the final map (blue), masked SERT-15B8 Fab complex (red), and a mask which isolated SERT (black). The high-resolution limit cutoff for refinement was 7.0 Å. g, model vs. half map 1 (working, red), half map 2 (free, black), model vs. final map (blue). h, Cryo-EM density segments of TM1 - TM12. i, A spherical mask placed over SERT was used for focused 3D classification with 3 classes. Comparison of the classes did not reveal any substantial differences. The Fab was removed for clarity. The number of particles belonging to each class average are: class 1, purple (78.9%, 571,547 particles); class 2, yellow (6.9%, 49,983 particles); class 3, cyan (14.2%, 102,863 particles).
Extended Data Figure 5. Cryo-EM reconstruction of ΔN72,C13 SERT/15B8 Fab/ibogaine complex in KCl.
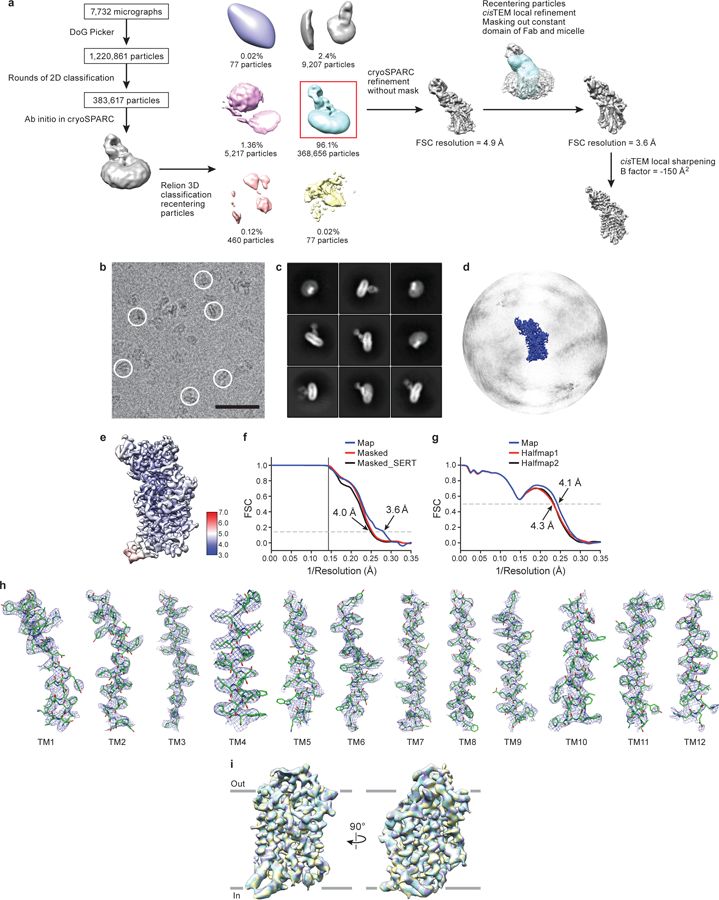
a, Work-flow of cryo-EM data processing of the ΔN72,C13 SERT/15B8 Fab complex with ibogaine in KCl in the inward-open conformation. After particle picking, particles were sorted using 2D classification. Ab-initio was performed in cryoSPARC after 2D classification to obtain an initial reconstruction. Particles were further sorted in Relion using 3D classification and refined further in cryoSPARC. cisTEM local refinement improved the resolution upon masking of the Fab constant domain and micelle (mask is shown overlaid in blue on top of the reconstruction). The final reconstructed volume was sharpened using cisTEM. b, Representative cryo-EM micrograph. Individual single particles are circled in white. Bar equals 50 nm. c, 2D class averages after three rounds of classification. d, The angular distribution of particles used in the final reconstruction. e, Cryo-EM density map colored by local resolution estimation. f, FSC curves for cross-validation, the final map (blue), masked SERT-Fab complex (red), and a mask which isolated SERT (black). The high-resolution limit cutoff for refinement was 7.5 Å. g, model vs. half map 1 (working, red), half map 2 (free, black), model vs. final map (blue). h, Cryo-EM density segments of TM1 - TM12. i, A spherical mask placed over SERT was used for focused 3D classification with 3 classes. Comparison of the classes did not reveal any substantial differences. The Fab was removed for clarity. The number of particles belonging to each class average are: class 1, purple (32.9%, 121,288 particles); class 2, yellow (33.7%, 124,237 particles); class 3, cyan (33.4%, 123,131 particles).
Extended Data Figure 6. Cholesteryl hemisuccinate, map features at Thr276 and Ser277, and SERT-noribogaine complex.
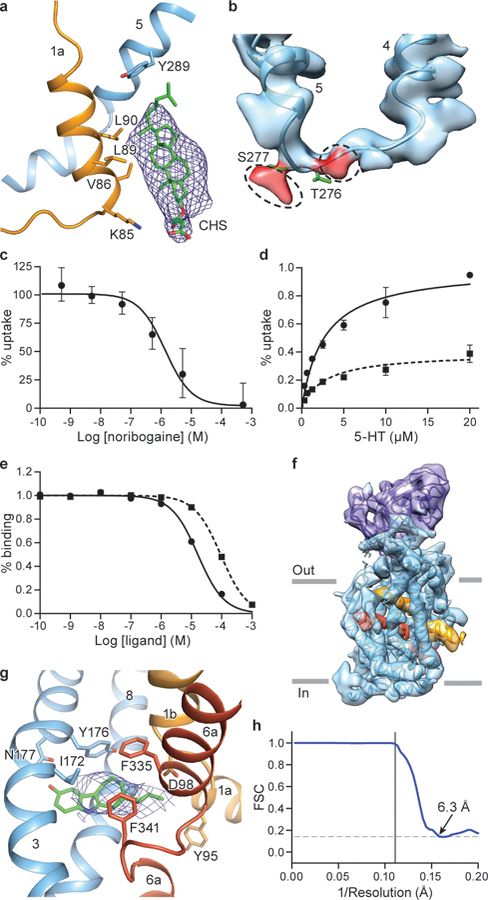
a, Interaction between CHS, TM1a and TM5 in the occluded conformation of the ΔN72,C13 SERT/15B8/ibogaine complex in 100 mM NaCl. b, Non-proteinaceous density features (red) near Thr276 and Ser277. c, Noribogaine inhibition of 5-HT transport for ΔN72,C13 SERT. 5-HT transport was measured using 20 μM [3H]5-HT in presence of the indicated concentrations of noribogaine. The mean IC50 of noribogaine inhibition of serotonin transport was determined from the curve with the error of the fit (s.e.m.): 1.2 ± 0.2 µM. Symbols show the mean derived from n=3 biological replicates. Error bars show the s.e.m. Experiment was performed twice independently with the same results. d, Michaelis–Menten plots of 5-HT uptake for the ΔN72,C13 transporter in the absence (circles), or in presence (dash, squares) of 1 µM noribogaine, the mean Km was determined from the curve with the error of the fit (s.e.m.): ΔN72,C13: 2.7 ± 0.6 µM; in presence of noribogiane: 2.7 ± 0.9 µM. Symbols show the mean derived from n=3 biological replicates. Error bars show the s.e.m. e, Noribogaine (circles) and ibogaine (dash, squares) competition binding with [3H]paroxetine for ΔN72,C13 SERT, Symbols show the mean derived from n=3 technical replicates. Error bars show the s.e.m. f, Density map of the ΔN72,C13 SERT/15B8/noribogaine complex, in 100 mM KCl, fit with the model derived from the inward-open ibogaine-bound SERT complex. SERT is cyan and the 15B8 Fab is purple; TM1 and TM6 of SERT are shown in orange and red, respectively. g, Noribogaine density in the central binding pocket. The fit of noribogaine into the EM density map was derived from ibogaine bound SERT in the inward-open conformation and shown in blue mesh, and residues involved in binding (Tyr176, Asp98, Phe341, Phe335, Asn177, Ile172 and Tyr95) are drawn as sticks. h, FSC curve for noribogaine bound SERT complex. The high-resolution limit cutoff for refinement was 9.0 Å.
Extended Data Figure 7. Ibogaine docking and molecular dynamics simulations.
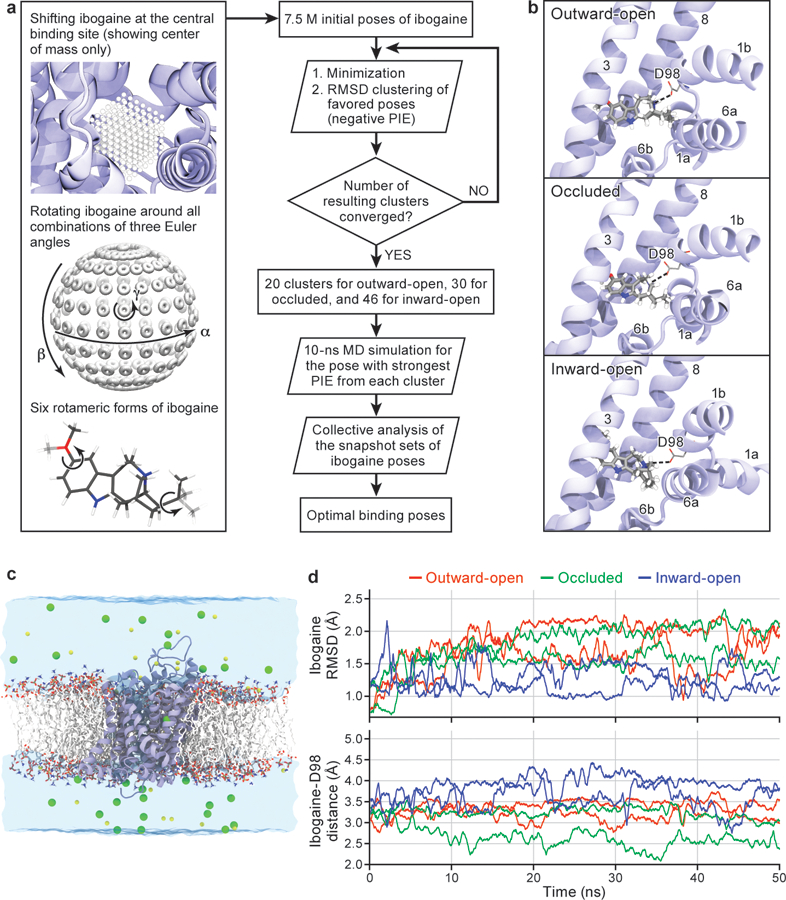
a, Workflow of ligand docking. b, Optimal binding poses of ibogaine in the central binding site of the outward-open, occluded, and inward-open conformations. For clarity, only TM helices surrounding the central binding site, i.e., TM1, TM3, TM6, and TM8, are shown. The interaction between ibogaine and Asp98 of SERT, both shown in sticks, is highlighted. c, Simulation system used to study the structural stability and ibogaine binding of different conformations of SERT (two independent 50 ns simulations for each conformation), showing the transporter in cartoon, with 1-palmitoyl-2-oleoyl-sn-glycero-3-phosphocholine lipids drawn in sticks, bulk water in a transparent surface, and solute ions (100 mM NaCl for the outward-open simulation) in yellow (Na+) and green (Cl−) spheres. d, Structural stability of bound ibogaine measured as the mass-weighted root-mean-square deviation (RMSD, including hydrogen atoms) of the ligand, as well as the Asp98-ibogaine (O-N) distance. The trajectories of outward-open, occluded, and inward-open SERT are plotted in red, green, and blue respectively, and shown for two independent simulations.
Extended Data Figure 8. Measurement of ibogaine and noribogaine inhibition of mutants, effect of thermostabilizing Tyr110Ala mutation, movements of structural elements associated with alternating access mechanism, and alignment of TM5.
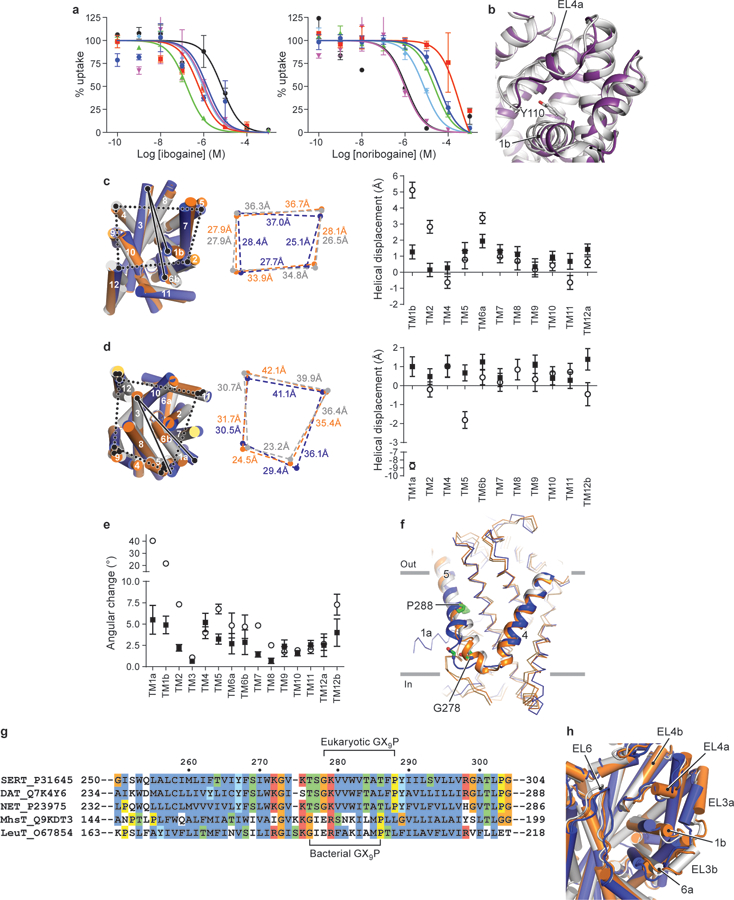
a, Inhibition of serotonin uptake by ibogaine or noribogaine for ts2. The mean IC50 of ibogaine and noribogaine inhibition of serotonin transport was determined from the curve with the error of the fit (s.e.m.) (black circles, ibogaine IC50, 7 ± 2 µM; noribogaine IC50, 1.1 ± 0.7 µM), Asn177Leu (blue circles, 1 ± 1 µM; 40 ± 10 µM), Asn177Val (green triangles, 0.17 ± 0.04 µM; 24 ± 5 µM), Asn177Ala (red squares, 0.6 ± 0.3 µM; 300 ± 200 µM), Asn177Thr (cyan diamonds, 1.0 ± 0.2 µM; 8 ± 2 µM), and Asn177Gln (magenta inverted triangles, 1.1 ± 0.7 µM; 1.0 ± 0.5 µM). Symbols show the mean derived from n=6 and n=3 biological replicates for ibogaine and noribogaine respectively. Error bars show the s.e.m. Experiment was performed three times independently with the same results. b, Comparison of EL4 and TM1b between the x-ray ts3 paroxetine (PDB code: 5I6X, purple)28 structure and the ts2 active ibogaine outward-open cryo-EM structure (grey). Residues Tyr110 (ts2-active) and Ala110 (ts3) are shown in sticks. c, Comparison of the TM helices of the outward-open (grey), occluded (orange), and inward-open (blue) conformations viewed from the extracellular side of the membrane. The positions of TM2, 4, 5, and 12 for each conformation are shown (middle panel). The right panel shows the helical displacement measured from marker positions in each TM to a position in TM3 (Tyr186). Outward-open to occluded conformation (filled circles) and from the occluded to the inward-open conformation (open circles). The TM marker positions are described further in the ‘Methods’ section. Error bars represent the standard deviation, see Measurement section in Methods for further details. d, Comparison of the TM helices viewed from the intracellular side of the membrane. The positions of TM5, 9, 11, and 12 for each conformation are shown (middle panel). The right panel shows the helical displacement measured from marker positions in each TM to a position in TM3 (Gly160). Outward-open to occluded conformation (filled circles) and from the occluded to the inward-open conformation (open circles). Error bars represent the standard deviation. e, Angular changes of TMs associated with transition from the outward-open to the occluded conformation (filled circles) and from the occluded to the inward-open conformation (open circles). Error bars represent the standard deviation. f, The intracellular region of TM5 ‘unwinds’ in the inward-open conformation. Gly278 and Pro288 in the GX9P motif are shown in sticks. g, Alignment of TM5 of SERT, DAT, and NET with LeuT and MhsT. The position of the GX9P motif is indicated. h, Comparison of the extracellular loops 3, 4, and 6 in the outward-open (grey), the occluded (orange), and the inward-open (blue) conformations.
Extended Data Figure 9. Comparison of SERT to bacterial transporters.
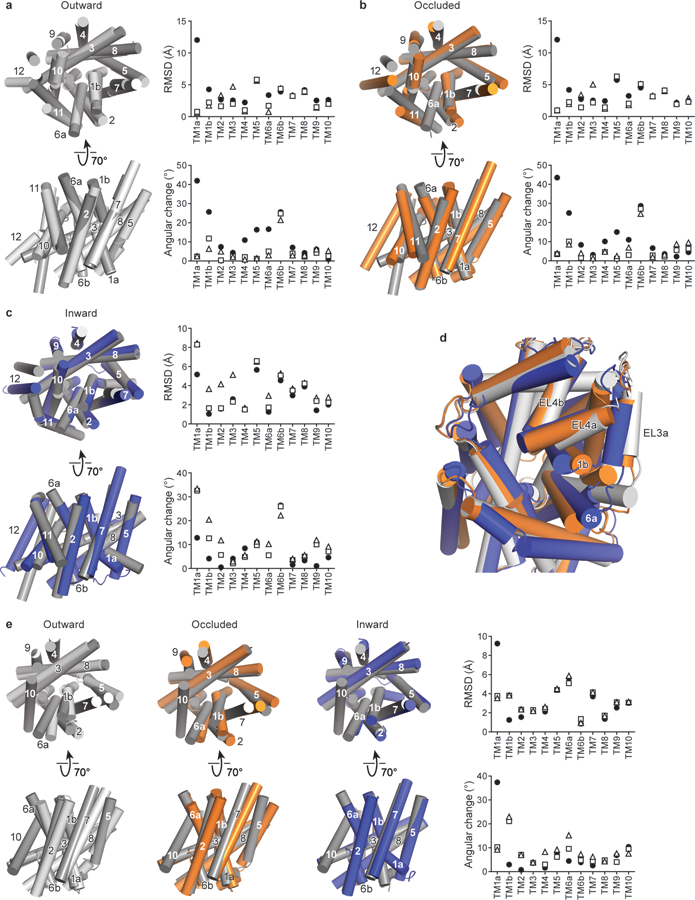
a, Superposition of the ibogaine-bound outward-open conformation (light-grey) with the LeuT outward-open conformation (PDB code: 3F3A, dark grey)79. The graphs depict the RMSD and angular differences between the outward-open conformations of SERT and LeuT (3F3A, open triangles), LeuT outward-occluded (PDB code: 2A65, open squares)11, and LeuT inward-open (PDB code: 3TT3, closed circles)8. b, Superposition of the ibogaine-bound occluded conformation (orange) with LeuT outward-occluded (PDB code: 2A65, dark grey). The graphs compare the occluded conformation of SERT with LeuT conformations as described in a. c, Superposition of the ibogaine-bound inward-open conformation (blue) with LeuT inward-open (PDB code: 3TT3, dark grey). The graphs compare the occluded conformation of SERT to LeuT conformations as described in a. d, Comparison of the extracellular loops of LeuT between outward-open (grey), occluded (orange), and inward-open (blue) conformations. e, Comparison of outward-open (light-grey), occluded (orange), and inward-open (blue) with the inward-occluded conformation of MhsT (PDB code: 4US3, dark grey)7. The graphs compare each conformation of SERT with MhsT as described in a.
Extended Data Figure 10. Sodium and chloride ion-binding sites and putative substrate and ion release pathways.
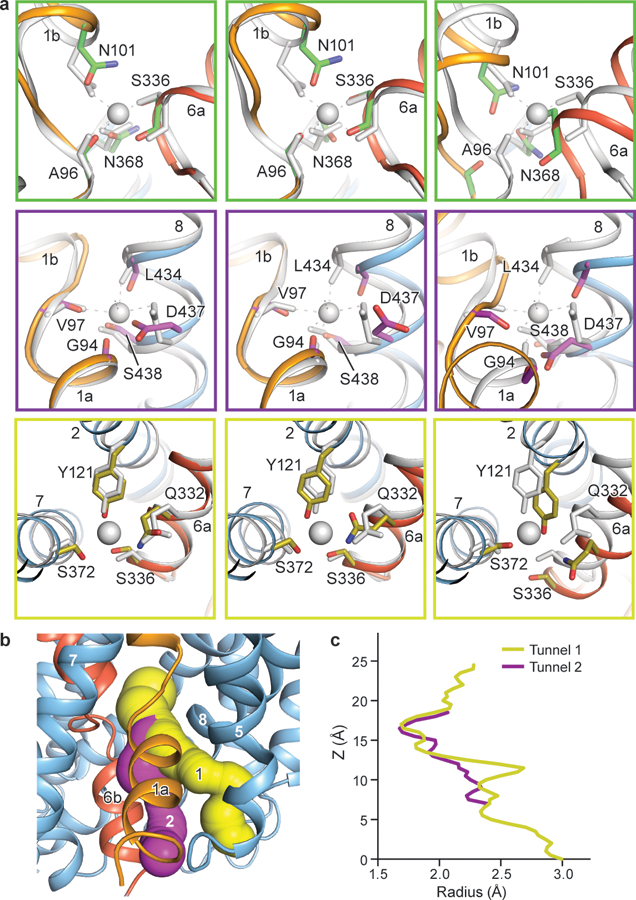
a, Comparison of the Na1 site (green boxes) and the Na2 site (purple boxes), and the Cl− site (olive boxes) with the outward-open S-citalopram and paroxetine x-ray structures of SERT (PDB codes: 5I71 and 5I6X, grey)28. Left panel, outward-open ibogaine conformation; middle panel, occluded conformation; right panel, inward-open conformation. The position of sodium ions found in the x-ray structure are shown in grey. b, Solvent accessible pathways in the inward-open conformation. Pathway 1 leads from the Na2 site to an opening formed between TM1a and TM5. Pathway 2 leads from the central binding site to an opening between TM1a, TM6b, and TM5. c, The minimum radius was plotted as a function of the profile
Supplementary Material
Acknowledgements
We thank the National Institute for Drug Abuse, Drug Supply Program for providing ibogaine and [3H]ibogaine. We thank L. Vaskalis for assistance with figures, H. Owen for help with manuscript preparation, and V. Navratna for helpful discussions. We thank M. Whorton for help with Fab x-ray data collection. Electron microscopy was performed at Oregon Health & Science University (OHSU) at the Multiscale Microscopy Core with technical support from the OHSU-FEI Living Lab and OHSU Center for Spatial Systems Biomedicine. We acknowledge the staff of the Northeastern Collaborative Access Team at the Advanced Photon Source. Simulations have been performed using NSF computing resources allocated through an XSEDE grant TGMCA06N060 to ET, and PRAC allocation (grant ACI1713784 to ET) at Blue Waters of the National Center for Supercomputing Applications at the University of Illinois. We are particularly grateful to Bernard and Jennifer LaCroute for their generous support. This work was funded by the NIH (5R37MH070039 to E.G.; P41GM104601, U54GM087519 and R01GM123455 to E.T.). E.G. is an investigator of the Howard Hughes Medical Institute.
Footnotes
Author information
The data that support the findings of this study are available from the corresponding author upon request. The coordinates for the 15B8 X-ray structure has been deposited in the Protein Data Bank under the accession code 6D9G. The coordinates and associated volumes for the cryo-EM reconstruction of ts2-inactive Fab/scFv paroxetine, ts2-active Fab/scFv ibogaine-outward, ΔN72,C13 Fab ibogaine-occluded, and ΔN72,C13 Fab ibogaine-inward-open data sets have been deposited in the Protein Data Bank (PDB) and Electron Microscopy Data Bank (EMDB) under the accession codes 6DZW and 8941, 6DZY and 8942, 6DZV and 8940, 6DZZ and 8943 respectively. The volume for the cryo-EM reconstruction of the ΔN72,C13 Fab noribogaine inward-open reconstruction has been deposited in the EMDB under accession code 0437. The half-maps and masks used for refinement for each data set have also been deposited in the EMDB.
The authors declare no competing interests.
REFERENCES
- 1.Singh SK & Pal A Biophysical approaches to the study of LeuT, a prokaryotic homolog of neurotransmitter sodium symporters. Methods Enzymol 557, 167–198, (2015). [DOI] [PMC free article] [PubMed] [Google Scholar]
- 2.Kristensen AS et al. SLC6 neurotransmitter transporters: structure, function, and regulation. Pharmacol Rev 63, 585–640, (2011). [DOI] [PubMed] [Google Scholar]
- 3.Gether U, Andersen PH, Larsson OM & Schousboe A Neurotransmitter transporters: molecular function of important drug targets. Trends Pharmacol Sci 27, 375–383, (2006). [DOI] [PubMed] [Google Scholar]
- 4.Cipriani A et al. Comparative efficacy and acceptability of 21 antidepressant drugs for the acute treatment of adults with major depressive disorder: a systematic review and network meta-analysis. Lancet 391, 1357–1366, (2018). [DOI] [PMC free article] [PubMed] [Google Scholar]
- 5.Lin Z & Madras BK Human genetics and pharmacology of neurotransmitter transporters. Handb Exp Pharmacol, 327–371, (2006). [DOI] [PubMed]
- 6.Kazmier K et al. Conformational dynamics of ligand-dependent alternating access in LeuT. Nat Struct Mol Biol 21, 472–479, (2014). [DOI] [PMC free article] [PubMed] [Google Scholar]
- 7.Malinauskaite L et al. A mechanism for intracellular release of Na+ by neurotransmitter/sodium symporters. Nat Struct Mol Biol 21, 1006–1012, (2014). [DOI] [PMC free article] [PubMed] [Google Scholar]
- 8.Krishnamurthy H & Gouaux E X-ray structures of LeuT in substrate-free outward-open and apo inward-open states. Nature 481, 469–474, (2012). [DOI] [PMC free article] [PubMed] [Google Scholar]
- 9.Merkle PS et al. Substrate-modulated unwinding of transmembrane helices in the NSS transporter LeuT. Sci Adv 4, eaar6179, (2018). [DOI] [PMC free article] [PubMed] [Google Scholar]
- 10.Grouleff J, Sondergaard S, Koldso H & Schiott B Properties of an inward-facing state of LeuT: conformational stability and substrate release. Biophys J 108, 1390–1399, (2015). [DOI] [PMC free article] [PubMed] [Google Scholar]
- 11.Yamashita A, Singh SK, Kawate T, Jin Y & Gouaux E Crystal structure of a bacterial homologue of Na+/Cl--dependent neurotransmitter transporters. Nature 437, 215–223, (2005). [DOI] [PubMed] [Google Scholar]
- 12.Terry DS et al. A partially-open inward-facing intermediate conformation of LeuT is associated with Na(+) release and substrate transport. Nat Commun 9, 230, (2018). [DOI] [PMC free article] [PubMed] [Google Scholar]
- 13.Belgers M et al. Ibogaine and addiction in the animal model, a systematic review and meta-analysis. Transl Psychiatry 6, e826, (2016). [DOI] [PMC free article] [PubMed] [Google Scholar]
- 14.Dybowski JL, E. PLANT CHEMISTRY. Concerning Iboga, its excitement-producing properties, its composition, and the new alkaloid it contains, ibogaine. C. R. Acad. Sci 133, 748, (1901). [Google Scholar]
- 15.Bulling S et al. The mechanistic basis for noncompetitive ibogaine inhibition of serotonin and dopamine transporters. J Biol Chem 287, 18524–18534, (2012). [DOI] [PMC free article] [PubMed] [Google Scholar]
- 16.Jacobs MT, Zhang YW, Campbell SD & Rudnick G Ibogaine, a noncompetitive inhibitor of serotonin transport, acts by stabilizing the cytoplasm-facing state of the transporter. J Biol Chem 282, 29441–29447, (2007). [DOI] [PubMed] [Google Scholar]
- 17.Wu S et al. Fabs enable single particle cryoEM studies of small proteins. Structure 20, 582–592, (2012). [DOI] [PMC free article] [PubMed] [Google Scholar]
- 18.Coleman JA & Gouaux E Structural basis for recognition of diverse antidepressants by the human serotonin transporter. Nat Struct Mol Biol 25, 170–175, (2018). [DOI] [PMC free article] [PubMed] [Google Scholar]
- 19.Zhang YW & Rudnick G The cytoplasmic substrate permeation pathway of serotonin transporter. J Biol Chem 281, 36213–36220, (2006). [DOI] [PubMed] [Google Scholar]
- 20.Burtscher V, Hotka M, Li Y, Freissmuth M & Sandtner W A label-free approach to detect ligand binding to cell surface proteins in real time. Elife 7, (2018). [DOI] [PMC free article] [PubMed] [Google Scholar]
- 21.Tavoulari S, Forrest LR & Rudnick G Fluoxetine (Prozac) binding to serotonin transporter is modulated by chloride and conformational changes. J Neurosci 29, 9635–9643, (2009). [DOI] [PMC free article] [PubMed] [Google Scholar]
- 22.Ramamoorthy S, Samuvel DJ, Buck ER, Rudnick G & Jayanthi LD Phosphorylation of threonine residue 276 is required for acute regulation of serotonin transporter by cyclic GMP. J Biol Chem 282, 11639–11647, (2007). [DOI] [PubMed] [Google Scholar]
- 23.Zhang YW, Turk BE & Rudnick G Control of serotonin transporter phosphorylation by conformational state. Proc Natl Acad Sci U S A 113, E2776–2783, (2016). [DOI] [PMC free article] [PubMed] [Google Scholar]
- 24.Penmatsa A, Wang KH & Gouaux E X-ray structure of dopamine transporter elucidates antidepressant mechanism. Nature 503, 85–90, (2013). [DOI] [PMC free article] [PubMed] [Google Scholar]
- 25.Wang KH, Penmatsa A & Gouaux E Neurotransmitter and psychostimulant recognition by the dopamine transporter. Nature 521, 322–327, (2015). [DOI] [PMC free article] [PubMed] [Google Scholar]
- 26.Laursen L et al. Cholesterol binding to a conserved site modulates the conformation, pharmacology, and transport kinetics of the human serotonin transporter. J Biol Chem 293, 3510–3523, (2018). [DOI] [PMC free article] [PubMed] [Google Scholar]
- 27.Mash DC, Staley JK, Baumann MH, Rothman RB & Hearn WL Identification of a primary metabolite of ibogaine that targets serotonin transporters and elevates serotonin. Life Sci 57, PL45–50, (1995). [DOI] [PubMed] [Google Scholar]
- 28.Coleman JA, Green EM & Gouaux E X-ray structures and mechanism of the human serotonin transporter. Nature 532, 334–339, (2016). [DOI] [PMC free article] [PubMed] [Google Scholar]
- 29.Chen F et al. Characterization of an allosteric citalopram-binding site at the serotonin transporter. J Neurochem 92, 21–28, (2005). [DOI] [PubMed] [Google Scholar]
- 30.Navratna V, Tosh DK, Jacobson KA & Gouaux E Thermostabilization and purification of the human dopamine transporter (hDAT) in an inhibitor and allosteric ligand bound conformation. PLoS One 13, e0200085, (2018). [DOI] [PMC free article] [PubMed] [Google Scholar]
- 31.Hasenhuetl PS, Freissmuth M & Sandtner W Electrogenic Binding of Intracellular Cations Defines a Kinetic Decision Point in the Transport Cycle of the Human Serotonin Transporter. J Biol Chem 291, 25864–25876, (2016). [DOI] [PMC free article] [PubMed] [Google Scholar]
- 32.Felts B et al. The two Na+ sites in the human serotonin transporter play distinct roles in the ion coupling and electrogenicity of transport. J Biol Chem 289, 1825–1840, (2014). [DOI] [PMC free article] [PubMed] [Google Scholar]
- 33.Blat Y Non-competitive inhibition by active site binders. Chem Biol Drug Des 75, 535–540, (2010). [DOI] [PubMed] [Google Scholar]
- 34.Coleman JA, Green EM & Gouaux E Thermostabilization, expression, purification, and crystallization of the human serotonin transporter bound to s-citalopram. J Vis Exp, (2016). [DOI] [PMC free article] [PubMed]
- 35.Green EM, Coleman JA & Gouaux E Thermostabilization of the human serotonin transporter in an antidepressant-bound conformation. PLoS One 10, e0145688, (2015). [DOI] [PMC free article] [PubMed] [Google Scholar]
- 36.Goehring A et al. Screening and large-scale expression of membrane proteins in mammalian cells for structural studies. Nat Protoc 9, 2574–2585, (2014). [DOI] [PMC free article] [PubMed] [Google Scholar]
- 37.Mastronarde DN Automated electron microscope tomography using robust prediction of specimen movements. J Struct Biol 152, 36–51, (2005). [DOI] [PubMed] [Google Scholar]
- 38.Zheng SQ et al. MotionCor2: anisotropic correction of beam-induced motion for improved cryo-electron microscopy. Nat Methods 14, 331–332, (2017). [DOI] [PMC free article] [PubMed] [Google Scholar]
- 39.Zhang K Gctf: Real-time CTF determination and correction. J Struct Biol 193, 1–12, (2016). [DOI] [PMC free article] [PubMed] [Google Scholar]
- 40.Voss NR, Yoshioka CK, Radermacher M, Potter CS & Carragher B DoG Picker and TiltPicker: software tools to facilitate particle selection in single particle electron microscopy. J Struct Biol 166, 205–213, (2009). [DOI] [PMC free article] [PubMed] [Google Scholar]
- 41.Scheres SH RELION: implementation of a Bayesian approach to cryo-EM structure determination. J Struct Biol 180, 519–530, (2012). [DOI] [PMC free article] [PubMed] [Google Scholar]
- 42.Punjani A, Rubinstein JL, Fleet DJ & Brubaker MA cryoSPARC: algorithms for rapid unsupervised cryo-EM structure determination. Nat Methods 14, 290–296, (2017). [DOI] [PubMed] [Google Scholar]
- 43.Grant T, Rohou A & Grigorieff N cisTEM, user-friendly software for single-particle image processing. Elife 7, (2018). [DOI] [PMC free article] [PubMed] [Google Scholar]
- 44.Zhang C et al. Analysis of discrete local variability and structural covariance in macromolecular assemblies using Cryo-EM and focused classification. Ultramicroscopy, (2018). [DOI] [PMC free article] [PubMed]
- 45.Rosenthal PB & Henderson R Optimal determination of particle orientation, absolute hand, and contrast loss in single-particle electron cryomicroscopy. J Mol Biol 333, 721–745, (2003). [DOI] [PubMed] [Google Scholar]
- 46.Adams PD et al. PHENIX: a comprehensive Python-based system for macromolecular structure solution. Acta Crystallogr D Biol Crystallogr 66, 213–221, (2010). [DOI] [PMC free article] [PubMed] [Google Scholar]
- 47.Pettersen EF et al. UCSF Chimera--a visualization system for exploratory research and analysis. J Comput Chem 25, 1605–1612, (2004). [DOI] [PubMed] [Google Scholar]
- 48.Wang RY et al. Automated structure refinement of macromolecular assemblies from cryo-EM maps using Rosetta. Elife 5, (2016). [DOI] [PMC free article] [PubMed] [Google Scholar]
- 49.Emsley P & Cowtan K Coot: model-building tools for molecular graphics. Acta Crystallogr D Biol Crystallogr 60, 2126–2132, (2004). [DOI] [PubMed] [Google Scholar]
- 50.Chen VB et al. MolProbity: all-atom structure validation for macromolecular crystallography. Acta Crystallogr D Biol Crystallogr 66, 12–21, (2010). [DOI] [PMC free article] [PubMed] [Google Scholar]
- 51.The PyMOL molecular graphics system, Version 2.0 Schrödinger, LLC.
- 52.Chovancova E et al. CAVER 3.0: a tool for the analysis of transport pathways in dynamic protein structures. PLoS Comput Biol 8, e1002708, (2012). [DOI] [PMC free article] [PubMed] [Google Scholar]
- 53.Afonine PV et al. New tools for the analysis and validation of cryo-EM maps and atomic models. Acta Crystallogr D Struct Biol 74, 814–840, (2018). [DOI] [PMC free article] [PubMed] [Google Scholar]
- 54.Humphrey W, Dalke A & Schulten K VMD: visual molecular dynamics. J Mol Graph 14, 33–38, 27–38, (1996). [DOI] [PubMed] [Google Scholar]
- 55.Schreiner E, Trabuco LG, Freddolino PL & Schulten K Stereochemical errors and their implications for molecular dynamics simulations. BMC Bioinformatics 12, 190, (2011). [DOI] [PMC free article] [PubMed] [Google Scholar]
- 56.Olsson MH, Sondergaard CR, Rostkowski M & Jensen JH PROPKA3: consistent treatment of internal and surface residues in empirical pKa predictions. J Chem Theory Comput 7, 525–537, (2011). [DOI] [PubMed] [Google Scholar]
- 57.Lomize MA, Pogozheva ID, Joo H, Mosberg HI & Lomize AL OPM database and PPM web server: resources for positioning of proteins in membranes. Nucleic Acids Res 40, D370–376, (2012). [DOI] [PMC free article] [PubMed] [Google Scholar]
- 58.Vanommeslaeghe K et al. CHARMM general force field: A force field for drug-like molecules compatible with the CHARMM all-atom additive biological force fields. J Comput Chem 31, 671–690, (2010). [DOI] [PMC free article] [PubMed] [Google Scholar]
- 59.Vanommeslaeghe K, Raman EP & MacKerell AD Jr. Automation of the CHARMM General Force Field (CGenFF) II: assignment of bonded parameters and partial atomic charges. J Chem Inf Model 52, 3155–3168, (2012). [DOI] [PMC free article] [PubMed] [Google Scholar]
- 60.Mayne CG, Saam J, Schulten K, Tajkhorshid E & Gumbart JC Rapid parameterization of small molecules using the Force Field Toolkit. J Comput Chem 34, 2757–2770, (2013). [DOI] [PMC free article] [PubMed] [Google Scholar]
- 61.Vanommeslaeghe K & MacKerell AD Jr. Automation of the CHARMM General Force Field (CGenFF) I: bond perception and atom typing. J Chem Inf Model 52, 3144–3154, (2012). [DOI] [PMC free article] [PubMed] [Google Scholar]
- 62.Gaussian 09, Revision A.02 (Gaussian, Inc., 2016).
- 63.Phillips JC et al. Scalable molecular dynamics with NAMD. J Comput Chem 26, 1781–1802, (2005). [DOI] [PMC free article] [PubMed] [Google Scholar]
- 64.Beauchamp KA et al. MSMBuilder2: modeling conformational dynamics at the picosecond to millisecond scale. J Chem Theory Comput 7, 3412–3419, (2011). [DOI] [PMC free article] [PubMed] [Google Scholar]
- 65.Gumbart J, Trabuco LG, Schreiner E, Villa E & Schulten K Regulation of the protein-conducting channel by a bound ribosome. Structure 17, 1453–1464, (2009). [DOI] [PMC free article] [PubMed] [Google Scholar]
- 66.Jo S, Kim T, Iyer VG & Im W CHARMM-GUI: a web-based graphical user interface for CHARMM. J Comput Chem 29, 1859–1865, (2008). [DOI] [PubMed] [Google Scholar]
- 67.Huang J et al. CHARMM36m: an improved force field for folded and intrinsically disordered proteins. Nat Methods 14, 71–73, (2017). [DOI] [PMC free article] [PubMed] [Google Scholar]
- 68.Klauda JB et al. Update of the CHARMM all-atom additive force field for lipids: validation on six lipid types. J Phys Chem B 114, 7830–7843, (2010). [DOI] [PMC free article] [PubMed] [Google Scholar]
- 69.Jorgensen WL, Chandrasekhar J, Madura JD, Impey RW & Klein ML Comparison of simple potential functions for simulating liquid water 79, 926–935, (1983). [Google Scholar]
- 70.Feller SE, Zhang Y, Pastor RW & Brooks BR Constant pressure molecular dynamics simulation: The Langevin piston method 103, 4613–4621, (1995). [Google Scholar]
- 71.Martyna GJ, Tobias DJ & Klein ML Constant pressure molecular dynamics algorithms 101, 4177–4189, (1994). [Google Scholar]
- 72.Darden T, York D & Pedersen L Particle mesh Ewald: An N⋅log(N) method for Ewald sums in large systems 98, 10089–10092, (1993). [Google Scholar]
- 73.Ryckaert J-P, Ciccotti G & Berendsen HJC Numerical integration of the cartesian equations of motion of a system with constraints: molecular dynamics of n-alkanes. Journal of Computational Physics 23, 327–341, (1977). [Google Scholar]
- 74.Gowers R et al. MDAnalysis: a python package for the rapid analysis of molecular dynamics simulations (2016).
- 75.Michaud-Agrawal N, Denning EJ, Woolf TB & Beckstein O MDAnalysis: a toolkit for the analysis of molecular dynamics simulations. J Comput Chem 32, 2319–2327, (2011). [DOI] [PMC free article] [PubMed] [Google Scholar]
- 76.Trabuco LG, Villa E, Mitra K, Frank J & Schulten K Flexible fitting of atomic structures into electron microscopy maps using molecular dynamics. Structure 16, 673–683, (2008). [DOI] [PMC free article] [PubMed] [Google Scholar]
- 77.Bayburt TH & Sligar SG Membrane protein assembly into nanodiscs. FEBS Lett 584, 1721–1727, (2010). [DOI] [PMC free article] [PubMed] [Google Scholar]
- 78.Cheng Y & Prusoff WH Relationship between the inhibition constant (K1) and the concentration of inhibitor which causes 50 per cent inhibition (I50) of an enzymatic reaction. Biochem Pharmacol 22, 3099–3108, (1973). [DOI] [PubMed] [Google Scholar]
- 79.Singh SK, Piscitelli CL, Yamashita A & Gouaux E A competitive inhibitor traps LeuT in an open-to-out conformation. Science 322, 1655–1661, (2008). [DOI] [PMC free article] [PubMed] [Google Scholar]
Associated Data
This section collects any data citations, data availability statements, or supplementary materials included in this article.


