

Abstract
Objective:
Alterations of the oral microbiome have been associated with obesity, possibly based on inflammatory processes mediated by bacteria. Specific bacterial strains have been associated with obesity and periodontal disease. Little is known about the oral microbiome in children. Understanding the relationship between oral health and childhood growth could help identify preventable factors contributing to obesity and related conditions, including onset of menarche which is associated with obesity.
Methods:
In this pilot study, we investigated the saliva microbiome among 25 girls 7–15 years old (mean 11.1) and their mothers in an inner city dental clinic in New York City. The main outcome measures were body size, presence or absence of menarche and dental practices. We examined associations of microbiome richness, diversity, and relative abundance with pubertal and demographic factors and oral health.
Results:
Girls had good dental health and a typical rich oral microbiome, based on the Shannon Index of all species detected. Older girls flossed more often and younger girls had more frequent dental check–ups. Microbiome richness among girls was similar to their mothers’, but diversity was greater among mothers than girls. Richness was reduced among mothers with gum bleeding, flossing and increased teeth brushing. Overweight girls had greater diversity and less richness than normal weight girls. Certain bacterial species differed in abundance with respect to whether girls had reached menarche (Flavobacteria, Actinobacteria), overweight (Megasphaera, Lactorbacillales, Lactobacillus) and gingivitis in the girls (Scardovia, Bifidobacteriales, Gemellaceae).
Conclusions:
Differences found in specific bacteria in the oral microbiome were related to body size and menarche. With increasing interest on studying microbiome variability related to the multifactorial etiology of obesity in children, saliva is capable of providing clinically informative markers of this and related conditions.
Keywords: Oral microbiome, Diversity, Richness, Dental health, Puberty, Obesity
Introduction
Increasing evidence supports associations of the oral microbiome with several human health conditions, such as cardiovascular diseases [1] and obesity [2–4]. Specific bacteria and low overall diversity of oral microbial organisms have been linked to common oral diseases, dental caries and periodontal disease [5]. It is thought that the microbiome may act through inflammation and immune response, as both conditions are related to obesity as well as dental disorders of periodontitis, caries, and plaque [6,7]. Several studies in both animals and humans have found differences of important bacterial species in the gut microbiota between obese and normal weight children and adults [8–10]. For the oral microbiome, less is known about its relationship with obesity, although specific bacteria have also been found to vary with obesity in both adolescents and adults [4,11]. The composition of the oral microbiome is affected by the endogenous hormone milieu [12]; after the onset of puberty there appears to be a shift in the composition and abundance of certain bacteria of the oral microbiome including black pigmented bacteroides, especially B. intermedius [13,14] Obesity is a major risk factor for early puberty [15], yet the relationship among obesity, puberty and oral microbiome abundance and diversity remains unclear.
Imbalance of the gut microbiota has been suggested as an important component in the pathogenesis of obesity [8–10]. Thus, body mass index (BMI) differed significantly with respect to the proportion of Campylobacter rectus and Neisseria mucosa, Tannerella forsythia in the subgingival biofilm with greater proportions among obese than normal weight adults and adolescents [4,10,11,16].
Differences are mostly detected at the phylum level, particularly firmicutes and bacteriodes. Variations at the genus level have been less informative [17]. Given these identified associations of obesity with gut microbiome, and the inflammatory changes in the oral cavity seen in obesity, it may be useful to investigate the dominant bacterial phyla (i.e., firmicutes, bacteriodes) of the mouth, as the saliva microbiome is easily accessible.
Based on these lines of evidence, we hypothesized that oral microbiota in adolescent girls would vary in diversity and richness by age at menarche and body size. We undertook an exploratory study in an inner city dental clinic to investigate oral microbiome variability in girls and their mothers. The focus on girls was motivated by our ongoing research on environment exposures and girls’ pubertal development.
Materials and Methods
Study population
Potential study participants were identified at the Dental Clinic at the Mount Sinai Hospital Department of Dentistry. Initial contact was by telephone or in the waiting room on the day of their dental appointment. The project was approved by the Institutional Review Board of the Icahn School of Medicine at Mount Sinai. Guardians provided informed consent and verified child assent. Girls and their female guardian were recruited as study participants.
We recruited mothers because family members are known to share microbiota, and in particular the mother is the primary source of her children’s oral microbial profile [18–20]. To be eligible for participation, girls had to be between 10 and 17 years of age, have a parent accompany them at the dental visit and have no medical conditions that would affect their dental health or immune system (e.g., cancer).
We identified 74 potentially eligible girls and after initial screening, 6 were found to be ineligible, 34 did not show up for their appointment, and 9 were not interested in participating.
The final study population included 25 eligible girls and 25 guardians; four girls were accompanied by either their father (n=2) or their female legal guardian (n=2) who was not the biological mother while the remaining 21 girls were accompanied by their biological mother. Interviews were conducted in person in either English or Spanish with girls (n=25) and their female guardians (n=23). Height and weight were measured for both girls and their biological mothers using calibrated scales and stadiometers using a standard protocol for children as described previously [15].
Questionnaire and anthropometrics
The female guardian and all girls completed a brief questionnaire to ascertain demographics, dental practices and dental health, including presence of gum disease, bleeding when brushing and the presence of menarche and certain medical conditions. Guardians identified the girls as black, white, Asian, Hispanic or other. Socioeconomic status was represented by the highest attained education level of the primary caregiver (≤high school diploma vs. some college or greater). Girls were asked whether they had had their first menstrual period. BMI was calculated as weight in kg/height (in cm)-squared; girls were classified as normal weight (<85th national percentile, age- and sex-specific) or overweight (≥ 85th percentile) based on CDC growth charts [21].
Dental exam
Dental health and habits were assessed using standardized questions [22]. An abbreviated dental exam was performed on girls by a dentist in the clinic using a dental probe and mouth mirror. The exam consisted of counting the number of decayed, missing and filled permanent teeth in a child’s mouth (DMFT index), and an assessment of gingival health in accordance with the World Health Organization recommendations (www.who.int/oral_health/publications/en/). Caries and existing restorations were cross-checked after the exam with bitewing and panoramic radiography from their Mount Sinai Clinic dental record. Missing teeth due to caries were assigned when clinic records indicated removal and congenitally missing teeth were excluded from the count. For statistical analysis, gingival inflammation was categorized as healthy, gingivitis, or periodontal disease by visual examination. Gingival status of guardians was self-reported.
Saliva microbiome profiling
The oral microbiome analyses were restricted to girls (n=25) and their biological mothers (n=21). A saliva sample (~2 mL) was collected before the dental exam using the OMNIgene•DISCOVER saliva sample collection kit (DNA Genotek Inc., Canada) following manufacturer’s instruction. Samples and microbial DNA from this kit are stable for long-term room temperature storage. Total microbial DNA from saliva was extracted using Qiagen blood mini kit (Qiagen, Germantown, MD, USA) and stored at −20°C.
We characterized the oral microbiome by standard taxonomic classification criteria using 16S rRNA gene sequences to group “species-level” phylotypes and to further classify bacteria within phylum-to-genus levels. We conducted 16s sequencing of extracted microbial DNA on 2 × 250 pair-end MiSeq sequencing platform. Phylogenetically informative v3-v4 regions of bacterial 16S ribosomal RNA (rRNA) genes were amplified using universal primer 347F/803R from 46 saliva DNA samples (25 girls and 21 biological mothers).
The PCR amplicons contain a unique dual 6-mer barcode combination attached on the 5’ends of both forward and reverse PCR primers for each sample. The primers were synthesized by IDT (Integrate DNA technology, IA); sequences are provided in Table 1.
Table 1.
Demographics and anthropometric characteristics of participants in dental pilot MSSM 2013.
| Characteristic | Girl (n=25) | Mother (n=23)* |
|---|---|---|
| Mean ± sd or N (%) | Mean ± sd or N (%) | |
| Age (yrs) | 11.1 ± 1.9 | 39.2 ± 8.1 |
| Range | 7–15 | 28–63 |
| Race | ||
| Hispanic | 17 (68%) | 17 (74%) |
| Black | 5 (20%) | 4 (19%) |
| Other | 3 (12%) | 2 (10%) |
| Parental Education | ||
| >High school | -- | 16 (70%) |
| Weight (kgs) | n=24 | n=19 |
| 50.0 ± 19.5 | 77.0 ± 16.0 | |
| Height (cm) | 151.5 ±12.9 | 161.1 ± 8.8 |
| aChild BMI% | ||
| Normal (50–85%) | 10 (53%) | -- |
| Overweight (85–95%) | 3 (16%) | -- |
| Obese (>95%) | 6 (32%) | -- |
| aMaternal BMI | ||
| Normal (18.5–24.9) | -- | 3 (17%) |
| Overweight (25–29.9) | -- | 7 (39%) |
| Obese (>30) | -- | 8 (44%) |
| Girl’s Menarche | n=23 | -- |
| Yes | 8 (35%) | -- |
| No | 15 (65%) | |
Note: BMI% is the standard measure used in children and is age-sex specific (CDC 2000); BMI is used in adults.
25 guardians: Information on 23 mothers; there is no information on 2 fathers who accompanied daughters.
The amplicons were pooled with equal molarity and submitted for Illumina Miseq 2 × 300 pair-end sequencing at high depth. The paired sequence readings were merged and filtered by size (>400 bp) and quality score (>Q30) using CLC genomics workbench version 6. The processed readings were further split by dual barcode for each sample and assigned taxonomic classification using QIIME pipeline 1.7.0 [22]. Triplicate measurements of two samples and duplicate measurements of one sample were made to verify the sequencing reproducibility. The 16S sequencing yielded 7,818,631 merged pair-end reads, of which 5,398,842 passed standard size and quality requirements.
After sorting the final readings to obtain 46 individual results, we obtained on average 63,235 reads (range, 659 to 143,605) per sample. We further assigned taxonomic classification to the filtered sequence reads and determined the saliva microbiome composition. After processing, QIIME provided OTU tables containing the microbiome composition and abundance for each individual sample.
Data analysis
Our approach was to first characterize the oral microbiome of the overall population and then compare mothers to daughters. Then we used similar approaches to assess differences between normal weight and overweight girls, our main outcome, as well as other characteristics. Several approaches were used to characterize the oral microbiome.
Two of the measures used to compare the oral microbiome between individuals are richness and diversity. Richness quantifies how many different types of species are detected in a sample (person), but does not account for abundance. We measured richness of the bacterial community, also called genus alpha-diversity, within each saliva sample, using the Shannon Index [23,24].
Diversity of microbes within a given sample (person) can be defined as the number and the abundance of distinct types of organisms. We summarized the relative abundance of the saliva oral microbiome by genus and species in all subjects combined. Student’s t-test was used to assess differences in the Shannon Index by various characteristics and for the firmicutes-to-bacteriodetes ratio by normal and overweight status. Next, the beta-diversity, which is the overall structural difference between individual microbiomes at the genus level, was assessed using the weighted Unifrac distance matrices, a phylogeny-based distance metric ranging from 0 (identical bacterial communities) to 1 (totally different) that was visualized by non-metric multiple dimensional scaling (nMDS) method.
Smaller distances indicate a higher degree of similarity among taxa and their relative abundances. The PerMANOVA test [25,26] with the maximum number of permutations=999, was performed using the [Adonis] function of the R package vegan 2.0–5 [27] to test how the beta-diversity varied by different characteristics including race, BMI, menarcheal status, dental practices (flossing, brushing), DMFT index (none vs. 1+) and gingival status.
We used the linear discriminant analysis effect size (LEfSe) method [28] to compare the microbiome composition and abundance at various taxonomic ranks from phylum to genus. Finally taxa features that differed by characteristics were selected using the random forest algorithm in Rpackage rfPermute and were confirmed by Boruta feature selection (R package Boruta).
We considered comparisons with p<0.05 to be significant and those where 0.05 ≤ p<0.1 to have borderline significance, so that potentially with more subjects the association would approach significance.
Results
Population characteristics
We obtained demographic and dental information on 23 female mothers or guardians (21 biologic and 2 female guardians) and daughters in this pilot study, including 21 biological mother/daughter pairs. The mean age of the girls was 11.1 (SD 1.9) years and 39.2 (SD 8.1) years for mothers (Table 1).
Most participants were Hispanic (71%), while 19% were Black and 10% reported another race. More than 70% of parents had at least a high school education. Girls received good dental care, as almost all children (96%) reported going to the dentist at least once a year, and 76% went twice a year for preventive visits (Tables 2 and 3).
Table 2.
Dental health indicators by demographic characteristics, MSSM dental study, 2013 (Daughters).
| Daughters | |||||||||
|---|---|---|---|---|---|---|---|---|---|
| Dental Indicators | N | Age (yrs) | BMI%-ile | RACE | Menarche | ||||
| Hispanic | Black | Other | Yes | No | |||||
| Mean (std) | Median (IQR) | Proportion (N) | Proportion (N) | ||||||
| Brushing teeth | 1/day | 9 | 10.9 (1.5) | 93.2 (31.2–97.8) | 0.67 (6) | 0.33 (3) | 0.00 (0) | 0.44 (4) | 0.44 (4) |
| >1/day | 16 | 11.3 (2.1) | 76.5 (73.6–88.7) | 0.69 (11) | 0.13 (2) | 0.19 (3) | 0.25 (4) 0.69 (11) | ||
| Flossing | Never | 12 | 10.2 (1.5)* | 76.4 (31.2–88.7) | 0.67 (8) | 0.17 (2) | 0.17 (2) | 0.17 (2) | 0.67 (8) |
| Ever | 13 | 12.0 (1.8) | 87.6 (75.9–97.6) | 0.69 (9) | 0.23 (3) | 0.08 (1) | 0.46 (6) | 0.54 (7) | |
| Dental Checkups | ≤1/year | 6 | 12.3 (1.9)** | 96.9 (75.9–97.6) | 0.50 (3) | 0.33 (2) | 0.17 (1) | 0.67 (4) | 0.33 (2) |
| >1/year | 19 | 10.7 (1.8) | 76.5 (41.2–88.7) | 0.70 (14) | 0.16 (3) | 0.11 (2) | 0.21 (4) 0.68 (13) | ||
| DMFTa | None | 7 | 11.7 (2.1) | 91.3 (76.5–97.6) | 1.00 (7) | 0.00 (0) | 0.00 (0) | 0.43 (3) | 0.43 (3) |
| 1+ | 18 | 10.9 (1.8) | 76.4 (36.0 −88.8) | 0.56 (10) | 0.28 (5) | 0.17 (3)** | 0.28 (5) 0.67 (12) | ||
| Gums bleed | No | 20 | 11.3 (2.1) | 83.4 (35.9–96.3) | 0.63 (12) | 0.26 (5) | 0.11 (2) | 0.37 (7) | 0.53 (10) |
| Yes | 5 | 11.0 (1.0) | 87.0 (58.8–98.0) | 0.80 (4) | 0.00 (0) | 0.20 (1) | 0.20 (1) | 0.80 (4) | |
| Gingival Status | Healthy | 12 | 11.1 (1.7) | 76.5 (35.9–97.8) | 0.67 (8) | 0.17 (2) | 0.17 (2) | 0.33 (4) | 0.50 (6) |
| Gingivitis | 12 | 11.2 (2.2) | 84.9 (58–6-92.5) | 0.67 (8) | 0.25 (3) | 0.08 (1) | 0.33 (4) | 0.67 (8) | |
Table 3.
Dental health indicators by demographic characteristics, MSSM dental study, 2013 (Mothers).
| Mothers | |||||||
|---|---|---|---|---|---|---|---|
| BMI | Race | ||||||
| Dental Indicators | N | Age (yrs) Mean (std) | Median (IQR) | Hispanic | Black | Other | |
| Mothers Over all | 23 | 39.2 (8.1) | 29.1 (27.4–31.4) | 0.68 (17) | 0.16 (4) | 0.09 (2) | |
| Brush Teeth | 1/day | 1 | 38 | 28.7 | 1.00 (1) | 0.00 (0) | 0.00 (0) |
| >1/day | 22 | 39.2 (8.3) | 29.4 (27.4–31.4) | 0.73 (16) | 0.18 (4) | 0.09 (2) | |
| Flossing | Never | 9 | 37.9 (8.8) | 28.7 (23.4–31.4) | 0.78 (7) | 0.11 (1) | 0.11 (1) |
| Ever | 14 | 40.0 (7.9) | 29.4 (27.8–31.4) | 0.71 (10) | 0.21 (3) | 0.07 (1) | |
| Dental Checkups | Never | 7 | 35.1 (4.5) | 28.8 (28.0–29.4) | 0.86 (6) | 0.14(1) | 0.00 (0) |
| ≤1/year | 7 | 42.1 (6.6) | 32.4 (28.2–35.2) | 0.67 (6) | 0.22 (2) | 0.11 (1) | |
| >1/year | 9 | 39.4 (11.5) | 27.4 (24.6–30.9) | 0.71 (5) | 0.14 (1) | 0.14(1) | |
| Gums Bleed | No | 19 | 39.2 (8.7) | 28.8 (27.4–31.4) | 0.68 (13) | 0.21 (4) | 0.11 (2) |
| Yes | 4 | 39.0 (4.9) | 31.4 (24.6–33.3) | 1.00 (4) | 0.00 (0) | 0.00 (0) | |
| Dx Gum Disease | No | 21 | 39.4 (8.4) | 29.7 (27.6–32.4) | 0.71 (15) | 0.19 (0) | 0.10(2) |
| Yes | 2 | 37.0 (5.7) | 27.0 (24.7–29.4) | 1.00 (2) | 0.00 (0) | 0.00 (0) | |
Note: DMFT is the number of decayed, missing and filled permanent teeth in a child’s mouth determined by oral exam by the dentist.
Overall significant (p<0.05) by t-test, Wilcoxon or Kruskal-Wallis
p<0.10
All girls reported brushing at least once a day, and 76% reported more than once a day. However, only 52% reported flossing. The majority of the mothers brushed their teeth more than once a day (96%), reported flossing (61%) and having dental checkups at least once a year (70%). Few dental practices differed by age, race/ethnicity, BMI, or menarche for girls or mothers. Older girls flossed more often and had more frequent dental check-ups. Twelve girls had gingival disease by visual inspection whereas only two mothers reported having gum disease. The DMFT index (number of caries) was 1 or greater for 18/25 (72%) of the girls. Five dominant bacterial phyla were observed: Actinobacteria (6.8%), Bacteroidetes (27.4%), Firmicutes (29.8%) Fusobacteria (10.8%) and Proteobacteria (24.3%).
Characteristics of the microbiome of mothers and girls
The saliva oral microbiome was varied in the total sample of 46 mothers and daughters combined (Table 4). Richness of the saliva microbiome was similar among the girls and their mothers (mean Shannon index: 3.6 and 3.7, respectively; p=0.15) (Table 5). There was a wider range of the Shannon index in girls, (IQR=0.27) than mothers (IQR=0.13) (data not shown). Bacterial richness was lower among obese/overweight girls compared to normal weight girls, although only of borderline significance (p=0.08) (Table 5).
Table 4.
Phylogenetic distribution of 282 taxa (bacterial strains) detected in 46 study participants in MSSM dental study, 2013.
| Bacterium Phylum | Assigned Phyla (N (%))a |
Published, Identified speciesb |
|---|---|---|
| Firmicutes | 107 (37.9%) | 38 (41.8%) |
| Bacteroidetes | 39 (13.8%) | 15 (16.5%) |
| Proteobacteria | 72 (25.5%) | 19 (20.9%) |
| Actinobacteria | 33 (11.7%) | 13 (14.3%) |
| Fusobacteria | 6 (2.1%) | 2 (2.3%) |
| Tenericutes | 5 (1.8%) | 0 |
| Spirochaetes | 4 (1.4%) | 2 (2.3%) |
| TM7 | 4 (1.4%) | 0 |
| Cyanobacteria | 3 (1.1%) | 0 |
| Synergistetes | 2 (0.7%) | 1 (1.1%) |
| Elusimicrobia | 2 (0.7%) | 0 |
| Chlorobi | 1 (0.4%) | 0 |
| Chloroflexi | 1 (0.4%) | 0 |
| Deferribacteres | 1 (0.4%) | 1 (1.1%) |
| SR1 | 1 (0.4%) | 0 |
| GN02 | 1 (0.4%) | 0 |
| Total detected | 282 (100%) | 91 (32.3%) |
Note: Phyla refer to named species (both phyla and species) and to unidentified phylotypes at species level. Phylotypes are defined as clusters whose members have 97% full 16s rRNA sequence similarity. The data in this table are based on those in HOMD version 10.
Named species are those with validly published names.
Table 5.
Comparison of bacterial community richness and overall microbiome dissimilarity for selected dental and health characteristics in both children and mothers. MSSM Dental Study, 2013.
| Children | |||
|---|---|---|---|
| Characteristic | Bacterial Community Richness (Shannon H indexa, mean+SD) by Characteristics |
||
| Yes | No | p-valueb | |
| Health status | |||
| Gingivitis | 3.6 ± 0.3 | 3.7 ± 0.1 | 0.18 |
| Gum bleedc | 3.8 ± 0.2 | 3.6 ± 0.2 | 0.11 |
| Overweight | 3.5 ± 0.2 | 3.7 ± 0.2 | 0.08 |
| Oral hygiene | |||
| Flossing | 3.6 ± 0.2 | 3.7 ± 0.2 | 0.34 |
| Brush teethd | 3.6 ± 0.2 | 3.6 ± 0.2 | 0.67 |
| Development | |||
| Menarche | 3.6 ± 0.2 | 3.6 ± 0.2 | 0.55 |
| Mothers | |||
| Characteristic |
Bacterial Community Richness
(Shannon H indexa, mean+SD) |
||
| Yes | No | p-valueb | |
| Health status | |||
| Gum bleedc | 3.8 ± 0.04 | 3.7 ± 0.2 | 0.07 |
| Overweight | 3.6 ± 0.2 | 3.8 ± 0.1 | 0.14 |
| Oral hygiene | |||
| Flossing | 3.7 ± 0.2 | 3.8 ± 0.1 | 0.05 |
| Brush teethd | 3.7 ± 0.002 | 3.8 ± 0.2 | 0.02 |
Note: .H=The proportion of genus (i) relative to the total number of genus (pi) is calculated, and then multiplied by the natural logarithm of this proportion (lnpi). The resulting product is summed across genus, and multiplied by −1
.Shannon Index differences were tested using the Student t-test and the UNifrac distance by PerMANOVA.
.Bleeding while brushing, at least 3x per week.
.Brush teeth ≥ 1/ day
Richness was also reduced among mothers with gum bleeding, flossing and teeth brushing >1/day but not in girls. Diversity (beta-diversity, i.e., difference between individual microbiomes) was significantly greater for the 21 mothers than for the 23 daughters (p=0.021) (Figure 1).
Figure 1.
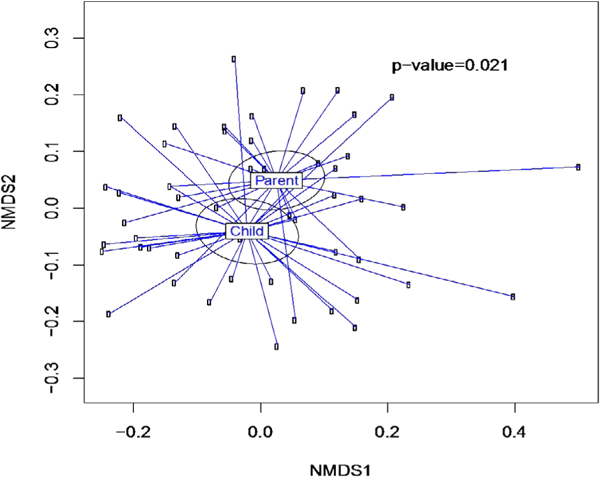
The Beta-diversity of overall salivary microbiome of girls (n=21) and their mothers (n=21). Mothers had greater diversity than their daughters (p=.021). The weighted Unifrac distance matrices generated from taxa composition and relative abundance at genus level were visualized in nMDS plot. Ellipses were drawn to represent the standard error. The significance of the dissimilarity of overall microbiota between two groups was tested using PerMANOVA
We further assessed beta-diversity in children by several characteristics using NMDS plots. Overweight girls were found to have more diverse microbiomes than the normal-weight girls (p=.058) (Figure 2). When comparing normal-weight to overweight/obese subjects, we did not find significant differences in the Firmicutes to Bacteroidetes ratio in saliva samples for either girls or their mothers (p-value=0.47, 0.84, respectively by t test) (Data not shown).
Figure 2.
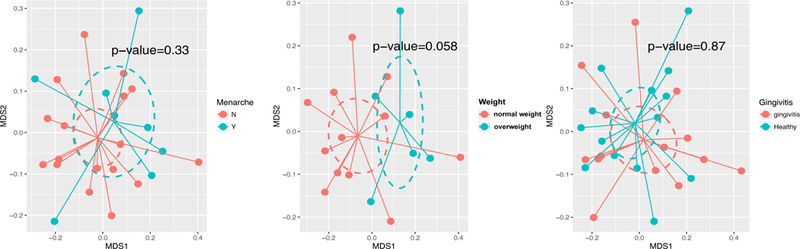
Diversity of the salivary microbiome in girls by different health characteristics. Weighted Unifrac distance matrices of the girls’ salivary microbiome data at genus level were visualized using nMDS plot. Diversity was greater among the overweight girls (n=21 p=.058). Ellipses were drawn to represent the standard error. The significance of the dissimilarity of overall microbiota between those with and without health characteristics was tested using PerMANOVA.
Comparisons among mothers and daughters
Figure 3 shows the comparison of the number of microbiota from phylum to genus level between children and mothers. This Lefse analysis exhibited increased Corynebacterium in girls and in mothers, enrichment of Porphyromonas, Tannerella, Atopobium, Fusobacterium, Campylobacter and Aggregatibacter.
Figure 3.
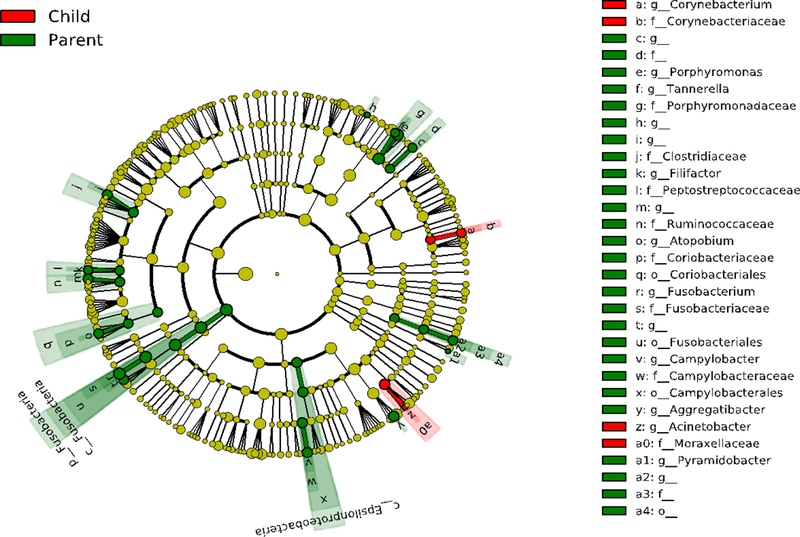
Differential salivary microbiome composition of girls (n=25) and mothers (n=21). Cladogram plots compare the Lefse results from the salivary microbiome of children vs. mothers. Differences are represented in the color for the most abundant class (red indicating enrichment in girls, green indicating enrichment in parents). Each circle’s diameter is proportional to the taxon’s abundance. In girls, we observed enrichment of Corynebacterium and in mothers, enrichment of Porphyromonas, Tannerella, Atopobium, Fusobacterium, Campylobacter and Aggregatibacter
Comparisons of taxa by certain characteristics
Among girls, we observed differences in certain taxa features by body size (overweight vs normal weight), menarche and gingivitis (Figure 4). In post-menarcheal compared with pre-menarcheal girls, the relative abundance of Flavobacteria class, an unclassified genus in Gammaproteobacteria class and Pseudomonadaceae, were decreased while Actinobacteria phylum and Mocrococcacea family and its Rothia genus were increased. In obese/overweight children, relative abundance of Megasphaera and Lactobacillales order was increased and CW040 order and Lactobacillus genus were decreased. In addition, girls with gingivitis showed increased relative abundance in the Scardovia genus and Bifidobacteriales order and decreased Gemellaceae family.
Figure 4.
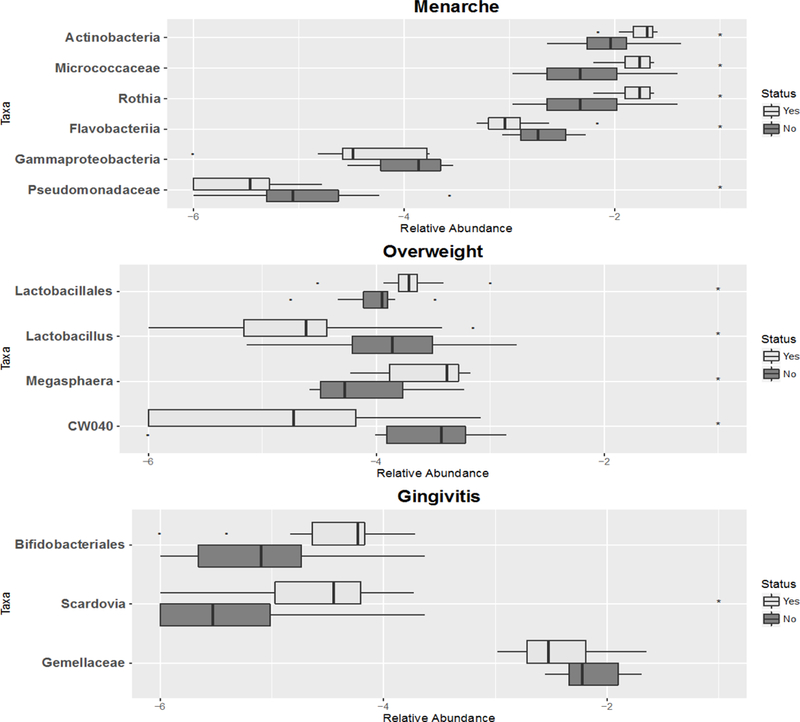
Abundance of selected taxa features selected from phylum to genus level compared by Status of girls’ Menarche, Overweight or Gingivitis (n=21). The boxplots show the median and the interquartile range of the relative abundance of selected taxa. Taxa were selected using random forest algorithm. Taxa that differed (p-value<0.05) are annotated with asterisk symbols.
Discussion
The complex equilibrium between the diversity and relative proportion of species or taxa within the oral cavity maintains a healthy microbiome. Richness and diversity are desirable in the human microbiome, as they have been associated with better overall and dental health. The oral microbiome is only slightly less developed than the gut, which has been studied more extensively. Our analyses compared the diversity and richness by certain lifestyle, dental and biologic characteristics in girls and their biological mothers.
The oral microbiomes of girls and mothers in this study were diverse and exhibited a rich microbial environment, similar to previous reports of an ethnically diverse population of adults where the Shannon index ranged from 2 to 4 [29]. Microbiome richness was similar among mothers and their daughters; however, richness was lower among overweight than normal weight girls, while diversity was greater. Some studies have shown the oral microbiome of young children to be less complex than those of adults, with the number of different species detected increasing with child age [30–32], whereas others found the oral microbiome to vary most during childhood, when contact with external microbes is highest [33]. We observed differences in diversity between mothers and girls and in the Lefse analysis of variability, where mothers had more enriched taxa than girls (five vs two). It has been established that cohabitating individuals share bacterial biota; however, in many of these studies, the cohabitating individuals also may have had genetic relationships [34].
Obesity has been associated with periodontal disease and with altered oral microbiome. The inter-relationship between hormones, obesity and the oral microbiome is not well understood. Puberty is time when changes occur in the subgingival microbiome leading to a microbial profile that is similar to young adults. Studies report differences in bacteria of the oral microbiome associated with periodontal diseases in pre and post-pubertal children [14,35,36]. Girls in our study were on average about halfway through puberty, as the window spans about 9–15 years of age. The presence of gingivitis is a determinant of microbial changes so it may contribute to our findings since gingivitis had a prevalence of 50% in our population. Although richness and diversity were similar by menarche and by gingivitis in our study, differences were seen at the taxa level for several common bacteria. Overweight girls in our study had fewer taxa within Lactobacillus species but more in Lactobacillales order. Several studies [37–39] show that an increase of probiotics, specifically certain strains of gut Lactobacillus to be associated with weight loss in both human and animal studies. However, other studies reported the opposite. For instance, higher concentrations of Lactobacillus species have been observed in the gut microbiota of obese children [8] this report also found that obese children had an elevated Firmicutes-to-Bacteroidetes ratio compared to lean children. Evidence regarding a phylum level association between gut Firmicutes-to-Bacteroidetes ratios and BMI has been contradictory [40,41]. Several studies of the gut microbiome have found obese subjects have more Firmicutes and relatively less Bacterioidetes than normal weight adults [9,10,42] and children [8,43] whereas we and others [44,45] report no difference in the ratio of Firmicute-to-Bacterioidetes in either gut or oral microbiome.
There is increasing interest about the impact of human microbiota on human health, specifically, studying microbiome variability related to the multifactorial etiology of obesity in children [8,11]. A bi-directional pathway linking obesity and oral disease has been proposed. Central to this pathway is the role of altered inflammation which is a key feature of both obesity and dental microbial diseases such as periodontitis [6,7]. In an animal model, obesity has been reported to interfere with the ability of the immune system to appropriately respond to infection by the periodontal pathogen Porphyromonas gingivalis [46]. Fat is recognized as a reservoir for inflammatory cytokines, and it has been suggested that obesity likely affects periodontal disease through this pathway [47]. Lack of diversity in the gut microbiome has been associated with obesity [48]. Several mechanisms have been proposed including triggering inflammation, altering metabolic efficiency and promoting fat deposition [33,49]. Murphy reported increased dietary energy harvest, attributed to alterations in the gut microbiota (increased Firmicutes and decreased Bacteroidetes), suggesting that the obese microbiome possesses metabolic pathways that are highly efficient at extracting energy from food. Recent evidence suggests that gut microbiota is involved in energy regulation, and this should play a role in the pathophysiology of obesity [50,51]. The oral microbiota have been reported to differ between normal and overweight/obese children and adults [4,11] and in animal studies [52], although the direction is unclear. Differences in studies could be related to age population age differences and the fact that the oral microbiome is an open system and frequently exposed to exogenous bacteria in food, water and air. Data suggest that genetic factors could contribute to the difference in bacterial colonization in obese and normal weight adolescents and children [49,53–56].
Limitations
This pilot study with a small sample size limited our ability to see associations. The study was intended to test proof of concept to investigate oral health, microbiome, and health effects in a dental clinic. Our study population was recruited from an urban dental clinic with most girls being Hispanic or Black; therefore results are not generalizable to all girls. Another potential weakness is whether a single sample of the salivary microbiome provides a reasonable representation of a person’s microbiome. Research is limited on temporal changes and factors that can influence one’s oral microbiome. The relationship between the oral microbiome and its host is dynamic and in a healthy mouth, the composition of microbial communities appears to be relatively stable (after childhood) over time. Biological changes in a person’s life such as pregnancy and puberty can affect the balance of the species, and lifestyle factors such as poor hygiene and smoking can also affect the balance.
Conclusion
Our study provides novel data on the association of health conditions with the oral microbiome in a multi-ethnic sample and how associations differ between mothers and daughters. We also observed new genus level taxonomic signatures of Lactobacillales obtained from the oral microbiota associated with obesity in children. Our data confirm the importance of genus level taxonomic classification in understanding patterns of microbiome alterations in disease and provides evidence that these alterations can be investigated using salivary samples from the human oral microbiome. Our study is consistent with Malamud and colleagues who reported that saliva is capable of providing clinically informative markers of disease and is advantageous due to its non-invasive collection and storage.
Funding Sources
This research was supported by National Institute of Environmental Health Sciences (NIEHS) P30 ES023515–01: The Mount Sinai Transdisciplinary Center on Early Environmental Exposures; 5 T35 ES007269–25: Short-Term Training Students in Environmental Health Sciences. We acknowledge the Children’s Environmental Health Center at Mount Sinai School of Medicine for funding this pilot project.
Footnotes
Conflict of Interest
The authors declare no conflict of interest.
References
- 1.Figuero E, Lindahl C, Marin MJ, Renvert S, Herrera D, et al. (2014) Quantification of periodontal pathogens in vascular, blood, and subgingival samples from patients with peripheral arterial disease or abdominal aortic aneurysms. J Periodontol 85: 1182–1193. [DOI] [PubMed] [Google Scholar]
- 2.Dalla-Vecchia CF, Susin C, Rosing CK, Oppermann RV, Albandar JM (2005) Overweight and obesity as risk indicators for periodontitis in adults. J Periodontol 76: 1721–1728. [DOI] [PubMed] [Google Scholar]
- 3.Braundmeier AG, Lenz KM, Inman KS, Chia N, Jeraldo P, et al. (2015) Individualized medicine and the microbiome in reproductive tract. Front Physiol 6: 97. [DOI] [PMC free article] [PubMed] [Google Scholar]
- 4.Haffajee AD, Socransky SS (2009) Relation of body mass index, periodontitis and Tannerella forsythia. J Clin Periodontol 36: 89–99. [DOI] [PubMed] [Google Scholar]
- 5.Wade WG (2013) The oral microbiome in health and disease. Pharmacol Res 69: 137–143. [DOI] [PubMed] [Google Scholar]
- 6.Nagpal R, Yamashiro Y, Izumi Y (2015) The two-way association of periodontal infection with systemic disorders: An overview. Mediators Inflamm p: 793898. [DOI] [PMC free article] [PubMed] [Google Scholar]
- 7.Fell RA, Zee KY, Arora M (2013) The correlation of serum and gingival crevicular fluid cytokines in obese subjects. J Int Acad Periodontol 15: 20–28. [PubMed] [Google Scholar]
- 8.Bervoets L, Hoorenbeeck KV, Kortleven I, Noten CV, Hens N, et al. (2013) Differences in gut microbiota composition between obese and lean children: A cross-sectional study. Gut Pathog 5: 10–15. [DOI] [PMC free article] [PubMed] [Google Scholar]
- 9.Ley RE (2010) Obesity and the human microbiome. Curr Opin Gastroenterol 26: 5–11. [DOI] [PubMed] [Google Scholar]
- 10.Tsai F, Coyle WJ (2009) The microbiome and obesity: Is obesity linked to our gut flora?. Curr Gastroenterol Rep 11: 307–313. [DOI] [PubMed] [Google Scholar]
- 11.Zeigler CC, Persson GR, Wondimu B, Marcus C, Sobko T, et al. (2012) Microbiota in the oral subgingival biofilm is associated with obesity in adolescence. Obesity 20: 157–164. [DOI] [PubMed] [Google Scholar]
- 12.Kumar A, Masamatti SS, Virdi MS (2012) Periodontal diseases in children and adolescents: A clinician’s perspective part 2. Dent Update 39: 639–652. [DOI] [PubMed] [Google Scholar]
- 13.Van-Oosten MA, Mombelli A, Gusberti FA, Lang NP (1988) Black- pigmented bacteroides and spirochetes in the subgingival microbiota of prepuberal schoolchildren. J Periodontal Res 23: 199–203. [DOI] [PubMed] [Google Scholar]
- 14.Wojcicki CJ, Harper DS, Robinson PJ (1987) Differences in periodontal disease-associated microorganisms of subgingival plaque in prepubertal, pubertal and postpubertal children. J Periodontol 58: 219–223. [DOI] [PubMed] [Google Scholar]
- 15.Biro FM, Galvez MP, Greenspan LC, Succop PA, Vangeepuram N, et al. (2010) Pubertal assessment method and baseline characteristics in a mixed longitudinal study of girls. Pediatrics 126: e583–e590. [DOI] [PMC free article] [PubMed] [Google Scholar]
- 16.Reeves AF, Rees JM, Schiff M, Hujoel P (2006) Total body weight and waist circumference associated with chronic periodontitis among adolescents in the United States. Arch Pediatr Adolesc Med 160: 894–899. [DOI] [PubMed] [Google Scholar]
- 17.Tuohy KM, Fava F, Viola R (2014) The way to a man’s heart is through his gut microbiota-dietary pro- and prebiotics for the management of cardiovascular risk. Proc Nutr Soc 73: 172–185. [DOI] [PubMed] [Google Scholar]
- 18.Foxman B, Luo T, Srinivasan U, Ramadugu K, Wen A, et al. (2016) The effects of family, dentition, and dental caries on the salivary microbiome. Ann Epidemiol 26: 348–354. [DOI] [PMC free article] [PubMed] [Google Scholar]
- 19.Stahringer SS, Clemente JC, Corley RP, Hewitt J, Knights D, et al. (2012) Nurture trumps nature in a longitudinal survey of salivary bacterial communities in twins from early adolescence to early adulthood. Genome Res 22: 2146–2152. [DOI] [PMC free article] [PubMed] [Google Scholar]
- 20.Tanner AC, Milgrom PM, Kent R Jr, Mokeem SA, Page RC, et al. (2002) Similarity of the oral microbiota of pre-school children with that of their caregivers. Oral Microbiol Immunol 17: 379–387. [DOI] [PubMed] [Google Scholar]
- 21.www.cdc.gov/obesity/childhood/defining.html (Accessed on 7/30/2018).
- 22.Joshipura KJ, Douglass CW, Garcia RI, Valachovic R, Willett WC (1996) Validity of a self-reported periodontal disease measure. J Public Health Dent 56: 205–212. [DOI] [PMC free article] [PubMed] [Google Scholar]
- 23.Caporaso J, Kuczynski J, Stombaugh J, Bittinger K, Bushman FD, et al. (2010) QIIME allows analysis of high-throughput community sequencing data. Nat Methods 7: 335–336. [DOI] [PMC free article] [PubMed] [Google Scholar]
- 24.Morgan XC, Huttenhower C (2012) Chapter 12: Human microbiome analysis. PLoS Comput Biol 8: e1002808. [DOI] [PMC free article] [PubMed] [Google Scholar]
- 25.Shannon CE (1948) A mathematical theory of communication. Bell System Technical Journal 27: 623–656. [Google Scholar]
- 26.Chen J, Bittinger K, Charlson ES, Hoffmann C, Lewis J, et al. (2012) Associating microbiome composition with environmental covariates using generalized UniFrac distances. Bioinformatics 28: 2106–2113. [DOI] [PMC free article] [PubMed] [Google Scholar]
- 27.Price JA, Smith J, Simmons A, Fellers J, Rush CM (2010) Multiplex real-time RT-PCR for detection of Wheat streak mosaic virus. J Virol Methods 165: 198–201. [DOI] [PubMed] [Google Scholar]
- 28. www.cc.oulu.fi/~jarioksa/opetus/metodi/vegantutor.pdf.
- 29.Segata N, Izard J, Waldron L, Gevers D, Miropolsky L, et al. (2011) Metagenomic biomarker discovery and explanation. Genome Biol 12: R60. [DOI] [PMC free article] [PubMed] [Google Scholar]
- 30.Mason MR, Nagaraja HN, Camerlengo T, Joshi V, Kumar PS (2013) Deep sequencing identifies ethnicity-specific bacterial signatures in the oral microbiome. PLoS One 8: e77287. [DOI] [PMC free article] [PubMed] [Google Scholar]
- 31.Frisken KW, Higgins T, Palmer JM (1990) The incidence of periodontopathic microorganisms in young children. Oral Microbiol Immunol 5: 43–45. [DOI] [PubMed] [Google Scholar]
- 32.Socransky SS, Manganiello SD (1971) The oral microbiota of man from birth to senility. J Periodontol 42: 485–496. [DOI] [PubMed] [Google Scholar]
- 33.Sarkonen N, Kononen E, Summanen P, Kanervo A, Takala A, et al. (2000) Oral colonization with Actinomyces species in infants by two years of age. J Dent Res 79: 864–867. [DOI] [PubMed] [Google Scholar]
- 34.Kononen E (2000) Development of oral bacterial flora in young children. Ann Med 32: 107–112. [DOI] [PubMed] [Google Scholar]
- 35.Abeles SR, Jones MB, Santiago-Rodriguez TM (2016) Microbial diversity in individuals and their household contacts following typical antibiotic courses. Microbiome 4: 39. [DOI] [PMC free article] [PubMed] [Google Scholar]
- 36.Mackler SB, Crawford JJ (1973) Plaque development and gingivitis in the primary dentition. J Periodontol 44: 18–24. [DOI] [PubMed] [Google Scholar]
- 37.Delaney JE, Ratzan SK, Kornman KS (1986) Subgingival microbiota associated with puberty: Studies of pre-, circum and postpubertal human females. Pediatr Dent 8: 268–275. [PubMed] [Google Scholar]
- 38.Ji YS, Kim HN, Park HJ, Lee JE, Yeo SY, et al. (2012) Modulation of the murine microbiome with a concomitant anti-obesity effect by Lactobacillus rhamnosus GG and Lactobacillus sakei NR28. Benef Microbes 3: 13–22. [DOI] [PubMed] [Google Scholar]
- 39.Sanchez M, Darimont C, Drapeau V, Emady-Azar S, Lepage M, et al. (2014) Effect of Lactobacillus rhamnosus CGMCC1.3724 supplementation on weight loss and maintenance in obese men and women. Br J Nutr 111: 1507–1519. [DOI] [PubMed] [Google Scholar]
- 40.Osterberg KL, Boutagy NE, McMillan RP, Stevens JR, Frisard MI, et al. (2015) Probiotic supplementation attenuates increases in body mass and fat mass during high-fat diet in healthy young adults. Obesity 23: 2364–2370. [DOI] [PubMed] [Google Scholar]
- 41.Harley IT, Karp CL (2012) Obesity and the gut microbiome: Striving for causality. Mol Metab 1: 21–31. [DOI] [PMC free article] [PubMed] [Google Scholar]
- 42.Finucane MM, Sharpton TJ, Laurent TJ, Pollard KS (2014) A taxonomic signature of obesity in the microbiome? Getting to the guts of the matter. PLoS One 9: e84689. [DOI] [PMC free article] [PubMed] [Google Scholar]
- 43.Lin SW, Freedman ND, Shi J, Gail MH, Vogtmann E, et al. (2015) Beta-diversity metrics of the upper digestive tract microbiome are associated with body mass index. Obesity 23: 862–869. [DOI] [PMC free article] [PubMed] [Google Scholar]
- 44.Ferrer M, Ruiz A, Lanza F, Haange SB, Oberbach A, et al. (2013) Microbiota from the distal guts of lean and obese adolescents exhibit partial functional redundancy besides clear differences in community structure. Environ Microbiol 15: 211–226. [DOI] [PubMed] [Google Scholar]
- 45.Duncan SH, Lobley GE, Holtrop G, Ince J, Johnstone AM, et al. (2008) Human colonic microbiota associated with diet, obesity and weight loss. Int J Obes 32: 1720–1724. [DOI] [PubMed] [Google Scholar]
- 46.Schwiertz A, Taras D, Schafer K, Beijer S, Bos NA, et al. (2010) Microbiota and SCFA in lean and overweight healthy subjects. Obesity 18: 190–195. [DOI] [PubMed] [Google Scholar]
- 47.Amar S, Zhou Q, Shaik-Dasthagirisaheb Y, Leeman S (2007) Diet- induced obesity in mice causes changes in immune responses and bone loss manifested by bacterial challenge. Proc Natl Acad Sci USA 104: 20466–20471. [DOI] [PMC free article] [PubMed] [Google Scholar]
- 48.Ritchie CS (2000) Obesity and periodontal disease. Periodontol 44: 154–63. [DOI] [PubMed] [Google Scholar]
- 49.Lloyd-Price J, Abu-Ali G, Huttenhower C (2016) The healthy human microbiome. Genome Med 8: 51. [DOI] [PMC free article] [PubMed] [Google Scholar]
- 50.Goodson JM, Groppo D, Halem S, Carpino E (2009) Is obesity an oral bacterial disease?. J Dent Res 88: 519–523. [DOI] [PMC free article] [PubMed] [Google Scholar]
- 51.Backhed F, Ding H, Wang T, Hooper LV, Koh GY, et al. (2004) The gut microbiota as an environmental factor that regulates fat storage. Proc Natl Acad Sci USA 101: 15718–15723. [DOI] [PMC free article] [PubMed] [Google Scholar]
- 52.Turnbaugh PJ, Ley RE, Mahowald MA, Magrini V, Mardis ER, et al. (2006) An obesity-associated gut microbiome with increased capacity for energy harvest. Nature 444: 1027–1031. [DOI] [PubMed] [Google Scholar]
- 53.DiBaise JK, Zhang H, Crowell MD, Krajmalnik-Brown R, Decker GA, et al. (2008) Gut microbiota and its possible relationship with obesity. Mayo Clin Proc 83: 460–469. [DOI] [PubMed] [Google Scholar]
- 54.Papapanou PN, Behle JH, Kebschull M, Celenti R, Wolf DL, et al. (2009) Subgingival bacterial colonization profiles correlate with gingival tissue gene expression. BMC Microbiol 9: 221–229. [DOI] [PMC free article] [PubMed] [Google Scholar]
- 55.Vogtmann E, Hua X, Zhou L, Wan Y, Suman S, et al. (2018) temporal variability of oral microbiota over 10 months and the implications for future epidemiologic studies. Cancer Epidemiol Biomarkers Prev 27: 594–600. [DOI] [PMC free article] [PubMed] [Google Scholar]
- 56.Malamud D, Rodriguez-Chavez IR (2011) Saliva as a diagnostic fluid. Dent Clin North Am 55: 159–178. [DOI] [PMC free article] [PubMed] [Google Scholar]