Abstract
Antimicrobial resistance, a major threat to human health, is mainly driven by the overuse of antimicrobials. The purpose of this study was to further investigate the relationship between antimicrobial use and resistance with a 15-year record in Southwest hospital, one of the largest hospitals in Southwest China and a university affiliated hospital, thus to further predict the antimicrobial resistance in an autoregressive integrated moving average (ARIMA) manner. Kirby-Bauer tests were carried out to figure out the drug sensitivity of Gram-negative bacterial. Antimicrobials (β-lactamase inhibitor complex, aminoglycosides, quinolones, third and fourth-generation cephalosporins, carbapenems, cephamycins, oxacephems, and sulfonamides) consumption were calculated according to World Health Organization (WHO) anatomical therapeutic chemical classification index and expressed as annual defined daily dose (DDD) or DDD per 1000 out patients. Resistance rates of levofloxacin-resistant Escherichia coli, ceftazidime-resistant Klebsiella pneumoniae, amikacin-resistant Bacterium levans, imipenem-resistant Pseudomonas aeruginosa is positively correlated with the usage of aminoglycosides and quinolones; resistance rates of imipenem-resistant Acinetobacter baumanii is positively correlated with the usage of carbapenemes (P-value between the drug resistance of levofloxacin-resistant E. coli, ceftazidime-resistant K. pneumoniae and the usage of aminoglycosides is under .05, the other P-value are under .01); resistance rates of the drug resistance of levofloxacin-resistant E. coli is positively correlated with the usage of oxacephems (P < .01); resistance rates of imipenem-resistant P. aeruginosa is positively correlated with the usage of oxacephems and sulfonamides (P < .01).
The present study presents one of the largest and longest retrospective analyses in China between antimicrobial consumption and antimicrobial resistance. Change of the usage of several antibacterial drugs has great influence on the drug resistance of Gram-negative bacterial. Of particular, ARIMA forecasting revealed that carbapenem related bacterial resistance should be closely watched.
Keywords: antimicrobial consumption, antimicrobial resistance, carbapenem, epidemiology, Gram-negative bacterial
1. Introduction
The past several decades have witnessed the uprising of antimicrobial resistance, which mainly caused by abuse of antimicrobials, and witnessed the huge threats to human health that caused by antimicrobial resistance.[1] According to Antibiotic Resistance Threats in the United States 2013 released by Centers for Disease Control and Prevention of United States, about 20%–50% of all antibiotics prescribed in US acute care hospitals are unnecessary or inappropriate. It was reported that antimicrobial resistance was closely related with antimicrobial consumption.[2,3] Operations of hospital based antibiotic stewardship programs in many countries works in reducing rates of antibiotic resistance and the spread of resistant clones.[4–6] Early in 2004, Southwest hospital, the First Affiliated Hospital of Army Medical University (Third Military Medical University) and one of the largest hospitals in Southwest China, has lunched antimicrobial stewardship programs to explore the relationship between antimicrobial usage and resistance and to further provide an observational experience for guiding prescription and for rational use of antimicrobial.
Of all the bacterial infection, Gram-negative bacteria infections have gotten particular concern because of their features.[7,8] Firstly, the ability of highly efficient up-regulating or acquiring genes that code for mechanisms of antibiotic drug resistance were observed at those organisms, especially in the presence of antibiotic selection pressure. Secondly, multiple mechanisms against the same antibiotic or using a single mechanism to affect multiple antibiotics were also frequently discovered. In the meanwhile, increasing challenges in new compounds screening, high costs and long time for drug development, and growing complexity of designing and performing clinical trials contribute to the growing drug resistance rates, too.[9] At present, rational use of antimicrobial seem to be one the most effective ways to fight against antimicrobial resistance.
The aim of the present study was to evaluate the relationship between antimicrobial use and resistance in a representative sample of Chinese hospital. Particularly, we have applied a time series model for antimicrobial resistance forecasting, which may help in fighting against Gram-negative bacterial antimicrobial resistance in a hospital setting.
2. Methods
2.1. Data source
The study was conducted at the First Affiliated Hospital of Army Medical University, Chongqing, China, a more than 2900 beds, tertiary care teaching hospital. Antibiotic susceptibility patterns in inpatient isolates were monitored at the Center for Microbiology of Southwest hospital from 2004 to 2018. Given the fact that no data on individual patients were specifically noted, ethics committee involvement was not necessary.
2.2. Data on antimicrobial consumption
Consumption data of β-lactamase inhibitor complex, aminoglycosides, quinolones, third-generation cephalosporins, fourth-generation cephalosporin, carbapenems, cephamycins, oxacephems, and sulfonamides were obtained from the hospital computer center database. The data contained the number of packages of each drug used annually from January 2004 to December 2018. DDD was obtained according to WHO anatomical therapeutic chemical (ATC) classification system. DDDs/1000 is shown as DDD per 1000 patient days.
2.3. Data on resistance rates of antimicrobials
The susceptibility of several selected Gram-negative bacterial to antimicrobial agents was tested using the disk diffusion method according to the guidelines set by Clinical and Laboratory Standards Institute (CLSI, Performance Standards for Antimicrobial Susceptibility Testing, 21st edition). Drug resistance was reported as the percentage of resistant isolates (percentage of all resistant and intermediate resistant strains) among all tested isolates. Escherichia coli ATCC 25922, Pseudomonas aeruginosa ATCC 27853, and Klebsiella pneumoniae ATCC70063 were taken as reference strains to ensure reproducibility of the antibiotic susceptibility testing procedure.
2.4. Statistical Analysis
The primary forecasting analysis of resistance rate data of antimicrobial were performed by ARIMA.[10–13] This model is justified for analysis of equidistant and discrete samples of data in a time series model, which suits perfectly with the analysis of resistance rate data of antimicrobial. Consisting of autoregressive (AR), moving average (MA), and ARMA models, ARIMA model was set up through three major steps: identification, estimation and diagnosis. Briefly, an ARIMA model were firstly created based on observed annual antimicrobial consumption and resistance rate and differencing were performed for achieving stationarity when necessary. Then, AR, MA, and ARMA were identified by detecting the series autocorrelation function (ACF) and partial autocorrelation function (PACF). Unconditional least squares or likelihood functions were used for estimating the parameters of the identified model. The best model was chosen based on a combination of lowest criterion of Akaike information, Bayesian information and root mean square error from each AR-MA combination. Once the model was set up, the prevalence was forecasted by stimulating projected to 2021 and 95% confidence interval (CI) were calculated from the standard deviation. Analyses were performed using STATA version 14.2 and data processed by GraphPad Prism version 7.0.
Association between antimicrobial consumption and antimicrobials resistance was evaluated by parametric Pearson's correlation coefficient. Pearson correlation coefficient γ > 0.6 or γ < −0.6 with a P value < .05 was considered statistically significant.
3. Results
3.1. Antimicrobial consumption
As for the 9 major classes of antimicrobial consumption from 2004 to 2018, the consumption of carbapenem went up yearly while the consumption of quinolones and aminoglycosides went opposite, generally. The consumption of third and fourth generation cephalosporins, cephamycins, and β-lactamase inhibitors went with an irregular up and down (Figure 1).
Figure 1.
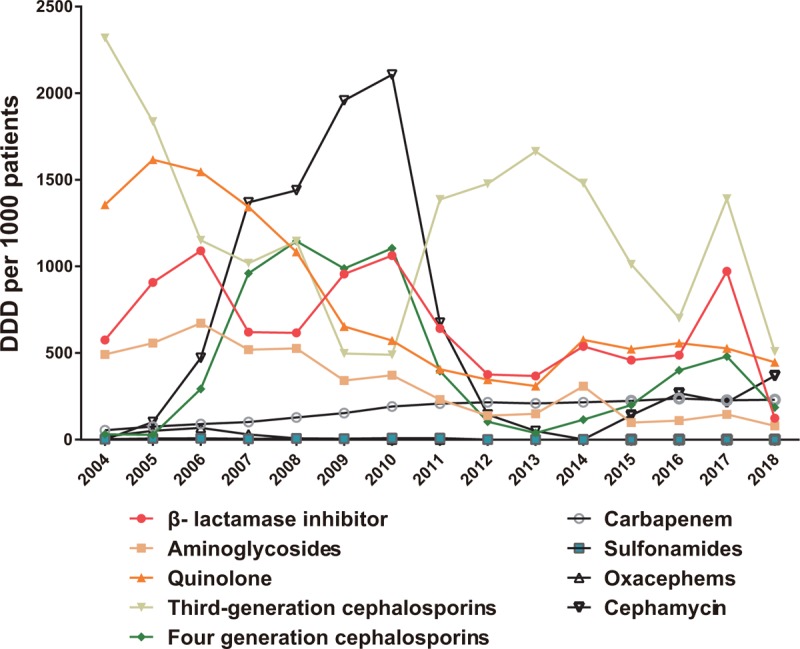
Consumptions of 9 major classes of antimicrobial from 2004 to 2018 in Southwest Hospital.
As for the 8 key antimicrobial (imipenem, meropenem, ceftazidime, levofloxacin, moxifloxacin, etimicin, amikacin, cefixime) monitored in the hospital, consumption of imipenem and meropenem went up year by year while the consumption of levofloxacin went opposite; consumption of cefixime first went through an increase and then decrease while consumption of ceftazidime down first and then down from 2004 to 2018 (Figure 2). The year of 2010 is a turning point of antimicrobial consumption, no matter 9 major classes of antimicrobial or the key monitored antimicrobial, for the policy of national special rectification on clinical use of antibacterial drugs released in 2010.
Figure 2.
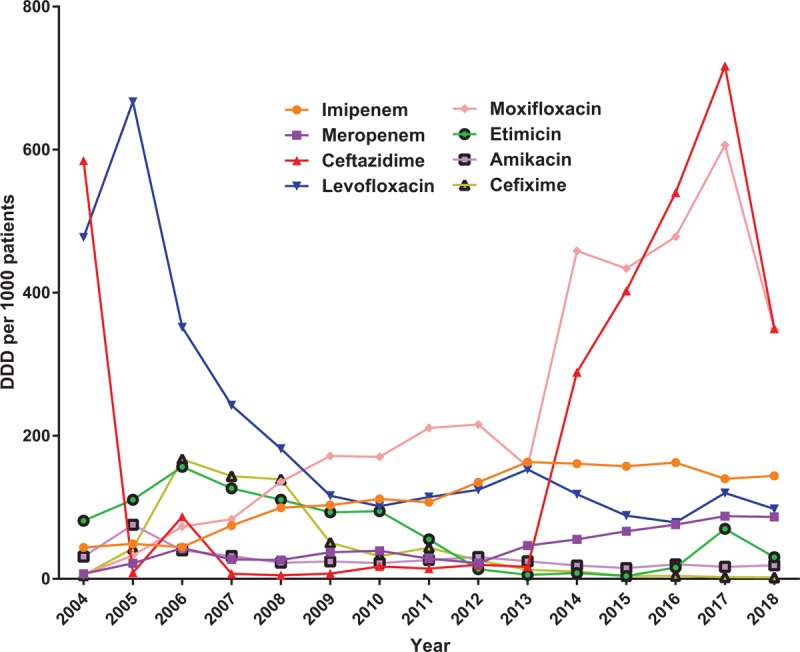
Consumptions of 8 key antimicrobial from 2004 to 2018 in Southwest Hospital.
3.2. Correlation between antimicrobial consumption and antimicrobial resistance
As present in Figure 3, for specific bacterial resistance rate changes from 2004 to 2018, we can find out that the resistance rate of levofloxacin to E. coli was high all along. Additionally, the resistance rate of imipenem to Acinetobacter baumannii and to K. pneumoniae are on the rising while resistance rate of amikacin to Enterobacter cloacae, imipenem to P. aeruginosa and ceftazidime to K. pneumoniae decrease yearly from 2004 to 2018, in general.
Figure 3.
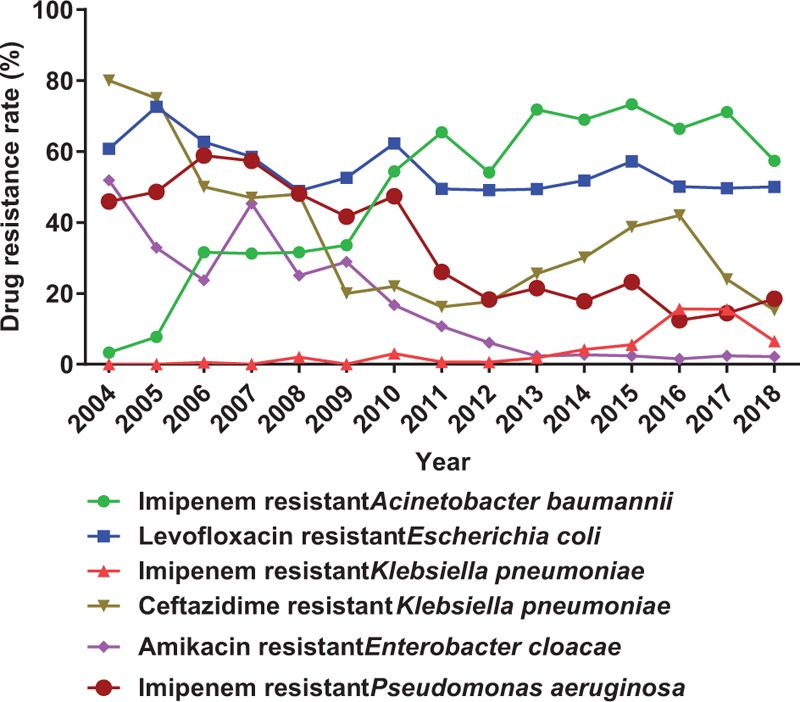
Changes of several drug resistance rates from 2004 to 2018 in Southwest Hospital.
Based on the Pearson's correlation coefficient analysis (Table 1), the resistance rate of levofloxacin resistance E. coli, ceftazidime resistance K. pneumoniae, amikacin resistant E. cloacae, imipenem resistance P. aeruginosa have a significant positive relationship with consumption of aminoglycosides and quinolone and a negative relationship with consumption of carbapenem (γ = 0.618, P = .024; γ = 0.609, P = .027; γ = 0.772, P = .002; γ = 0.916, P = .0001, respectively for aminoglycosides. γ = 0.732, P = .004; γ = 0.844, P = .0001; γ = 0.795, P = .001; γ = 0.818, P = .001, respectively for quinolone; γ = −0.659, P = .014; γ = −0.784, P = .002; γ = −0.921, P = .0001; γ = −0.860, P = .0001, respectively for carbapenem). Resistance rate of imipenem resistance A. baumannii has a significant positive relationship with consumption of carbapenem and a negative relationship with consumption of aminoglycosides and quinolone (γ = 0.954, P = .0001, for carbapenem; γ = −0.811, P = .001, for aminoglycosides; γ = −0.864, P = 0.0001, for quinolone.). Resistance rate of levofloxacin resistance E. coli has a significant positive relationship with consumption of β-lactamase inhibitor combinations and oxacephems (γ = 0.620, P = .024; γ = 0.724, P = .005, respectively). Resistance rate of imipenem resistance P. aeruginosa has a significant positive relationship with consumption of β-lactamase inhibitor combinations, oxacephems and sulfonamides (γ = 0.715, P = .006; γ = 0.720, P = .006;γ = 0.691, P = .009, respectively).
Table 1.
Relationship between yearly consumption of 9 classes of antimicrobial agents and rates of 6 key resistant Gram-negative pathogens at Southwest Hospital from 2004 to 2018.

3.3. Prediction of antimicrobial resistance by ARIMA
Complicated but traceable relationships between antimicrobial consumption and antimicrobial resistance were observed. In this setting, a modeling for predicting the prevalence of antimicrobial resistance would be of great importance in preventing and controlling the spread of drug resistance. ARIMA is particularly fitted to time series data either to better understand the data or to predict future points in the series, which is perfect in predicting antimicrobial resistance under our current data setting.[10–13] We applied ARIMA to predict resistance rate of A. baumannii to imipenem, E. coli to levofloxacin and K. pneumoniae to imipenem for the upcoming 2019 to 2021 based on antimicrobial consumption and antimicrobial resistance we got from 2004 to 2018. From our prediction, resistance rate of A. baumannii to imipenem will rise form 3.3% to 63.8% (Figure 4); resistance rate of K. pneumoniae to imipenem will rise form 0% to 8.5% (Figure 5); resistance rate of E. coli to levofloxacin will stay at around 59.80% in 2021 (Figure 6).
Figure 4.
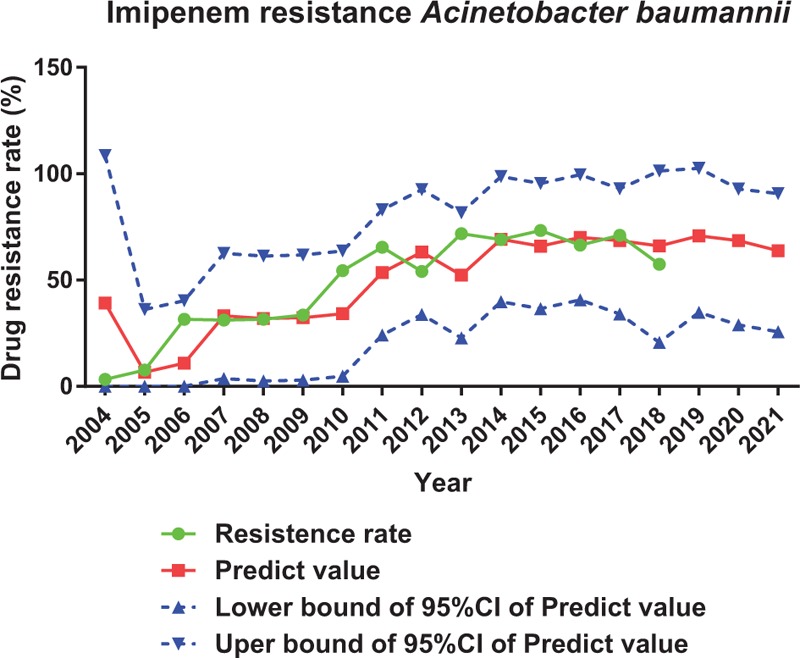
Prediction of resistance rate of imipenem to Acinetobacter baumannii by ARIMA.
Figure 5.
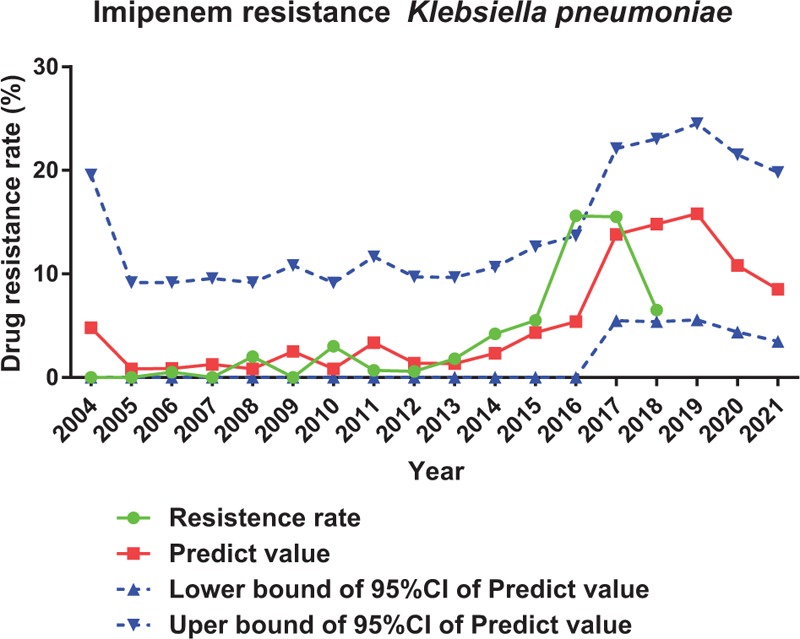
Prediction of resistance rate of imipenem to Klebsiella pneumoniae by ARIMA.
Figure 6.
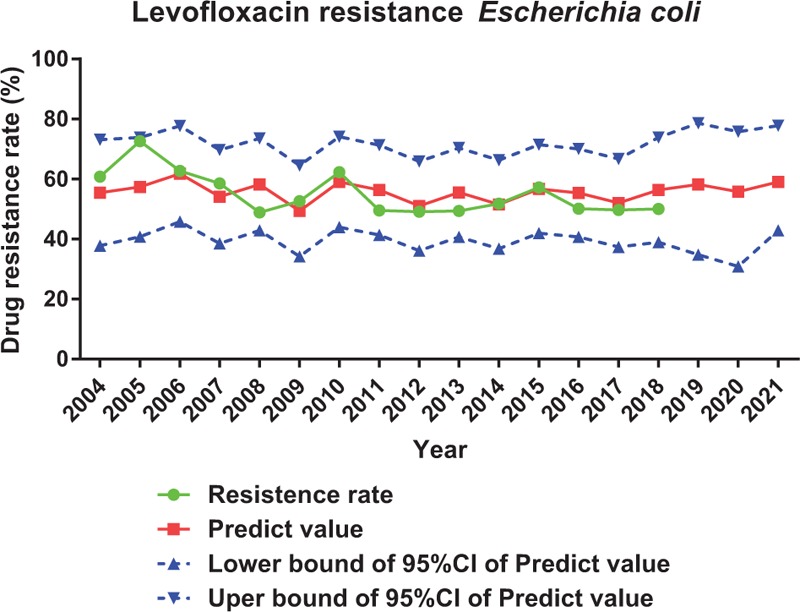
Prediction of resistance rate of levofloxacin to Escherichia coli by ARIMA.
4. Discussion
The present study firstly revealed that even though the consumption β-lactamase inhibitor complex and third and fourth generation cephalosporins fluctuations, and the usage of quinolones decreases year by year, the usage of all the mentioned antimicrobial are still at very high level even in 2018, which can partly be reflected by the resistance rate of E. coli to levofloxacin (fluctuates around 55% from 2004 to 2018). Additionally, we found multiple direct relationships between several antimicrobial consumption and antimicrobial resistance in some Gram-negative bacteria. Of all the direct relationships between antimicrobial consumption and antimicrobial resistance, one is of our particular interest: consumption of β-lactamase inhibitor combinations has a significant positive relationship with P. aeruginosa resistance to imipenem (γ = 0.715, P = .006). Similar findings were also reported by other groups.[14,15] We speculated that the P. aeruginosa resistance to imipenem could also be induced by the overuse of β-lactamase inhibitor combinations. We then hypothesized that the β-lactamase inhibitor combinations induced P. aeruginosa resistance to imipenem could cause the same cell wall stress so that to promotes the development of drug resistance as imipenem does.[16,17] However, this hypothesis remains to be clarified in the upcoming future.
Another interesting phenomenon is that although resistance rate of imipenem resistance K. pneumoniae have no significant relationship with consumption of carbapenem on our current setting (γ = 0.572, P = .041), relationship between those two would be statistically different when we only taken data from 2011 to 2018 (γ = 0.950, P < .01). In parallel with our data, data from India also found that the resistance rate of K. pneumoniae was significantly positive related to consumption of meropenem from 2010 to 2013.[18] Giving the fact that consumption of carbapenem rises yearly, it is really critical to keep carbapenem related bacterial resistance under close surveillance. ARIMA prediction on resistance rate of selected bacterial to imipenem also provides the same warning.
To our knowledge, the present study, which highlighted the relationship between 9 classes of antimicrobial consumption and 6 Gram-negative bacterial resistance, presents one of the largest and longest antimicrobial databases in China. With a database of such scale and a suitable method like ARIMA, the prediction of antimicrobial resistance rate would be of great validity and reliability. This positive correlation between antimicrobial consumption and antimicrobial resistance would help guiding the prescription for future antimicrobial resistance control. Future work on multicenter cooperation in digging the database would help us in better controlling the prevalence of antimicrobial resistance.
Acknowledgments
We thank Dr. Dong Yi (Department of Health Statistics, College of Preventive Medicine, Army Medical University) for technical support in statistical analysis.
Author contributions
Data curation: Wei Guo, Fengjun Sun, Fang Liu, Jie Yang.
Formal analysis: Wei Guo, Fengjun Sun, Fang Liu, Liya Cao.
Funding acquisition: Wei Guo.
Investigation: Wei Guo, Liya Cao, Jie Yang, Yongchuan Chen.
Methodology: Wei Guo, Liya Cao, Jie Yang.
Project administration: Fengjun Sun, Yongchuan Chen.
Resources: Fengjun Sun.
Supervision: Fengjun Sun.
Validation: Fengjun Sun, Fang Liu.
Visualization: Fang Liu.
Writing – original draft: Wei Guo, Yongchuan Chen.
Writing – review & editing: Wei Guo, Yongchuan Chen.
Wei Guo: 0000-0002-6938-9005.
Footnotes
Abbreviations: ACF = autocorrelation function, AR = autoregressive, ARIMA = autoregressive integrated moving average, ATC = anatomical therapeutic chemical, CI = confidence interval, CLSI = Clinical and Laboratory Standards Institute, DDD = defined daily dose, MA = moving average, PACF = partial autocorrelation function, WHO = World Health Organization.
How to cite this article: Guo W, Sun F, Liu F, Cao L, Yang J, Chen Y. Antimicrobial resistance surveillance and prediction of Gram-negative bacteria based on antimicrobial consumption in a hospital setting. Medicine. 2019;98:37(e17157).
This study was supported by the National Natural Science Foundation of China (Grant number 81703522)
The authors declare no conflict of interest.
References
- [1].Burnham CD, Leeds J, Nordmann P, et al. Diagnosing antimicrobial resistance. Nat Rev Microbiol 2017;15:697–703. [DOI] [PubMed] [Google Scholar]
- [2].Axente C, Licker M, Moldovan R, et al. Antimicrobial consumption, costs and resistance patterns: a two year prospective study in a Romanian intensive care unit. BMC Infect Dis 2017;17:358. [DOI] [PMC free article] [PubMed] [Google Scholar]
- [3].Benedict KM, Gow SP, McAllister TA, et al. Antimicrobial resistance in Escherichia coli recovered from feedlot cattle and associations with antimicrobial use. PLoS One 2015;10:e0143995. [DOI] [PMC free article] [PubMed] [Google Scholar]
- [4].Ma X, Xie J, Yang Y, et al. Antimicrobial stewardship of Chinese ministry of health reduces multidrug-resistant organism isolates in critically ill patients: a pre-post study from a single center. BMC Infect Dis 2016;16:704. [DOI] [PMC free article] [PubMed] [Google Scholar]
- [5].Camins BC, King MD, Wells JB, et al. Impact of an antimicrobial utilization program on antimicrobial use at a large teaching hospital: a randomized controlled trial. Infect Control Hosp Epidemiol 2009;30:931–8. [DOI] [PMC free article] [PubMed] [Google Scholar]
- [6].Belongia EA, Knobloch MJ, Kieke BA, et al. Impact of statewide program to promote appropriate antimicrobial drug use. Emerg Infect Dis 2005;11:912–20. [DOI] [PMC free article] [PubMed] [Google Scholar]
- [7].Doi Y, Bonomo RA, Hooper DC, et al. Gram-negative bacterial infections: research priorities, accomplishments, and future directions of the antibacterial resistance leadership group. Clin Infect Dis 2017;64suppl_1:S30–5. [DOI] [PMC free article] [PubMed] [Google Scholar]
- [8].Peleg AY, Hooper DC. Hospital-acquired infections due to gram-negative bacteria. N Engl J Med 2010;362:1804–13. [DOI] [PMC free article] [PubMed] [Google Scholar]
- [9].Boucher HW, Talbot GH, Benjamin DK, Jr, et al. 10 × ’20 Progress—development of new drugs active against gram-negative bacilli: an update from the Infectious Diseases Society of America. Clin Infect Dis 2013;56:1685–94. [DOI] [PMC free article] [PubMed] [Google Scholar]
- [10].Adhikari R, Agrawal RK. An introductory study on time series modeling and forecasting. arXiv preprint arXiv:1302.6613. 2013. [Google Scholar]
- [11].Rojas I, Pomares H. Time series analysis and forecasting: selected contributions from the ITISE Conference. Basel: Springer; 2016. [Google Scholar]
- [12].Zou YM, Ma Y, Liu JH, et al. Trends and correlation of antibacterial usage and bacterial resistance: time series analysis for antibacterial stewardship in a Chinese teaching hospital (2009−2013). Eur J Clin Microbiol Infect Dis 2015;34:795–803. [DOI] [PubMed] [Google Scholar]
- [13].Wang Y, Xu C, Zhang S, et al. Temporal trends analysis of human brucellosis incidence in mainland China from 2004 to 2018. Sci Rep 2018;8:15901. [DOI] [PMC free article] [PubMed] [Google Scholar]
- [14].Goel N, Wattal C, Oberoi JK, et al. Trend analysis of antimicrobial consumption and development of resistance in non-fermenters in a tertiary care hospital in Delhi, India. J Antimicrob Chemother 2011;66:1625–30. [DOI] [PubMed] [Google Scholar]
- [15].Mladenovic-Antic S, Kocic B, Velickovic-Radovanovic R, et al. Correlation between antimicrobial consumption and antimicrobial resistance of Pseudomonas aeruginosa in a hospital setting: a 10-year study. J Clin Pharm Ther 2016;41:532–7. [DOI] [PubMed] [Google Scholar]
- [16].Harms A, Maisonneuve E, Gerdes K. Mechanisms of bacterial persistence during stress and antibiotic exposure. Science 2016;3546318: [DOI] [PubMed] [Google Scholar]
- [17].Baharoglu Z, Mazel D. SOS, the formidable strategy of bacteria against aggressions. FEMS Microbiol Rev 2014;38:1126–45. [DOI] [PubMed] [Google Scholar]
- [18].Joseph NM, Bhanupriya B, Shewade DG, et al. Relationship between antimicrobial consumption and the incidence of antimicrobial resistance in Escherichia coli and Klebsiella pneumoniae isolates. J Clin Diagn Res 2015;9:DC08–12. [DOI] [PMC free article] [PubMed] [Google Scholar]


