Abstract
Sickle cell disease (SCD) is a monogenetic disease that results in the formation of hemoglobin S. Due to more rapid oxidation of hemoglobin S due to intracellular heme and adventitious iron in SCD, it has been thought that an inherent property of SCD red cells would be an imbalance in antioxidant defenses and oxidant production. Less deformable and fragile RBC in SCD results in intravascular hemolysis and release of free hemoglobin (PFHb) in the plasma, which might be expected to produce oxidative stress in the plasma. Thus, we aimed to characterize intracellular and vascular oxidative stress in whole blood and plasma samples from adult SCD patients and controls recruited into a large study of SCD at Children’s Hospital of Los Angeles. We evaluated the cellular content of metHb and several components of the antioxidant system in RBC as well as oxidation of GSH and Prx-2 oxidation in RBC after challenge with hydroperoxides. Plasma markers included PFHb, low molecular weight protein bound heme (freed heme), hemopexin, isoprostanes, and protein carbonyls. While GSH was slightly lower in SCD RBC, protein carbonyls, NADH, NAD+ and total NADP+ + NADPH were not different. Furthermore, GSH or Prx-2 oxidation was not different after oxidative challenge in SCD vs. control. Elevated freed heme and PFHb had a significant negative, non-linear association with hemopexin. There appeared to be a threshold effect for hemopexin (200 μg/ml), under which the freed heme rose acutely. Plasma F2-isoprostanes were not significantly elevated in SCD.
Despite significant release of Hb and elevation of freed heme in SCD when hemopexin was apparently saturated, there was no clear indication of uncompensated vascular oxidative stress. This somewhat surprising result, suggests that oxidative stress is well compensated in RBCs and plasma during a period of relative health.
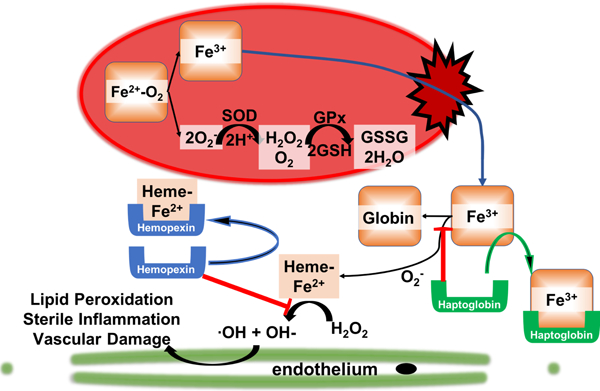
Graphical abstract
Introduction
The fundamental defect in sickle cell disease is a single base pair mutation resulting in an abnormal beta-globin protein in hemoglobin that has the ability to polymerize when deoxygenated1–5. Aside from the adverse rheologic effects of polymerized hemoglobin, there are intracellular biochemical changes that lead to redox abnormalities in both the plasma and erythrocytes6–8. The redox environment in plasma and erythrocytes is a complex milieu of oxidant and anti-oxidant activity and is a target for anti-oxidant therapies such as L-glutamine, which was recently approved by the FDA as a chronic preventative therapy for sickle cell disease9.
Auto-oxidation of the iron in hemoglobin S to Fe3+ and O2− leads to release of heme from Hb and adventitious iron at the inner surface of the erythrocyte membrane, which occurs at 1.7 times the rate of hemoblobin A10,11. There is also evidence for increased superoxide production by NADPH oxidase enzymes on the erythrocyte membrane12. Intracellular mechanisms for clearance of cytosolic oxidative species is robust with both enzymatic and non-enzymatic anti-oxidant systems; however, membrane bound sources of oxidative stress are more difficult to clear13,14.
In addition to the intracellular redox balance, there are extracellular redox stressors such as plasma free hemoglobin and heme released from lysed erythrocytes15 and xanthine oxidase released by the liver that associates with endothelium16 that contribute to the oxidative milieu in the vessel lumen. The plasma and erythrocyte redox environment contribute to a chronic inflammatory and vascular disease process that leads to diffuse vasculopathy, chronic ischemia-reperfusion injury and end-organ dysfunction15,17–20. In this study, relatively healthy SCD patients were studied. Indeed, not separating the data from relatively healthy, transfused, and patients in crisis likely accounts for the conflicting data on the magnitude of the problem of oxidative stress in SCD. Our hypothesis was that RBC and plasma from SCD patients would have increased markers of oxidative stress and decreased anti-oxidant capacity. We show herein that the normal mechanisms designed to maintain redox balance appear to be functional during periods of health, and even a challenge from addition of exogenous hydroperoxides to RBC from relatively healthy SCD patients was handled as efficiently as in controls.
Methods
Patient Recruitment
Adolescent and adult patients with sickle cell disease, not on chronic transfusion therapy, were enrolled during a large prospective study examining novel biomarkers in sickle cell disease, the Excellence in Hemoglobinopathy Research Award (EHRA) at Children’s Hospital of Los Angeles. Patients were free from crisis events defined as admission to the hospital or use of parenteral pain medication in the emergency room. Patients were also free from blood transfusion for at least 6 weeks. Control subjects were recruited from the community and family members of SCD patients. For this study, sickle cell trait was not considered as control. All patients enrolled had whole blood, red blood cell pellets and plasma immediately processed and frozen for storage. Samples were analyzed in batches. This study protocol was reviewed and approved by the Institutional Review Board at the Children’s Hospital of Los Angeles and Saban Research Institute.
Measurement of RBC methemoglobin
Methemoglobin percent was measured immediately after patient sample collection using whole blood and a clinical co-oximeter, Avoximeter 4000 – Instrumentation Laboratory Inc. (Bedford MA).
Measurement of GSH/GSSG and protein-S-glutathionylation (PSSG) in RBC
Total and oxidized glutathione were measured using the Tietze recycling assay as described by Irfan Rahman with mild modification21. Glutathione (GSH) in RBC was extracted using 2% sulfosalicylic acid containing 100 μM O,O-diorganyl dithiophosphoric acids (DTPA). The lysate was centrifuged at 10,000g for 10 min. The supernatant was used for the measurement of total and oxidized glutathione, while the pellet for protein-associated glutathione (PSSG) measurement. The pellet from GSH extraction was washed and protein-associated glutathione (PSSG) was released with sodium borohydride, and the released GSH was determined22.
Measurement of pyridine nucleotides tNADP and tNAD in RBC
Red blood cell NADH, tNADP (total NADPH + NADP+), and tNAD (total NADH + NAD+) were measured using commercially available assays (Abcam, Cambridge, MA). NAD+ was calculated from tNAD – NADH.
GSH homeostasis in RBC under oxidative stress
To measure the change of GSH under oxidative stress, 30% HCT RBC in Krebs-Ringer-Phosphate (KRP) buffer with glucose (5mM) was treated with 50 μM tert-butyl hydroperoxide (t-BOOH). After 5 or 10 min, RBCs were centrifuged and the tGSH (total glutathione = GSH plus 2 × GSSG) in RBC was measured.
Peroxiredoxin-2 oxidation
RBCs were diluted to 50 μM heme (total volume 11ml) in KRP buffer (PBS with CaCl2 (1.3 mM), MgSO4 (1.0 mM), HEPES (10 mM), pH 7.4 with DTPA (100 μM) and then treated with H2O2 (10 μM) for up to 30 min at 37°C. RBCs were mixed by inversion every 5–10min to limit settling. One milliliter of RBCs were sampled pre- and at 2, 5, 10 and 30 min post H2O2 addition, and rapidly (~ 10s) pelleted by centrifugation. The supernatant was removed and RBCs were treated with 100 mM NEM (100 μl in KRP buffer) for 15 min at 37°C. RBCs were then pelleted and lysed in 100 mM NEM containing SDS-PAGE sample buffer without beta-mercaptoethanol. The dimeric (disulfide) and monomeric (reduced) forms of peroxiredoxin-2 (Prx-2) were determined by Western blotting under non-reducing conditions as previously described23,24. Briefly, proteins were resolved by SDS-PAGE and transferred onto nitrocellulose. Membranes were blocked with 5% non-fat dried skimmed milk powder (w/v) in TBS-T (137 mM NaCl, 2.6 mM KCl, 0.05% Tween-20 (v/v) in 25 mM Tris-HCl pH 7.4) for 1h at room temperature and then washed with TBS-T for 30 min. Membranes were incubated with rabbit polyclonal antibody against Peroxiredoxin-2 (Abcam ab17533) followed by secondary alkaline phosphatase-linked goat anti-rabbit IgG antibody (AP132A, Millipore). Blots were developed with Duo-Lux Chemiluminescent / Fluorescent substrate (Vector Laboratories, Inc.) and sequential images collected using an Amersham Imager 600 RGB (GE healthcare Life sciences, Marlborough, MA). Quantification was performed on bands which had not reached saturation. Prx-2 oxidation was assessed by the amount of dimeric Prx-2 (MWt ~ 38 KDa) divided by the total Prx-2 (dimeric + monomeric (19 KDa) forms).
Plasma free Hb, freed heme and hemopexin (HPX)
Cell-free hemoglobin was measured in plasma via the QuantiChromTM Hemoglobin Assay Kit (BioAssay Systems, Hayward, CA)25. To measure heme released from Hb in plasma and bound to low molecular weight proteins (freed heme), the plasma was first filtered using a 30 kDa molecular weight cut-off Ultra centrifugal filter (MilliporeSigma, MA), and freed heme in the filtered plasma was measured using Hemin Assay kit (Millipore-Sigma, MA)26. In the assay, heme concentration in the plasma filtration was determined by a coupled enzyme reaction, which resulted in a colorimetric (570 nm) product, proportional to the Hemin present. The 570 nm wavelength does not detect bilirubin, a known contaminant in the plasma of SCD patients. This method does not provide the total heme in plasma as it removes the heme bound to larger proteins such as albumin and hemopexin, nor does it measure the unbound fraction of heme, which is removed by the 30kD filter. This method is selective for low molecular weight protein bound heme, including myoglobin and alpha-1-microglobulin bound heme, and is referred to as freed heme in the text. The hemopexin in plasma were quantified by ELISA instructions provided by the vendor (Abcam, MA)
Measurement of protein carbonyl in plasma and RBC using ELISA
Measurements of protein carbonyls in human plasma and RBC were performed in triplicate using ELISA kits (Cell Biolabs, CA) according to the manufacturer’s protocols. Plasma samples were diluted to 10 μg/ml; protein from RBCs was diluted to 1 mg/ml protein with PBS prior to adsorption onto ELISA plates27.
Measurement of protein carbonyl in plasma using Alexa 488 FHA
Plasma protein with protease inhibitor (Millipore Sigma, St. Louis, MO) was labeled by adding Alexa 488 Fluorescent Hydroxylamine (FHA, Invitrogen) at a concentration of 25 μg FHA/mg protein. The solution was allowed to react at room temperature for 2h. FHA-labeled proteins were separated by electrophoresis in 4–12% NuPAGE Bis-Tris gels (Thermal Fisher Scientific, Rockford, IL), and the image was subsequently captured using Syngene PXi6 imaging system (Syngene, Cambridge, UK). The same gel was stained with Coomassie Blue (Bio-Rad, Hercules, CA) for total protein quantification. The bands and stains were analyzed with ImageJ.
Measurement of plasma F2-isoprostanes
After collection (using EDTA as an anticoagulant), the blood was centrifuge at 2,000g for 10 minutes at 4°C for immediate separation of plasma, and the plasma sample was stored at −80°C for future assay. Levels of F2-isoprostanes in plasma were quantified in the Eicosanoid Core Laboratory at Vanderbilt University Medical Center using gas chromatography–mass spectrometry as previously reported28.
Statistical Analysis
Student’s T-test was used for continuous variables with normal distribution (tGSH) and Wilcoxon Rank Sum test was used for continuous data with non-normal distribution (PSSG, plasma free Hb, freed heme and hemopexin). tBOOH time-dependent changes and H2O2 time-dependent changes in Prx-2 oxidation were analyzed by 1-way repeated measures ANOVA (RM-ANOVA). Statistical analyses were performed using JMP-Pro 13 or GraphPad Prism.
Results
We examined blood and plasma samples from a total of 44 healthy subjects and 55 non-transfused patients with sickle cell disease. Not all of the patient samples underwent the same testing, and the sample size for each test is provided. The SCD cohort was slightly younger compared to healthy subjects, 23-years ± 8.8 vs 27-years ± 8.9 (P = 0.02). There were 96% SS, and 4% HgbS/β0-thal subjects in the SCD cohort. 78% of the SCD patients were on hydroxyurea at the time of the study.
Intracellular RBC redox status
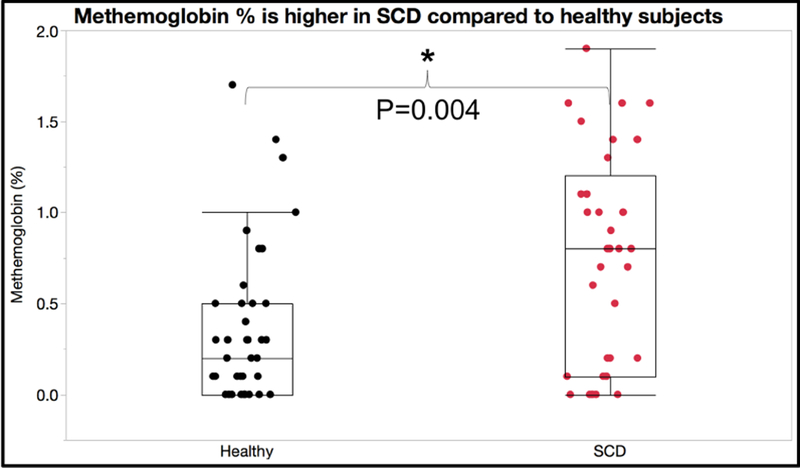
In order to confirm the presence of auto-oxidation in our samples, we examined methemoglobin levels using co-oximetry at the time of sample collection from the patient using a clinical point of care device, Avoximeter model 4000 (IL inc. Bedford MA). Figure 1 shows methemoglobin levels are elevated in SCD compared to healthy AA subjects P = 0.004 (n = 42 healthy, 37 SCD). This is consistent with increased auto-oxidation of sickle hemoglobin.
Figure 1:
Methemoglobin measured at the time of phlebotomy demonstrated higher %methemoglobin in patients with sickle cell disease.
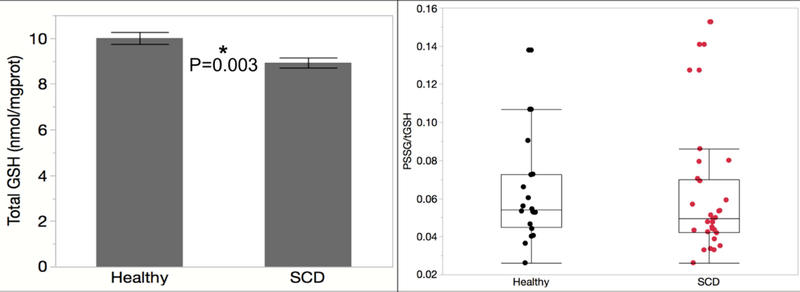
Since glutathione and NADPH are key players in RBC anti-oxidant mechanisms, we measured intracellular levels of reduced and oxidized forms as well as protein mixed disulfides, a marker of long-term oxidative stress. Figure 2A shows total glutathione (tGSH) is slightly lower in SCD compared to healthy AA subjects, P=0.002 (n=21 healthy, 30 SCD). Protein mixed disulfides in SCD RBC were insignificantly different from controls, P=0.08 (data not shown, n=22 healthy 31 SCD). Figure 2B shows there is no difference in the ratio of protein mixed disulfides:total glutathione, P=0.29 (n=20 healthy, 30 SCD). We evaluated other substrates for redox cycling and found no significant differences between healthy and SCD. NADH, tNAD or NADH/tNAD were not different in SCD compared to healthy: NADH (P = 0.14), tNAD (P = 0.32), and NADH/tNAD (P = 0.09) (n = 5 healthy, 5 SCD). There is no difference in tNADP levels (P = 0.98, n = 21 healthy, 31 SCD).
Figure 2:
This figure demonstrate that total glutathione is decreased in patients with sickle cell disease (Panel A). However, glutathionylated proteins are not different
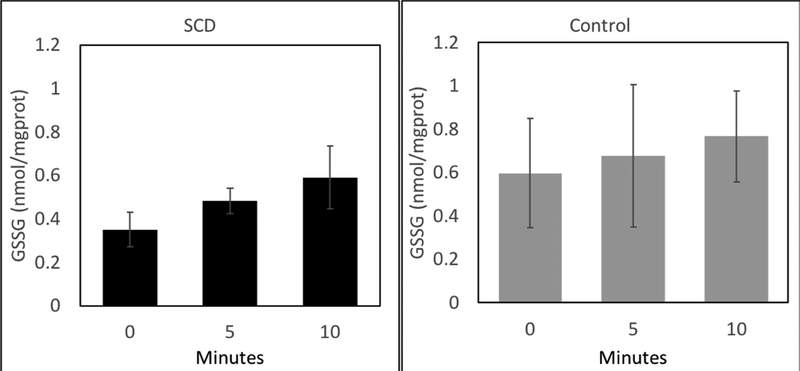
tBOOH treatment increased the rate of GSSG formation to similar extents in both control and SS RBCs. This indicates a similar ability of each RBC to handle an oxidative challenge by tBOOH (figure 3).
Figure 3:
Direct oxidative challenge of sickle cell disease erythrocytes (SCD, Panel A) and healthy AA erythrocytes (Panel B) was performed by incubating with 50uM tertiary-butyl hydroperoxide (tBOOH) and there was no difference in the rate of glutathione oxidation over 10 minutes.
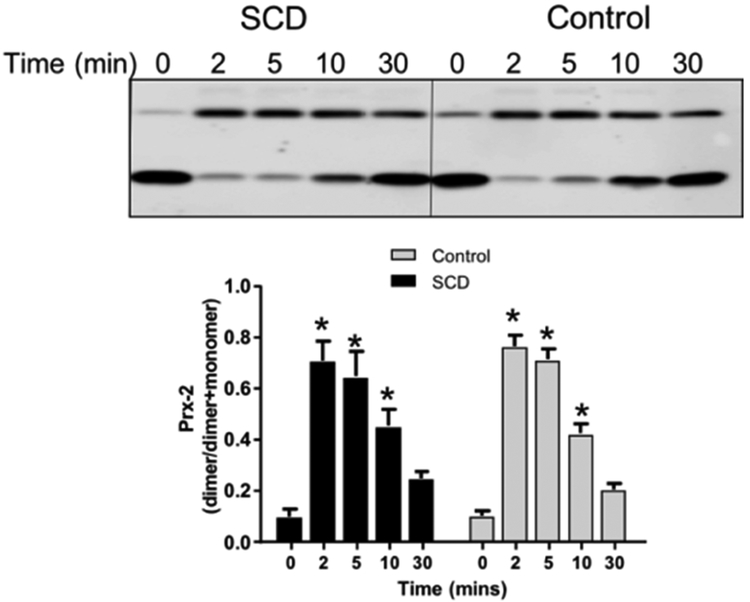
Figure 4 shows representative western blots and quantification for basal and H2O2-dependent Prx-2 oxidation. No differences in basal Prx-2 oxidation were seen between control or SCD RBCs (P=0.91 by unpaired t-test, n=5). H2O2 addition increased Prx-2 oxidation that was maximal at 2min, and returned to basal levels over 30min. No differences in Prx-2 recycling between control and SCD RBCs was observed (P>0.9 by 2-way RM-ANOVA for all time points). No differences in total Prx-2 expression was observed either (data not shown).
Figure 4:
Shown are representative western blots of Prx-2 oxidation as a function of time after challenge with H2O2. Data show Prx-2 dimer normalized to total Prx-2 (n=5). *P<0.05 relative to basal by 1-way RM-ANOVA.
Plasma redox status
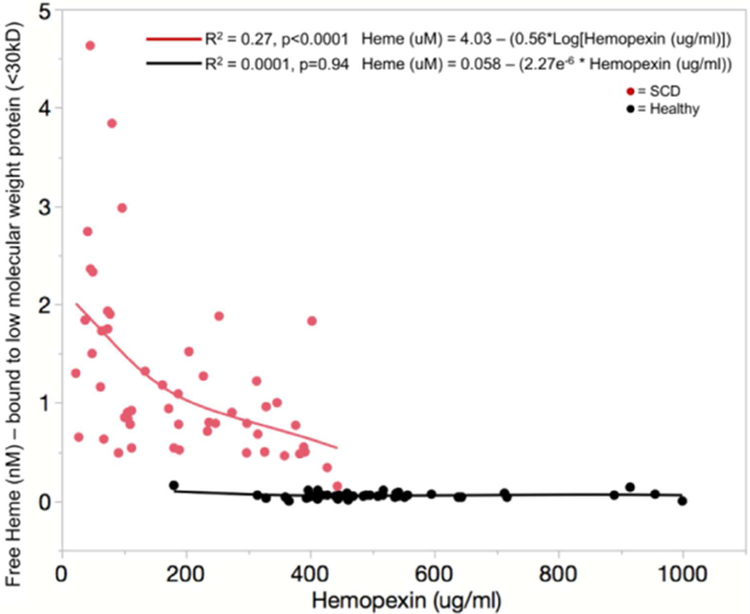
Consistent with previous work, plasma free hemoglobin P<0.0001 (n=43 healthy, 55 SCD) and freed heme P < 0.0001 (n = 43 healthy, 52 SCD) are increased in patients with sickle cell disease. Hemopexin is decreased in SCD P < 0.0001 (n = 43 healthy and 55 SCD) and is inversely related to free hemoglobin and freed heme in a non-linear manner (figure 5). There was no relationship between hemopexin, free hemoglobin and freed heme in the healthy non SCD subjects. Freed heme levels never increased above 0.2 nM plasma in the healthy subjects. However, in patients with sickle cell disease freed heme levels were at least 2–20-fold higher . Once the hemopexin level decreases below 200 μg/ml (~3.2μM) plasma, the freed heme levels quickly rise above 2 nM plasma. There is a similar relationship between free hemoglobin and hemopexin with free hemoglobin levels rising quickly once hemopexin levels decrease below 400 μg/ml (~6.3μM) plasma (data not shown). This suggests that the fraction of heme bound to small molecular weight proteins <30kD increases in SCD as hemopexin decreases.
Figure 5:
There is a significant negative, non-linear relationship between freed heme and hemopexin, which is the primary freed heme scavenger in the plasma.
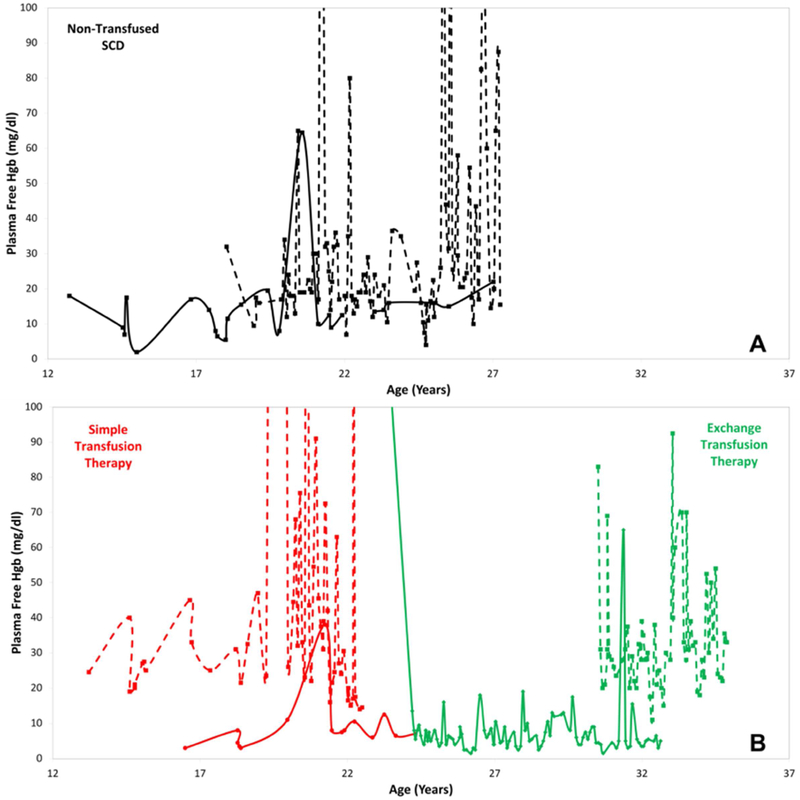
Longitudinal free hemoglobin measurements in a subset of 8 patients (4 non-transfused - black, 2 simple transfusion - red, 2 exchange transfusion - green) with sickle cell disease are displayed in figure 6. There is wide, intra-patient variation in free hemoglobin measurements over time. The qualitative appearance of these changes appear to be patient specific and not related to the therapy but we are underpowered to determine whether this is statistically significant.
Figure 6:
There is significant variability in plasma free hemoglobin measurements with some patients demonstrating very large swings in free hemoglobin and some with relatively stable free hemoglobin measurements. The upper panel is a sample of non-transfused patients with sickle cell disease. The lower panel is a sample of patients with sickle cell disease on chronic simple transfusion therapy (red) and exchange transfusion therapy (green).
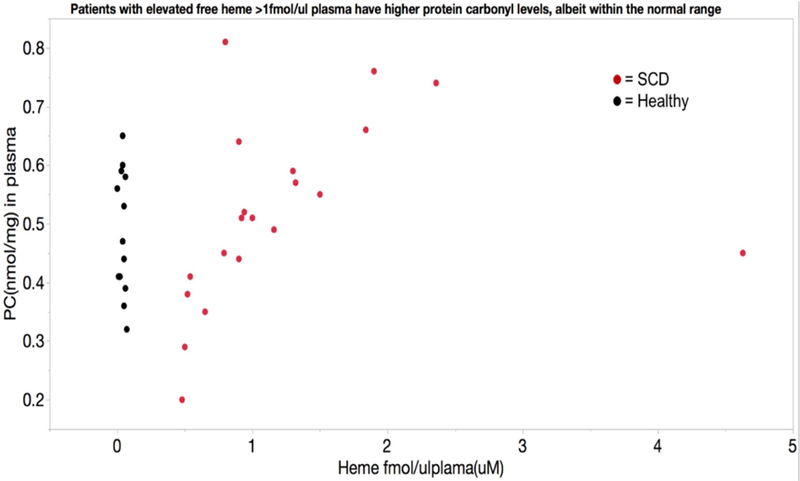
Despite the increased potential for oxidative protein damage, plasma protein carbonyls, a marker of protein oxidation that is relatively stable over time, was not elevated in patients with SCD P = 0.66 (n = 13 healthy, 23 SCD). However, within the “normal” range there was a positive association between freed heme levels and protein carbonyls in the plasma (figure 7). Plasma F2-isoprostanes, an in vivo marker of lipid peroxidation, was not elevated in SCD patients compared to healthy subjects P=0.32 (n=10 healthy and 9 SCD). Prostaglandin F2α, which can be generated via both oxidative stress as well as inflammation, was not elevated in SCD patients vs healthy subjects P=0.62 (n=11 healthy and 12 SCD).
Figure 7:
Average protein carbonyl levels, a long-term marker of intravascular oxidative stress, are not different between healthy subjects and patients with sickle cell disease. However, there is a significant relationship between plasma heme levels and protein carbonyl levels in patients with sickle cell disease, such that elevated freed heme levels predicts protein carbonyl levels at the higher end of the normal range
Discussion
Although the autoxidation of hemoglobin S increases production of O2.− inside red blood cells of patients with sickle cell disease, this appears to be compensated within the cells. Similarly, there was no evidence of intravascular oxidative stress in the plasma, despite the greatly increased free hemoglobin and freed heme in SCD. In a cohort of patients with sickle cell disease who were in a relative state of health (non-crisis), we found no clear evidence of oxidative stress within RBC despite a slight decrease in intracellular RBC glutathione and increase in methemoglobin consistent with the autoxidation of HbS. Furthermore, oxidative challenges using either tBOOH or H2O2 demonstrated normal handling of an acute oxidative stress. In the plasma, free hemoglobin and freed heme, which in our experimental method is the fraction of heme bound to small molecular weight proteins <30kD, were elevated in SCD patients compared to healthy subjects and they increase rapidly at hemopexin levels less than 200 μg/ml or 3.2μM in SCD patients. Yet, F2-isoprostanes and protein carbonyls, markers of intravascular oxidative stress, were not elevated compared to healthy subjects.
There are multiple pro-oxidants noted in sickle cell disease and multiple anti-oxidant mechanisms exist in the RBC; and this redundancy allows the cell to compensate for increased oxidant stress24,29–32. In patients with SCD there is increased dissociation of oxy-hemoglobin to methemoglobin and superoxide (O2.−) compared with controls10,11:
The O2.−generated is rapidly dismutated by superoxide dismutase:
and then H2O2 is removed by catalase:
or the action of glutathione peroxidases or peroxiredoxins:
where 2 × Prx-2 (SH) and (Prx-2 (S)2)2 represent the reduced (dithiol) and oxidized forms of peroxiredoxin-2 respectively, in which the latter is the substrate for Trx.
Glutathione is an important reductant for H2O2 removal in RBC. We found lower total glutathione, and no difference in the ratio of protein mixed disulfides to total glutathione (PSSG/tGSH) in SCD vs. healthy subjects. This finding may be explained by the export of GSSG from the cell. Griffith and colleagues demonstrated that GSSG is exported via an active Mg-ATP exporter in the RBC membrane, in addition to recycling of oxidized glutathione back to the reduced form33. Furthermore, this exporter has increased activity in sickle erythrocytes34; therefore, low tGSH concentration in the RBC is likely due to increased GSSG export. Decreased production of glutathione in SCD would not likely account for the observed differences in GSH here, as it has been shown by others that the precursors for glutathione production in SCD are normal to elevated and that the transport systems for these precursors are elevated35.
Other than the increased methemoglobin and low tGSH, our data suggests that RBC maintain adequate total pyridine nucleotide content and NADH/NAD+ ratios, which are critical substrates for normal redox cycling. We aimed to determine whether RBC mechanisms for handling an oxidative challenge were impaired by evaluating glutathione oxidation in response to RBC incubation with tert-butyl hydrogen peroxide (tBOOH), and by evaluating peroxiredoxin-2 (Prx-2) oxidation in response to H2O2 challenge. tBOOH oxidizes glutathione, and cause lipid peroxidation in human RBC in a dose dependent manner36–39. In response to tBOOH, GSSG increased in both control and SCD subjects, which is consistent with similar studies in healthy and SCD patients. It is important to note that RBC from patients with SCD tolerate oxidative stress, maintaining oxidized:reduced glutathione. Precursors for glutathione production are normal to increased, therefore, transport of GSSG out of the cell is likely to play a critical role in anti-oxidant activity and may explain the lower tGSH levels found in our study and others.
In a study of stored RBCs, Harper and colleagues demonstrated that oxidized Prx-2 increased with storage age. They also demonstrated that H2O2 dependent Prx-2 redox cycling decreased at storage ages greater than 28 days40. We evaluated Prx-2 redox cycling in a similar manner using H2O2. Neither baseline Prx-2 oxidation (time zero), H2O2 dependent Prx-2 oxidation and subsequent rate of reduction, nor total total Prx-2 levels were different between healthy and SCD patients. This demonstrates that in our cohort of patients with SCD, Prx-2 is able to redox cycle in the face of an oxidative challenge. It was unexpected that Prx-2 cycling was not different between SCD and control, but that may be due to the relative state of health of the patient. We use a very gentle RBC washing protocol but there may be some hemolysis, thus selecting for healthier RBC. Also, RBCs that are density fractionated or taken from patients in an active crisis may demonstrate abnormal Prx-2 cycling. Oxidative challenges with tBOOH and H2O2 demonstrate that RBC from patients with SCD in a period of relative health are able to compensate for an acute oxidative challenge.
NADH and NADPH act as substrates for redox cycling inside the red blood cell and we did not find any differences in levels between SCD patients and healthy subjects. This was unexpected given the previous reports of depleted NAD in sickle erythrocytes41, in which NADP levels were not significantly different from healthy but tNAD was decreased. Our data demonstrates that in the setting of mildly decreased tGSH, other redox substrates are within the normal range that would be expected to buffer acute changes. This begs the question, what is the pathophysiologic consequence of plasma oxidative stress and intracellular oxidative stress in patients with sickle cell disease? There is evidence linking low glutamine:glutamate ratio with hemolysis and pulmonary hypertension but not tGSH concentration6; and in that same publication, there was low tGSH but it was not improved in patients with higher levels of amino acid precursors. Intracellular amino acid precursor levels are actually normal to elevated in SCD, including glutamine, the precursor for pyridine nucleotides6,35,42.
Turning toward plasma oxidative stress, heme released from hemoglobin has high oxidative potential by converting H2O2 to a highly potent hydroxyl radical (OH·). We found that freed heme that is bound to low molecular weight proteins are elevated in SCD and inversely associated with hemopexin in a non-linear manner. Measurements of heme in the plasma are difficult due to bound and unbound fractions and other species, such as free hemoglobin and bilirubin, that may interfere depending on the assay being used. In 2016, Oh and colleagues demonstrated a technique whereby cell free heme and cell free hemoglobin can be measured more accurately using absorbance spectrum deconvolution with least squares fitting analysis. Our experimental method measured the fraction of heme bound to proteins <30kD, which excludes hemoglobin tetramers, unbound heme and heme bound to hemopexin and albumin; therefore, our quantification represents only a small fraction of the total heme. Further, based on the work by Oh and colleagues, our method may actually be underestimated the cell free heme in our patients. Therefore, our analysis does not represent the saturation of hemopexin in the plasma so it should not be interpreted as such. However, the relationship between our measurements of cell free heme and cell free hemoglobin and their negative association with hemopexin is an important finding that highlights the potential for the escape of heme from scavenging mechanisms that are important anti-oxidants in the vascular system. Alpha-1-microglobulin is an example of a small molecular weight protein ~30kD that functions as a heme scavenger through heme binding and transport to the kidney for degradation43–45. The clinical significance of small protein bound heme is unknown and should be the topic of further study since it appears that this fraction is significantly elevated in our patients.
If this fraction of freed heme is increased only in SCD and not healthy subjects, we expected that those patients with the highest freed heme and lowest hemopexin levels would have signs of plasma and vascular oxidative damage. To determine this, we measured plasma protein carbonyls, F2-isoprostanes and prostaglandin-F2 alpha. There was no increase in isoprostanes or prostaglandins. There was no difference in the absolute value of plasma protein carbonyls between control and SCD; however, when regressing protein carbonyls against freed heme levels, there was a direct association in SCD patients but not control. We have learned from the iron overload literature that a single level of iron and ferritin may provide some insight into their disease state, but the more important determinant for end-organ loading of iron may be the amount of time that free iron escapes scavenging mechanisms46. If free hemoglobin levels are above 100 mg/dl for prolonged periods of time, scavenging mechanisms may be saturated and the patient may be at higher risk for prolonged effects of free hemoglobin, freed heme and free iron. Free hemoglobin, freed heme and free iron can all lead to cellular stress, cellular damage and end-organ dysfunction, including the endothelium15,47,48. Thus, our data provides some insight into free hemoglobin/freed heme related oxidative stress; but, future assessment should include longitudinal measures that better capture the various fractions of heme, both bound and unbound.
Oxidative stress is defined as an imbalance of pro-oxidants and anti-oxidants. Our findings do not refute the large body of literature that has described oxidative stress in specific biological pathways, particularly with regard to sickle cell disease7,49,50. Klings and colleagues demonstrated an increase in F2 isoprostanes in patients during acute chest syndrome, which is supportive of the role of endothelial damage in acute chest51. Specific pathways have been described as effectors of oxidant stress, particularly with regard to the role of inflammation in sickle cell vascular disease52–56. It should be noted that some of the previous studies were aimed at understanding changes during acute episodes, including acute chest syndrome; our study was done during a period of relative health. Manfredini and colleagues described an increase in glutathione peroxidase and catalase in RBC from patients with SCD, while at “steady state”57.
Elevation in those enzymes are the compensatory response we would expect in order for the system to remain in balance. Lastly, our work also supports previous work demonstrating that the auto-oxidation of hemoglobin-S increases superoxide production and the recent FDA approval of glutamine supplementation in sickle cell disease9. Non-specific measures of reactive oxygen species and oxidative stress using fluorescent dyes, MDA or AOPP have been used to demonstrate oxidant stress58; however, a publication by many of the editors of Free Radical Biology and Medicine cautioned the interpretation of non-specific tests with the aim of focusing on specific pathways that are impacted by oxidant stress, as in the publications noted above.
The cross-sectional study design is an important limitation, particularly after the longitudinal plasma free hemoglobin data demonstrated the dynamic nature of plasma free hemoglobin levels, or vascular oxidative stress. To better understand plasma and erythrocyte oxidative stress, longitudinal data and experimental designs based on oxidative challenges are critical. Our inclusion of both longitudinal data analysis and acute oxidative challenge improve our ability to study the dynamic nature of this problem. Processing of blood specimens from patients with SCD also present unique challenges. Despite going to great lengths to minimize damage to RBC from patients with SCD, there may be some degree of hemolysis in the most fragile cells. This would skew the results of our oxidative challenge to favor the healthier RBC.
Conclusion
Despite the increased autoxidation and release of hemoglobin into plasma in patients with sickle cell disease, during periods of relative health, there is no indication of uncompensated oxidative stress within the RBC or plasma. Furthermore, RBC from relatively healthy SCD patients tolerate acute oxidative challenge as well as control RBC.
Glutathione is mildly decreased compensating for RBC oxidative stress
An acute oxidative challenge is handled by RBC anti-oxidant mechanisms
Free hemoglobin and freed heme in the plasma stress vascular health, but
Plasma isoprostanes are not significantly elevated despite chronic hemolysis
Scavenging of free hemoglobin and freed heme work to limit vascular damage
Acknowledgements
This work was supported by a grant from the National Institutes of Health, National Heart Lung and Blood Institute (NIH# 1 U54 HL090511–01)(T.C.):Sickle Cell Scholar Award; (5 RC1 HL099412–01)(J.D.), K12 scholar award (2 K12 HD 52954–6 A1)(J.D.), K23 mentored career development award (1K23HL119627–01A1)(J.D.) and (1R03HL138321–01)(J.D.); (1U01HL117718–01)(T.D.C. , J.C.W., and M.C.K.); National Institute of Biomedical Imaging and Bioengineering (P41 EB001978) (M.C.K.), and by the Children’s Hospital Los Angeles General Clinical Research Center (NIH #RR00043–43)(J.D.)
Abbreviations:
- tGSH
sum of GSH + 2 × GSSG
- tNAD
sum of NADH + NAD+
- tNADP
sum of NADPH + NADP+
- SCD
sickle cell disease
- HPX
hemopexin
- tBOOH
tertiary-butylhydroperoxide
Footnotes
Publisher's Disclaimer: This is a PDF file of an unedited manuscript that has been accepted for publication. As a service to our customers we are providing this early version of the manuscript. The manuscript will undergo copyediting, typesetting, and review of the resulting proof before it is published in its final citable form. Please note that during the production process errors may be discovered which could affect the content, and all legal disclaimers that apply to the journal pertain.
References
- 1.Harris JW. Studies on the destruction of red blood cells. VIII. Molecular orientation in sickle cell hemoglobin solutions. Proc Soc Exp Biol Med. 1950;75(1):197–201. [DOI] [PubMed] [Google Scholar]
- 2.Ingram VM. A specific chemical difference between the globins of normal human and sickle-cell anaemia haemoglobin. Nature. 1956;178(4537):792–794. [DOI] [PubMed] [Google Scholar]
- 3.Itano HA, Pauling L. A rapid diagnostic test for sickle cell anemia. Blood. 1949;4(1):66–68. [PubMed] [Google Scholar]
- 4.Pauling L, Itano HA, et al. Sickle cell anemia a molecular disease. Science. 1949;110(2865):543–548. [DOI] [PubMed] [Google Scholar]
- 5.Singer K, Singer L. Studies on abnormal hemoglobins. VIII. The gelling phenomenon of sickle cell hemoglobin: its biologic and diagnostic significance. Blood. 1953;8(11):1008–1023. [PubMed] [Google Scholar]
- 6.Morris CR, Suh JH, Hagar W, et al. Erythrocyte glutamine depletion, altered redox environment, and pulmonary hypertension in sickle cell disease. Blood. 2008;111(1):402–410. [DOI] [PMC free article] [PubMed] [Google Scholar]
- 7.Nur E, Biemond BJ, Otten HM, Brandjes DP, Schnog JJ, Group CS. Oxidative stress in sickle cell disease; pathophysiology and potential implications for disease management. Am J Hematol. 2011;86(6):484–489. [DOI] [PubMed] [Google Scholar]
- 8.Reid M, Badaloo A, Forrester T, Jahoor F. In vivo rates of erythrocyte glutathione synthesis in adults with sickle cell disease. Am J Physiol Endocrinol Metab. 2006;291(1):E73–79. [DOI] [PubMed] [Google Scholar]
- 9.Niihara Y, Miller ST, Kanter J, et al. A Phase 3 Trial of l-Glutamine in Sickle Cell Disease. N Engl J Med. 2018;379(3):226–235. [DOI] [PubMed] [Google Scholar]
- 10.Hebbel RP, Morgan WT, Eaton JW, Hedlund BE. Accelerated autoxidation and heme loss due to instability of sickle hemoglobin. Proc Natl Acad Sci U S A. 1988;85(1):237–241. [DOI] [PMC free article] [PubMed] [Google Scholar]
- 11.Sheng K, Shariff M, Hebbel RP. Comparative oxidation of hemoglobins A and S. Blood. 1998;91(9):3467–3470. [PubMed] [Google Scholar]
- 12.George A, Pushkaran S, Konstantinidis DG, et al. Erythrocyte NADPH oxidase activity modulated by Rac GTPases, PKC, and plasma cytokines contributes to oxidative stress in sickle cell disease. Blood. 2013;121(11):2099–2107. [DOI] [PMC free article] [PubMed] [Google Scholar]
- 13.Nagababu E, Fabry ME, Nagel RL, Rifkind JM. Heme degradation and oxidative stress in murine models for hemoglobinopathies: thalassemia, sickle cell disease and hemoglobin C disease. Blood Cells Mol Dis. 2008;41(1):60–66. [DOI] [PMC free article] [PubMed] [Google Scholar]
- 14.Barodka VM, Nagababu E, Mohanty JG, et al. New insights provided by a comparison of impaired deformability with erythrocyte oxidative stress for sickle cell disease. Blood Cells Mol Dis. 2014;52(4):230–235. [DOI] [PubMed] [Google Scholar]
- 15.Gladwin MT, Sachdev V, Jison ML, et al. Pulmonary hypertension as a risk factor for death in patients with sickle cell disease. N Engl J Med. 2004;350(9):886–895. [DOI] [PubMed] [Google Scholar]
- 16.Aslan M, Ryan TM, Adler B, et al. Oxygen radical inhibition of nitric oxide-dependent vascular function in sickle cell disease. Proc Natl Acad Sci U S A. 2001;98(26):15215–15220. [DOI] [PMC free article] [PubMed] [Google Scholar]
- 17.Powars DR, Conti PS, Wong WY, et al. Cerebral vasculopathy in sickle cell anemia: diagnostic contribution of positron emission tomography. Blood. 1999;93(1):71–79. [PubMed] [Google Scholar]
- 18.Belhassen L, Pelle G, Sediame S, et al. Endothelial dysfunction in patients with sickle cell disease is related to selective impairment of shear stress-mediated vasodilation. Blood. 2001;97(6):1584–1589. [DOI] [PubMed] [Google Scholar]
- 19.Detterich JA, Kato RM, Rabai M, Meiselman HJ, Coates TD, Wood JC. Chronic transfusion therapy improves but does not normalize systemic and pulmonary vasculopathy in sickle cell disease. Blood. 2015;126(6):703–710. [DOI] [PMC free article] [PubMed] [Google Scholar]
- 20.Manwani D, Frenette PS. Vaso-occlusion in sickle cell disease: pathophysiology and novel targeted therapies. Hematology Am Soc Hematol Educ Program. 2013;2013:362–369. [DOI] [PubMed] [Google Scholar]
- 21.Rahman I, Kode A, Biswas SK. Assay for quantitative determination of glutathione and glutathione disulfide levels using enzymatic recycling method. Nat Protoc. 2006;1(6):3159–3165. [DOI] [PubMed] [Google Scholar]
- 22.Aesif SW, Kuipers I, van der Velden J, et al. Activation of the glutaredoxin-1 gene by nuclear factor kappaB enhances signaling. Free Radic Biol Med. 2011;51(6):1249–1257. [DOI] [PMC free article] [PubMed] [Google Scholar]
- 23.Vitturi DA, Sun CW, Harper VM, et al. Antioxidant functions for the hemoglobin beta93 cysteine residue in erythrocytes and in the vascular compartment in vivo. Free Radic Biol Med. 2013;55:119–129. [DOI] [PMC free article] [PubMed] [Google Scholar]
- 24.Low FM, Hampton MB, Peskin AV, Winterbourn CC. Peroxiredoxin 2 functions as a noncatalytic scavenger of low-level hydrogen peroxide in the erythrocyte. Blood. 2007;109(6):2611–2617. [DOI] [PubMed] [Google Scholar]
- 25.Meyer C, Heiss C, Drexhage C, et al. Hemodialysis-induced release of hemoglobin limits nitric oxide bioavailability and impairs vascular function. J Am Coll Cardiol. 2010;55(5):454–459. [DOI] [PubMed] [Google Scholar]
- 26.Shamloul R, Wang R. Monitoring circulatory heme level in hemin therapy for lowering blood pressure in rats. Cell Mol Biol (Noisy-le-grand). 2005;51(5):507–512. [PubMed] [Google Scholar]
- 27.Augustyniak E, Adam A, Wojdyla K, et al. Validation of protein carbonyl measurement: a multi-centre study. Redox Biol. 2015;4:149–157. [DOI] [PMC free article] [PubMed] [Google Scholar]
- 28.Milne GL, Gao B, Terry ES, Zackert WE, Sanchez SC. Measurement of F2- isoprostanes and isofurans using gas chromatography-mass spectrometry. Free Radic Biol Med. 2013;59:36–44. [DOI] [PMC free article] [PubMed] [Google Scholar]
- 29.Beauchamp C, Fridovich I. Superoxide dismutase: improved assays and an assay applicable to acrylamide gels. Anal Biochem. 1971;44(1):276–287. [DOI] [PubMed] [Google Scholar]
- 30.Paglia DE, Valentine WN. Studies on the quantitative and qualitative characterization of erythrocyte glutathione peroxidase. J Lab Clin Med. 1967;70(1):158–169. [PubMed] [Google Scholar]
- 31.Aebi H Catalase in vitro. Methods Enzymol. 1984;105:121–126. [DOI] [PubMed] [Google Scholar]
- 32.Mendiratta S, Qu ZC, May JM. Enzyme-dependent ascorbate recycling in human erythrocytes: role of thioredoxin reductase. Free Radic Biol Med. 1998;25(2):221–228. [DOI] [PubMed] [Google Scholar]
- 33.Griffith OW. Biologic and pharmacologic regulation of mammalian glutathione synthesis. Free Radic Biol Med. 1999;27(9–10):922–935. [DOI] [PubMed] [Google Scholar]
- 34.Nur E, Verwijs M, de Waart DR, et al. Increased efflux of oxidized glutathione (GSSG) causes glutathione depletion and potentially diminishes antioxidant defense in sickle erythrocytes. Biochim Biophys Acta. 2011;1812(11):1412–1417. [DOI] [PubMed] [Google Scholar]
- 35.Kiessling K, Roberts N, Gibson JS, Ellory JC. A comparison in normal individuals and sickle cell patients of reduced glutathione precursors and their transport between plasma and red cells. Hematol J. 2000;1(4):243–249. [DOI] [PubMed] [Google Scholar]
- 36.Roy A, Sil PC. Tertiary butyl hydroperoxide induced oxidative damage in mice erythrocytes: Protection by taurine. Pathophysiology. 2012;19(2):137–148. [DOI] [PubMed] [Google Scholar]
- 37.Dremza IK, Lapshina EA, Kujawa J, Zavodnik IB. Oxygen-related processes in red blood cells exposed to tert-butyl hydroperoxide. Redox Rep. 2006;11(4):185–192. [DOI] [PubMed] [Google Scholar]
- 38.Domanski AV, Lapshina EA, Zavodnik IB. Oxidative processes induced by tert-butyl hydroperoxide in human red blood cells: chemiluminescence studies. Biochemistry (Mosc). 2005;70(7):761–769. [DOI] [PubMed] [Google Scholar]
- 39.Ishida YI, Takikawa M, Suzuki T, Nagahama M, Ogasawara Y. Irreversible hyperoxidation of peroxiredoxin 2 is caused by tert-butyl hydroperoxide in human red blood cells. FEBS Open Bio. 2014;4:848–852. [DOI] [PMC free article] [PubMed] [Google Scholar]
- 40.Harper VM, Oh JY, Stapley R, et al. Peroxiredoxin-2 recycling is inhibited during erythrocyte storage. Antioxid Redox Signal. 2015;22(4):294–307. [DOI] [PMC free article] [PubMed] [Google Scholar]
- 41.Zerez CR, Lachant NA, Lee SJ, Tanaka KR. Decreased erythrocyte nicotinamide adenine dinucleotide redox potential and abnormal pyridine nucleotide content in sickle cell disease. Blood. 1988;71(2):512–515. [PubMed] [Google Scholar]
- 42.Niihara Y, Zerez CR, Akiyama DS, Tanaka KR. Increased red cell glutamine availability in sickle cell anemia: demonstration of increased active transport, affinity, and increased glutamate level in intact red cells. J Lab Clin Med. 1997;130(1):83–90. [DOI] [PubMed] [Google Scholar]
- 43.Allhorn M, Berggard T, Nordberg J, Olsson ML, Akerstrom B. Processing of the lipocalin alpha(1)-microglobulin by hemoglobin induces heme-binding and heme-degradation properties. Blood. 2002;99(6):1894–1901. [DOI] [PubMed] [Google Scholar]
- 44.Ekstrom B, Peterson PA, Berggard I. A urinary and plasma alpha1-glycoprotein of low molecular weight: isolation and some properties. Biochem Biophys Res Commun. 1975;65(4):1427–1433. [DOI] [PubMed] [Google Scholar]
- 45.Olsson MG, Allhorn M, Bulow L, et al. Pathological conditions involving extracellular hemoglobin: molecular mechanisms, clinical significance, and novel therapeutic opportunities for alpha(1)-microglobulin. Antioxid Redox Signal. 2012;17(5):813–846. [DOI] [PubMed] [Google Scholar]
- 46.Noetzli LJ, Carson SM, Nord AS, Coates TD, Wood JC. Longitudinal analysis of heart and liver iron in thalassemia major. Blood. 2008;112(7):2973–2978. [DOI] [PMC free article] [PubMed] [Google Scholar]
- 47.Saraf SL, Zhang X, Shah B, et al. Genetic variants and cell-free hemoglobin processing in sickle cell nephropathy. Haematologica. 2015;100(10):1275–1284. [DOI] [PMC free article] [PubMed] [Google Scholar]
- 48.Kato GJ, Steinberg MH, Gladwin MT. Intravascular hemolysis and the pathophysiology of sickle cell disease. J Clin Invest. 2017;127(3):750–760. [DOI] [PMC free article] [PubMed] [Google Scholar]
- 49.Hebbel RP, Vercellotti G, Nath KA. A systems biology consideration of the vasculopathy of sickle cell anemia: the need for multi-modality chemo-prophylaxsis. Cardiovasc Hematol Disord Drug Targets. 2009;9(4):271–292. [DOI] [PMC free article] [PubMed] [Google Scholar]
- 50.Telen MJ, Malik P, Vercellotti GM. Therapeutic strategies for sickle cell disease: towards a multi-agent approach. Nat Rev Drug Discov. 2019;18(2):139–158. [DOI] [PMC free article] [PubMed] [Google Scholar]
- 51.Klings ES, Christman BW, McClung J, et al. Increased F2 isoprostanes in the acute chest syndrome of sickle cell disease as a marker of oxidative stress. Am J Respir Crit Care Med. 2001;164(7):1248–1252. [DOI] [PubMed] [Google Scholar]
- 52.Gladwin MT, Ofori-Acquah SF. Erythroid DAMPs drive inflammation in SCD. Blood. 2014;123(24):3689–3690. [DOI] [PMC free article] [PubMed] [Google Scholar]
- 53.Manwani D, Frenette PS. Vaso-occlusion in sickle cell disease: pathophysiology and novel targeted therapies. Blood. 2013;122(24):3892–3898. [DOI] [PMC free article] [PubMed] [Google Scholar]
- 54.Escribano-Lopez I, Diaz-Morales N, Iannantuoni F, et al. The mitochondrial antioxidant SS-31 increases SIRT1 levels and ameliorates inflammation, oxidative stress and leukocyte-endothelium interactions in type 2 diabetes. Sci Rep. 2018;8(1):15862. [DOI] [PMC free article] [PubMed] [Google Scholar]
- 55.Vasconcellos LR, Dutra FF, Siqueira MS, et al. Protein aggregation as a cellular response to oxidative stress induced by heme and iron. Proc Natl Acad Sci U S A. 2016;113(47):E7474–E7482. [DOI] [PMC free article] [PubMed] [Google Scholar]
- 56.Winterbourn CC, Kettle AJ, Hampton MB. Reactive Oxygen Species and Neutrophil Function. Annu Rev Biochem. 2016;85:765–792. [DOI] [PubMed] [Google Scholar]
- 57.Manfredini V, Lazzaretti LL, Griebeler IH, et al. Blood antioxidant parameters in sickle cell anemia patients in steady state. J Natl Med Assoc. 2008;100(8):897–902. [DOI] [PubMed] [Google Scholar]
- 58.Chirico EN, Pialoux V. Role of oxidative stress in the pathogenesis of sickle cell disease.IUBMB Life. 2012;64(1):72–80. [DOI] [PubMed] [Google Scholar]


