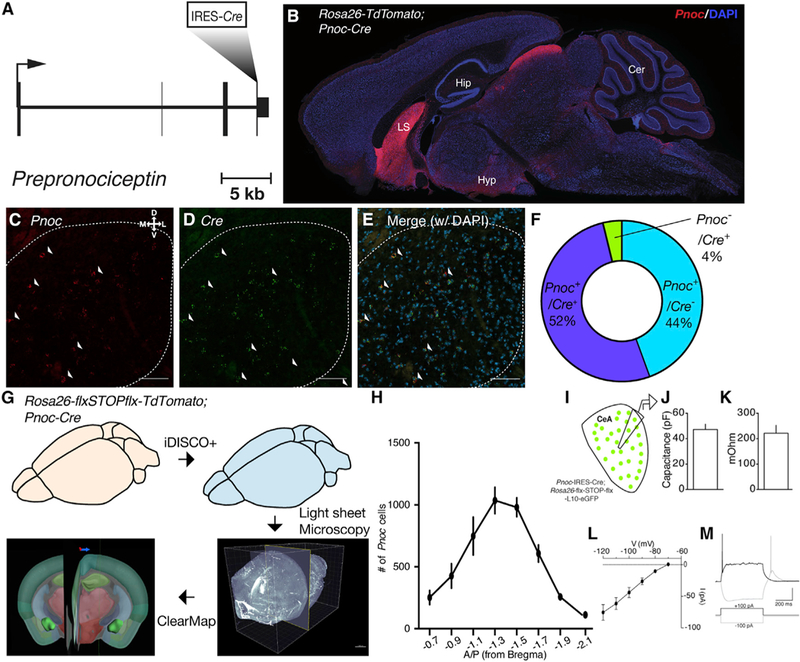
Figure 1. PnocCeA Neurons Are Activated following Palatable, Calorically Dense Food Consumption.

(A)Schematic of targeting of IRES-Cre cassette into the endogenous Prepronociceptin gene.
(B)Sagittal section of PnocIRES-Cre; Rosa26-flx-stop-fIx-TdTomato (AI9) mice.
(C–E) Example images of Pnoc (C; red), Cre (D; green), and merge (E) mRNA expression in the CeA. Scale bars represent 50 μM.
(F)Quantification of Pnoc, Cre, and double-positive cell counts across all CeA images.
(G)Schematic of tissue clearing, IDISCO+, light sheet microscopy, and ClearMap workflow in PnocIRES-Cre; AI9 mice.
(H)Quantification of Pnoc+ cells across the A-P axis following extraction of segmented Pnoc cell coordinates after ClearMap.
(I)Schematic of ex vivo recordings of Pnoc-GFP reporter mice.
(J) Average membrane capacitance (Cm) of Pnoc neurons.
(K) Average membrane resistance (Rm) of Pnoc neurons.
(L) Hyperpolarization-activated inward (Ih) currents in Pnoc neurons.
(M) Example low-threshold bursting in response to depolarizing current step.
For (J) and (K), n = 13 cells from 3 mice.
