

Abstract
All innate lymphoid cells (ILC) require the small helix-loop-helix transcription factor ID2 but the functions of ID2 are not well understood in these cells. Here we show that mature natural killer (NK) cells, the prototypic ILC, developed in mice lacking ID2 but remained as precursor CD27+CD11b− cells that failed to differentiate into CD27−CD11b+ cytotoxic effectors. We show that ID2 limited chromatin accessibility at E protein binding sites near naïve T lymphocyte-associated genes including multiple chemokine receptors, cytokine receptors, and signaling molecules and altered the NK cell response to inflammatory cytokines. In the absence of ID2, CD27+CD11b− NK cells expressed ID3, a helix-loop-helix protein associated with naïve T cells, and they transitioned from a CD8 memory-precursor-like to a naïve-like chromatin accessibility state. We demonstrate that ID3 was required for the development of ID2-deficient NK cells indicating that completely unfettered E protein function is incompatible with NK cell development. These data solidify the roles of ID2 and ID3 as mediators of effector and naïve gene programs, respectively, and revealed a critical role for ID2 in promoting a chromatin state and transcriptional program in CD27+CD11b− NK cells that supports cytotoxic effector differentiation and cytokine responses.
One Sentence Summary:
NK cell maturation depends on transcription factor ID2 blocking acquisition of a naïve T cell gene program
INTRODUCTION
Natural killer (NK) cells, the first innate lymphoid cells (ILC) to be identified, are best known for their ability to kill virus-infected and cancer cells through direct cytotoxicity and their production of inflammatory cytokines such as IFN-γ and TNF (1). NK cells are also key mediators of antibody-dependent cellular cytotoxicity and have been implicated in the control of immune system homeostasis through their ability to kill immature dendritic cells and T cells during the declining phase of the immune response (2). In contrast to the helper-ILCs, which function as innate counterparts to distinct CD4 subsets, NK cells appear to be the innate counterpart of CD8 T lymphocytes (1). CD8 T cells can be identified as naïve antigen inexperienced cells, terminally differentiated effector (TE) cells that arise days after encounter with antigen, or memory-precursor (MP) and memory cells, which persist long after an infection has been eliminated (3). In contrast, NK cells exist in a chronically “primed” state and can be rapidly induced to produce cytokines or to kill target cells. In humans, NK cells exist in two “flavors”; a cytotoxic CD56−CD16+ subset and a regulatory or “helper-like” CD56+CD16− subset that produces large quantities of multiple cytokines but is less efficient in cytotoxicity (4). In the mouse, the majority of NK cells are capable of cytotoxicity but cytokine-only producing NK cells have been identified in the thymus and as an intermediate in NK cell differentiation (5, 6). Indeed, three subsets of mature NK cells have been identified with a precursor-progeny relationship defined by the expression of CD27 and CD11b; progressing from CD27+CD11b− to CD27+CD11b+ to CD27−CD11b+ cells. The CD27+CD11b− subset is highly primed for cytokine production with low cytotoxic potential, whereas the CD27−CD11b+ subset also displays robust cytotoxicity (5). NK cells are also capable of forming memory cells that are similar to CD8 T effector memory cells, and these NK memory cells arise from KLRG1− progenitors, the majority of which are present in the CD27+CD11b− population (7, 8).
The production of mature NK cells requires the coordinated activity of multiple transcription factors including the T-box transcription factors TBET and EOMES, NFIL3, TOX1, ETS1, and ID2 (9). ID2 is a small helix-loop-helix protein that is expressed in all ILCs and is induced during the development of CD8 TE cells (10, 11). ID2 binds to the E protein transcription factors and prevents their ability to interact with DNA, although other targets of ID2 have been identified (12). The E proteins are essential for normal B and T cell development and they regulate essential components of the adaptive lymphoid gene program (13, 14). Recently, ID2 was shown to regulate the survival of CD11b+ NK cells by preventing the E protein-mediated induction of the suppressor of cytokine signaling protein SOCS3 thereby promoting responsiveness to the cytokine interleukin (IL)-15 (15). However, when ID2 first becomes essential during NK cell development and whether its role is limited to the IL-15 response remains to be determined.
Here we used multiple models of ID2-defciency in NK cells combined with gene expression profiling and ATAC-seq to understand the mechanisms by which ID2 supports NK cell development. We found that ID2 limited the expression of genes encoding multiple T cell-associated chemokine receptors, cytokine receptors, and signaling molecules and limited DNA accessibility at E protein binding sites near these genes. A comparison of ATAC-seq data from ID2-deficient or ID2-sufficient NK cells and CD8 T cell subsets revealed that ID2 maintained a CD8 MP-like chromatin accessibility program in CD27+CD11b− NK cells and prevented E proteins from promoting a state akin to that of naïve CD8 T cells. We also found that the ID2-repressed naïve-like state required ID3, a protein that maintains the naive program in T lymphocytes (16). Our findings reveal a critical role for ID2 in preventing a naïve-like chromatin state in NK cells, a role that may be relevant for other members of the ILC family.
RESULTS
ID2 promoted the development of CD11b+ NK cells
To gain insight into the functions of ID2 in NK cells we examined Gzmb-Cre Id2f/f mice on a C57Bl/6 Rag1−/− background (hereafter called RId2−/− mice). In these mice Id2 was broadly deleted in all hematopoietic cells including in the bone marrow (BM), spleen, and in hematopoietic stem and progenitor cells, consistent with the ability of Gzmb-Cre to delete in hematopoietic stem cells (17, 18). Liver ILC1 and BM ILC2 were absent in RId2−/− mice confirming the broad deletion of Id2 (Fig. S1A−D). Consistent with studies in Id2−/− mice (19, 20), the frequency and number of NK cells was dramatically reduced in the spleen of RId2−/− mice compared to control Rag1−/− mice (Ctrl) (Fig. 1A, B). Liver NK cells were also reduced in the absence of ID2 (Fig. 1A). In contrast, BM NK cell frequencies and numbers were similar to Ctrl (Fig. 1A, B). RId2−/− BM NK cells expressed EOMES confirming that they were NK cells and not ILC1 and they had deleted Id2 as determined by PCR of genomic DNA (Fig. 1C and D).
Fig. 1. ID2 was required for NK cell differentiation.
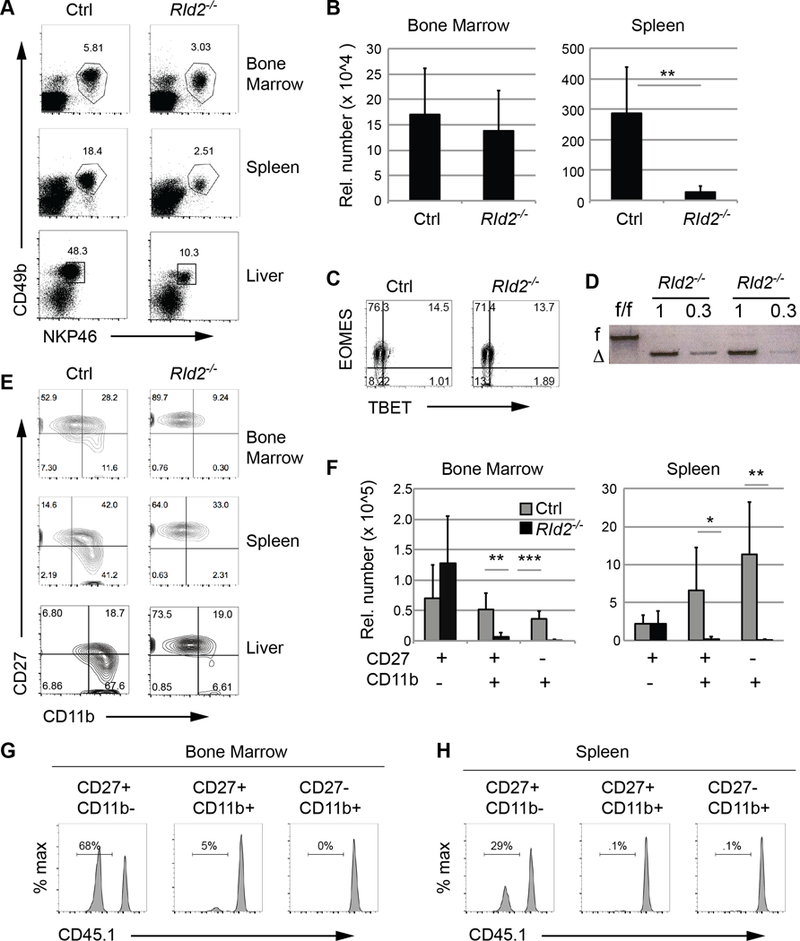
(A) The frequency of NKP46+CD49b+ NK cells among Lin− (Ter119−Gr1−) lymphoid cells was determined in the BM, spleen, and liver of Ctrl or RId2−/− mice by flow cytometry. Representative plots are shown with NK cell frequencies indicated. (B) Bar graphs showing the number of Lin−NKP46+CD49b+ NK cells/ 3 × 10⁷ cells in the BM or spleen of Ctrl or RId2−/− mice + S.D. N > 7. (C) EOMES and TBET in BM Lin−NKP46+CD49b+ NK cells from Ctrl and RId2−/− mice. Representative of 5 experiments. (D) Semi-quantitative PCR for the deleted and floxed alleles of Id2 in genomic DNA isolated from Lin−NKP46+CD49b+ BM NK cells of two RId2−/− mice. Two concentrations of DNA were tested as indicated. DNA from RId2f/f mice is also shown. (E) Lin−NKP46+CD49b+ NK cells from the BM, spleen, and liver of Ctrl and RId2−/− mice were examined for CD27 and CD11b by flow cytometry. (F) Bar graphs showing the average number of CD27+CD11b−, CD27+CD11b+, and CD27−CD11b+ NK cells/ 3 × 10⁷ cells in the BM and spleen of Ctrl and RId2−/− mice. N= 7. (G, H) Chimeric mice created with RId2−/− (CD45.2+) and wild-type CD45.1+ BM and analyzed 8 weeks post reconstitution. The frequency of CD45.1− cells among the indicated NK cell subsets in the BM and spleen is shown. Representative of 3 experiments. ** P<0.01, *** P<0.001.
We next tested whether RId2−/− NK cells matured normally by examining CD27 and CD11b. In contrast to Ctrl NK cells, the majority of RId2−/− NK cells in the BM, spleen and liver were CD27+CD11b− and there were few cells that were CD27+CD11b+ or CD27−CD11b+ (Fig. 1E). The total number of CD27+CD11b− NK cells in the BM and spleen was similar to or greater than that in Ctrl mice (Fig. 1F). CD27+CD11b+ and CD27−CD11b+ NK cells also failed to develop in chimeric mice in which RId2−/− hematopoietic cells were in competition with CD45.1+ wild-type (WT) cells indicating that the arrest in differentiation was intrinsic to RId2−/− NK cells (Fig. 1G, H). Importantly, RId2−/− CD27+CD11b− NK cells were present in the BM and spleen of chimeric mice despite the presence of WT competitor cells (Fig. 1G, H). A similar arrest in NK cell maturation was observed when Id2 was deleted at the mature NK cell stage using Ncr1Cre regardless of whether the mice were Rag1−/− or Rag1+/+ (Fig. S1D−H). Taken together, our data indicate that mature NK cells can develop in the absence of ID2 but they have an intrinsic inability to differentiate into CD11b+ cells.
RId2−/− BM CD27+CD11b− NK cells displayed a differentiation-associated quiescence program but retained IL-15 responsiveness
We examined gene expression profiles in RId2−/− and Ctrl NK cells to gain insight into the role of ID2 in NK cell differentiation. Because CD11b+ NK cells were absent in RId2−/− mice, we compared gene expression in RId2−/− and Ctrl BM CD27+CD11b− NK cells. We identified 351 and 1070 probe sets that were differentially expressed by more than 2- or 1.5-fold (P < 0.05), respectively, with a majority showing decreased expression in RId2−/− cells (Fig. 2A). The transcripts that decreased were enriched for the KEGG pathways “Cell Cycle” (p=2.5E-16) and “DNA Repair” (p=3.3E-11) as determined by the DAVID Functional Annotation Tool (21, 22). Previously published data revealed a set of cell cycle genes that decreased during NK cell differentiation (5), all of which were decreased in RId2−/− CD27+CD11b− NK cells suggesting that this program was intact but was dissociated from CD11b expression (Fig. 2B). One of the genes in this program encodes the cell cycle indicator KI67 and FACS analysis revealed that fewer CD27+CD11b− NK cells from the BM of RId2−/− expressed KI67 as compared to Ctrl mice (Fig. 2C, E). In contrast, there was no difference in the frequency of KI67+ cells among NK cells in the spleen (Fig. 2D, F). The majority of BM and spleen CD27+CD11b− NK cells were KI67+ three days after injection of IL-2 or polyI:C indicating that RId2−/− NK cells were able to enter the cell cycle in response to IL-2 or cytokines elicited from dendritic cells after polyI:C treatment (Fig. 2C−F).
Fig. 2. RId2−/− NK cells proliferate in response to IL-2 or IL-15.
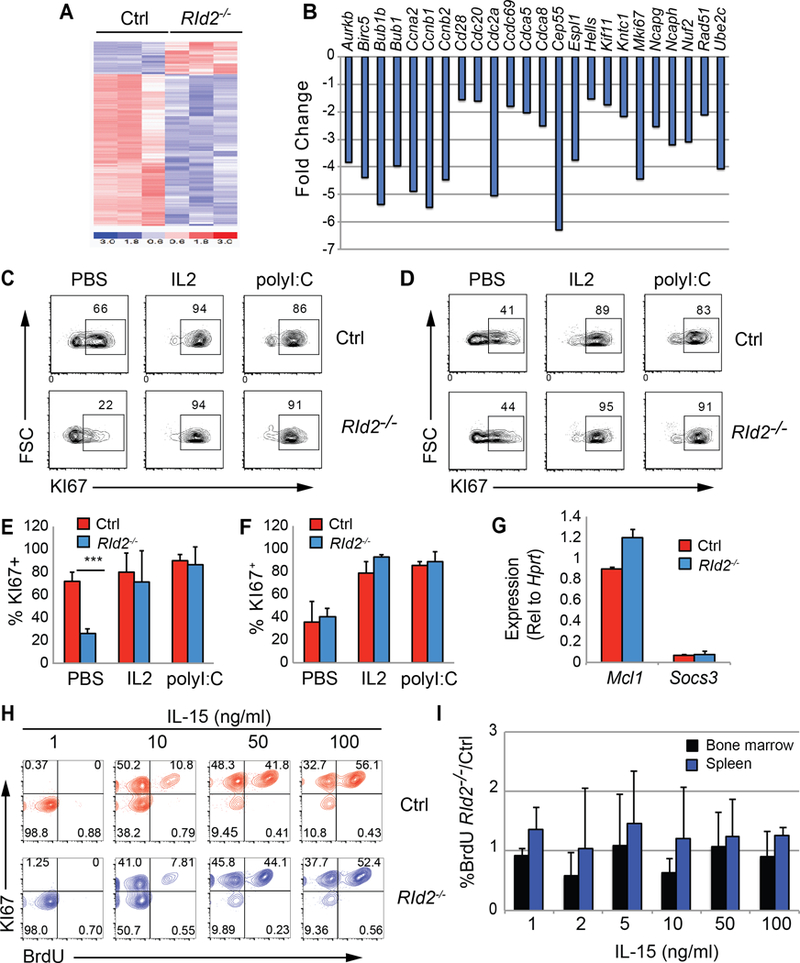
(A) Heat map of probe sets that were differentially expressed by greater than 1.5-fold (P < 0.05) in Ctrl and RId2−/− CD27+CD11b− NK cells. Microarray analysis was performed on RNA isolated in 3 independent experiments. (B) Fold change in expression of a set of differentiation associated probe sets identified by Chiossone et al., (5), in RId2−/− as compared to Ctrl CD27+CD11b− NK cells. (C) Ctrl or RId2−/− mice were injected with PBS, IL-2, or polyI:C and 3 days later the frequency of KI67+ CD27+CD11b− NK cells was determined in the BM (C) or spleen (D) by flow cytometry. Representative of 3 independent experiments. The average frequency of Ctrl (red) or RId2−/− (blue) CD27+CD11b− NK cells expressing KI67 + S.D. 3 days after injection of PBS, IL-2 or polyI:C was determined for the (E) BM and (F) spleen. N=3 ** P<0.01. (G) qRT-PCR for Mcl1 and Socs3 mRNA shown relative to Hprt mRNA in Ctrl (red) or RId2−/− (blue) CD27+CD11b− NK cells from the BM. (H) BM NK cells from Ctrl (red) or RId2−/− (blue) mice were treated with increasing concentrations of IL-15 for 3 days prior to addition of BrdU for 30 minutes. The cells were stained for NK cell surface markers, intracellular BrdU, and KI67. Lin−NKP46+CD49b+CD27+CD11b− cells are shown. Representative of 4 independent experiments. (I) Average ratio + S.D. of the percent of NK cells that were BrdU+ in cultures of RId2−/− as compared to Ctrl CD27+CD11b− NK cells isolated from the BM (blue) or spleen (black), identified as in (H). N = 4.
ID2 was reported to maintain responsiveness to IL-15 in NK cells through repression of Socs3 (15). Our gene expression analysis did not reveal any difference in Socs3 or Mcl1, which codes for a critical anti-apoptotic protein induced by IL-15 (23), in RId2−/− CD27+CD11b− NK cells, and we confirmed this by qRT-PCR (Fig. 2G). To further address whether RId2−/− cells could respond to IL-15, we undertook a rigorous analysis of their sensitivity to this cytokine in vitro. Ctrl and RId2−/− CD27+CD11b− NK cells expanded equivalently, had similar DNA synthesis as measured by BrdU, and showed a similar frequency of KI67+ cells at multiple concentrations of IL-15 in vitro ((Fig. S2A, 2H, I). Activation of the mTOR pathway, as revealed by pS6K, was also similar in RId2−/− and Ctrl CD27+CD11b− NK cells in vitro (Fig. S2B−C). Therefore, while ID2 may be required for IL-15-dependent survival of CD27−CD11b+ NK cells, RId2−/− CD27+CD11b− NK cells responded as well as Ctrl cells to IL-15 in vitro.
ID2 promoted the acquisition of an NK cell effector gene program
To further test the hypothesis that ID2 promotes NK cell effector differentiation we examined our gene expression data for transcripts associated with differentiation and the cytotoxic effector program (5). The RId2−/− CD27+CD11b− NK cells expressed less mRNA than Ctrl NK cells for many of these genes including Gzma, Gzmb, Gzmk, Spi6 and Serpinb9 (Fig. 3A). We confirmed the decreased expression of Gzma, Gzmb, and Gzmk by qRT-PCR and we also found that mRNA for PERFORIN (Prf1) and the transcription factor TBET (Tbx21) were decreased (Fig. 3B). Il18r1, encoding a component of the IL-18 receptor, was also decreased and both TBET and IL18R1 protein were decreased in RId2−/− CD27+CD11b− NK cells (Fig. 3A, C). Klrg1, which encodes an activating receptor associated with effector differentiation, was decreased in RId2−/− cells and we confirmed that KLRG1 was lower on these cells (Fig. 3A, C). Therefore, ID2 promotes the expression of genes associated with NK cell differentiation and cytotoxic function already in CD27+CD11b− NK cells.
Fig. 3. ID2 promotes the cytotoxic effector program of NK cells.
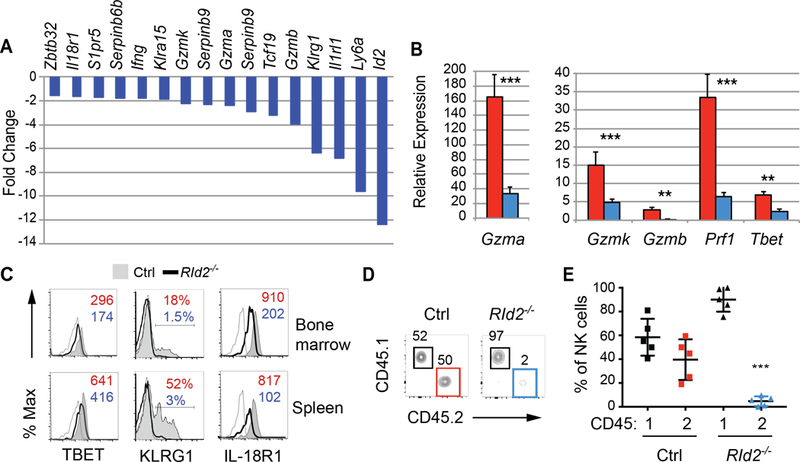
(A) Fold change in expression of probe sets associated with NK cell differentiation or the cytotoxic effector program as measured by microarray analysis. (B) qRT-PCR analysis of Gzma, Gzmb, Gzmk, Prf1 and Tbet mRNA relative to Hprt mRNA in BM CD27+CD11b− NK cells from Ctrl (red) or RId2−/− (blue) mice. Representative of 3 experiments, N=3 per experiment. Error bars are S.D. (C) TBET, KLRG1 and IL-18R1 on CD27+CD11b− NK cells from Ctrl (shaded, grey) or RId2−/− (open, black) mice by flow cytometry. The open grey histogram is the FMO control. The MFI or percent positive cells is indicated for Ctrl (red) and RId2−/− (blue). Representative of 3–8 experiments. (D) Klr8−/− mice were injected with NK cells from the spleen of Ctrl or RId2−/− (CD45.2+) mice along with an equal number of WT CD45.1+ splenic NK cells and infected with MCMV. The percent of Ly49H+ NK cells in the spleen that were CD45.1+ (black gate) or CD45.2+ (red for Ctrl cells and blue for RId2−/− cells) was examined by flow cytometry on day 7. One representative experiment is shown. N=3. (E) Summary of data for multiple NK cell chimeric mice, set up as in (D). Each dot is one mouse. The mean +/− SD is shown. * P<0.05, ** P<.01, ***P<0.005.
ID2 was required for the expansion of NK cells in response to MCMV
NK cells play an important role in virus detection and their expansion following mouse cytomegalovirus (MCMV) infection is promoted by IL-12, IL-18, and IL-33 (8, 24, 25). Given that RId2−/− NK cells have reduced expression of Il18r1 and Il1rl1 (Fig. 3A), we questioned whether they could expand in vivo in response to MCMV. To address this question we took advantage of an assay in which equivalent numbers of CD45.2+ RId2−/− (or Rag1−/− Ctrl) and CD45.1+ WT NK cells were adoptively co-transferred into Ly49H-deficient mice followed by infection with MCMV (26). In mice that received CD45.2+ Ctrl NK cells, there was robust detection of CD45.2+ and CD45.1+ NK cells at day 7 post-infection (Fig. 3D, E). In contrast, in mice that received CD45.2+ RId2−/− NK cells only the CD45.1+ NK cell population could be detected 7 days post-infection (Fig. 3D, E), despite the fact that CD27+CD11b− NK cells generally expand more robustly than CD27−CD11b+ NK cells in response to MCMV (8, 27).
ID2 prevented T lymphocyte-associated gene expression in CD27+CD11b− NK cells
To gain further insight into how deletion of Id2 impacted the NK cell gene expression program we performed Gene Set Enrichment Analysis (28, 29). This analysis revealed that RId2−/− cells were enriched for genes that are increased in naïve as compared to memory CD4 T cells and in memory as compared to effector CD8 T cells, in addition to other T cell-associated programs (Fig. 4A and Table S1). KEGG pathway analysis revealed that RId2−/− cells had increased expression of genes associated with “cytokine-cytokine receptor interaction” (p=3.6E-3), “JAK-STAT signaling” (p=4.8E-3) and “T cell receptor signaling” (7.5E-3). Metascape analysis identified similar pathways and multiple GO terms, including “T cell differentiation” and “T cell activation” (Table S2)(30), categories that included multiple cytokines and cytokine receptors, signaling molecules, and T cell-associated genes (Fig. 4B). We confirmed the up-regulation of Cd3g and Cd3d mRNA by qRT-PCR (Fig. 4C) and CXCR5, CXCR3, IL-4Rα, and CD27 on RId2−/− CD27+CD11b− NK cells by flow cytometry (Fig. 4D). As demonstrated previously, we found a subtle but consistent increase in TCF1 by flow cytometry (Fig. 4E) (15). Taken together, our data indicate that ID2 limits the expression of multiple genes whose protein products are associated with naïve or central memory T lymphocytes.
Fig.4. ID2 represses a naïve or memory-like T lymphocyte gene program.
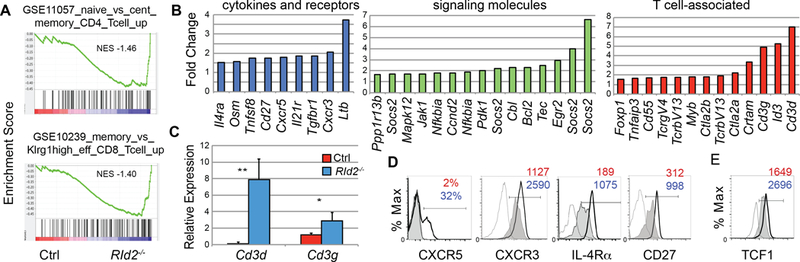
(A) Gene set enrichment analysis of the microarray data revealed enrichment of multiple T cell-associated pathways in RId2−/− CD27+CD11b− NK cells as compared to Ctrl. (B) Fold change in expression of gene specific probes in RId2−/− NK cells as compared to Ctrl as determined by microarray analysis. Cytokine and chemokine associated genes (blue), Signaling molecule genes (green) and T cell-associated genes (red) are shown. (C) qRT-PCR for CD3d and Cd3g mRNA in Ctrl (red) and RId2−/− (blue) CD27+CD11b− BM NK cells is shown relative to Hprt mRNA. Error bars are S.D. One of three experiments is shown. (D). Surface expression of CXCR5, CXCR3, IL-4Rα, CD27 and (E) intracellular staining for TCF1 on CD27+CD11b− NK cells from the BM of Ctrl (grey, shaded) or RId2−/− (black, open) was determined by flow cytometry. Grey or stippled line is FMO control. For (D, E) the MFI or percent positive is indicated for Ctrl (red) and RId2−/− (blue). ***P<0.005
ID2 modulated chromatin accessibility near genes associated with chemokine and cytokine receptor and T cell receptor signaling
To determine how ID2 controls the gene expression program of NK cells we compared chromatin accessibility in RId2−/− and Ctrl CD27+CD11b− NK cells using ATAC-seq (31). We identified 76,523 regions of open chromatin in Ctrl and RId2−/− CD27+CD11b− cells most of which were overlapping. However, 7070 (9.25%) of these regions showed more pronounced accessibility in Ctrl than in RId2−/− cells whereas 4419 (5.8%) were more accessible in the RId2−/− cells (2-fold Q-value 0.05). The regions of chromatin that were more accessible in RId2−/− cells generally showed less accessibility in Ctrl CD27−CD11b+ (CD11b+) cells indicating that these regions close with NK cell differentiation (Fig. 5A). K-means clustering of these regions revealed 5 clusters with decreased accessibility upon differentiation from CD27+CD11b− to CD27−CD11b+ cells (Fig. 5B). These regions were positively correlated with genes that had increased expression in RId2−/− NK cells compared to Ctrl (Fig 5C). This correlation was evident even when the accessible DNA was 5–100 kb away from the transcription start site but was lost at greater distances (Fig. 5C). Therefore, ID2 limited chromatin accessibility at regions that decreased in accessibility as NK cells differentiated and ID2 repressed expression of the associated genes.
Fig. 5. ID2 represses chromatin accessibility at T cell associated genes by preventing E protein binding.
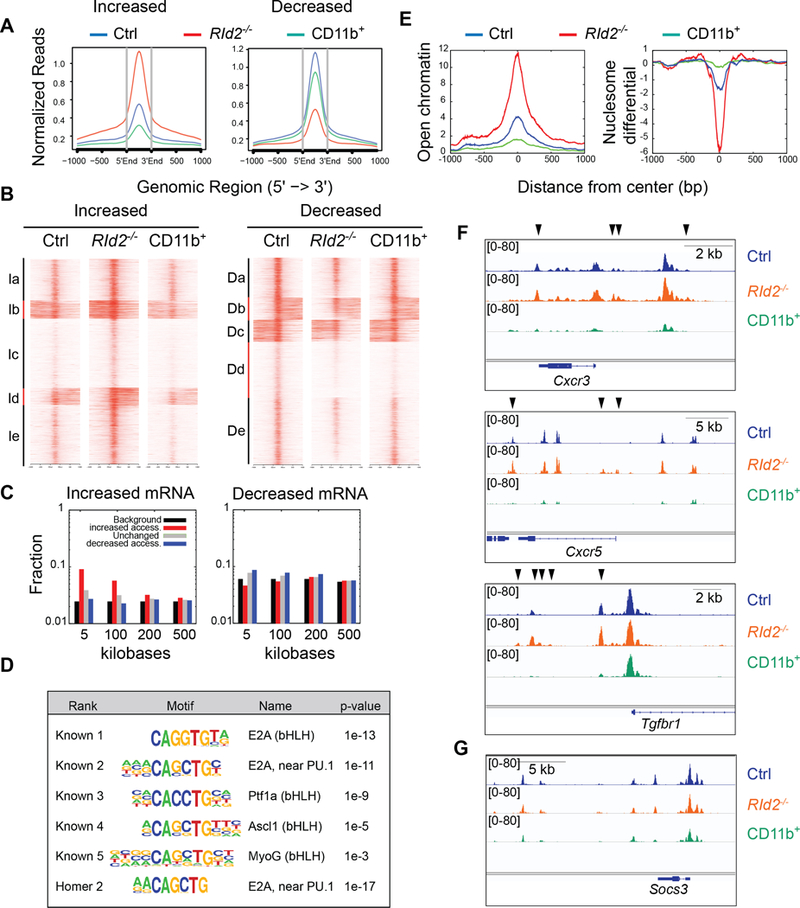
(A) ATAC-sequencing was used to identify regions of open chromatin in RId2−/− (red) and Ctrl CD27+CD27− (blue) NK cells and in Ctrl CD27−CD11b+ (green, labeled as CD11b+) NK cells. The graph shows normalized reads at the indicated distance from the center of open chromatin domains that had increased (left graph) or decreased (right graph) accessibility in RId2−/− as compared to Ctrl CD27+CD11b− NK cells. (B) Heat map and K-means clustering of the regions analyzed in (A) with increased or decreased accessibility in RId2−/− as compared to Ctrl CD27+CD11b− NK cells. (C) Fraction of genomic regions that showed increased accessibility (red) decreased accessibility (blue) or no change in accessibility (grey) in RId2−/− CD27+CD11b− NK cells and were associated with genes that increased (left plot) or decreased (right plot) expression by greater than 2-fold. Black represents the background/null distribution (all genes in the genome) (D) HOMER motif enrichment at regions with increased accessibility near genes that increased expression in RId2−/− compared to Ctrl NK cells. (E) Normalized reads for open chromatin (left) and nucleosome differential (right) centered over E box motifs associated with genes that increased expression in RId2−/− NK cells. (F) Accessible chromatin at the Cxcr3, Cxcr5, and Tgfbr1 genes in RId2−/− (orange) and Ctrl (blue) CD27+CD11b− NK cells and Ctrl CD11b+ NK cells (green) in viewed in IGV. Black arrows indicate regions that are more accessible in RId2−/− compared to Ctrl. (G) Same as (F) but for the Socs3 gene.
To determine the mechanisms by which ID2 repressed chromatin accessibility, we examined the regions with increased accessibility near (<5 kb) genes that increased expression in RId2−/− cells for enriched transcription factor binding motifs using HOMER, as compared to regions that were accessible in RId2−/− and Ctrl CD27+CD11b− cells. Remarkably, all of the significantly enriched known motifs shared the canonical CANNTG E box binding motif with the most significantly enriched motif (p < 1e-13) being the classic E protein binding site (Fig. 5D) (32). The de novo HOMER motifs also included a highly ranked E box motif (Fig. 5D). The 5 known E box motifs were present in 747 of 1025 (73%) ID2-regulated accessible chromatin regions (Table S3). Analysis of chromatin accessibility surrounding the E box motifs confirmed increased accessibility in RId2−/− cells compared to Ctrl CD27+CD11b− cells and these regions were less accessible in Ctrl CD27−CD11b+ cells (Fig. 5E). Furthermore, analysis based on fragment length revealed that these regions had greater nucleosome depletion in RId2−/− cells, whereas nucleosomes frequently occupied these sites in CD27−CD11b+ cells (Fig. 5E). KEGG pathway analysis of the genes associated with the E box motifs revealed the categories of “Cytokine-cytokine receptor interaction” (P=3.6E-13), “JAK-STAT signaling” (P=5E-12), “TCR signaling” (P=2E-10) and “MAP kinase signaling” (P=2.4E-9), overlapping with the categories of genes that increase in expression in the RId2−/− cells. We confirmed the increased chromatin accessibility at the Cxcr3, Cxcr5 and Tgfbr1 genes, among others, in RId2−/−, and in most cases these regions showed less accessibility in Ctrl CD27−CD11b+ cells (Fig. 5F). Importantly, Socs3 did not show altered chromatin accessibility in RId2−/− CD27+CD11b− NK cells (Fig. 5G). Taken together, our data indicate that ID2 controls the activity of E proteins to limit the expression of multiple T cell-associated genes in CD27+CD11b− NK cells.
RId2−/− NK cells required AP-1 activation for IFN-γ production
We also examined the chromatin that showed decreased accessibility in RId2−/− compared to Ctrl CD27+CD11b− cells and found that these were, on average, only slightly decreased during NK cell differentiation (Fig. 5A). Only 1 of 5 K-means clusters (Dd) showed reduced accessibility in CD11b+ NK cells indicating that most of these regions remain accessible during NK cell differentiation (Fig. 5B). The chromatin with decreased accessibility in RId2−/− NK cells was not significantly enriched at genes that had decreased expression in these cells (Fig. 5C). Despite this, HOMER analysis of the regions that had decreased accessibility within 5 kb of genes that decreased in expression revealed an enrichment for AP-1/Batf binding motifs (Fig. S3A). Analysis of these regions centered on the AP-1 motif revealed a subtle decrease in accessibility but no change in nucleosome occupancy in RId2−/− as compared to Ctrl CD27+CD11b− NK cells (Fig. S3B). These observations are consistent with the hypothesis that these AP-1 motifs remain accessible in the absence of ID2 but slightly less so than in Ctrl CD27+CD11b− NK cells, possibly due to less transcription factor binding.
HOMER found AP-1 binding sites in regions of decreased chromatin accessibility at the Ifng gene (Fig. S3E). AP-1 was implicated in the regulation of Ifng in NK cells downstream of NK cell receptors that have the immunoreceptor tyrosine-based activation motif (ITAM), which activates AP-1 via PKC-theta (33). To determine whether AP-1 activation could promote IFN-γ production in RId2−/− NK cells we utilized phorbol myristate acetate (PMA) to activate PKC-theta. This treatment resulted in the rapid production of IFN-γ from both RId2−/− and Ctrl CD27+CD11b− NK cells (Fig. S3C−D).
We previously demonstrated that Id2−/− NK cells had a reduced ability to produce IFN-γ in response to IL-2 + IL-12 (20). Because NK cell differentiation stage was not considered in those experiments, we re-evaluated whether CD27+CD11b− NK cells from RId2−/− and Ctrl mice produced IFN-γ under these conditions and found that RId2−/− NK cells produced substantially less IFN-γ than Ctrl cells (Fig. S3). IL-12 promotes Ifng transcription through activation of STAT4 (34); however, our data raised the possibility that RId2−/− NK cells needed AP-1 for Ifng transcription. AP-1 is also induced by IL-18, a cytokine required for the primed state of NK cells (35). Treatment of RId2−/− NK cells with IL-18 and IL-12 resulted in robust IFN-γ production suggesting that AP-1 was required for IFN-γ production in RId2−/− NK cells (Fig. S3C–D). These data indicate that RId2−/− NK cells can produce IFN-γ under conditions that lead to AP-1 activation.
ID2 prevented NK cells from acquiring a chromatin accessibility state associated with naïve CD8 T cells.
Our data suggest that ID2 prevents the E proteins from augmenting expression of multiple T cell genes that are associated with naïve or memory CD8 T cells. To further investigate the role of ID2 in NK cells we compared our ATAC-seq data to recently reported ATAC-seq data from naïve, TE, and MP CD8 T cells isolated from mice transplanted with OT-I CD8 T cells prior to infection with Listeria monocytogenes engineered to express OVA (36). We first examined genes that were up regulated in RId2−/− NK cells, such as Il4ra, CD3g and Cd3d and identified regions that increased accessibility in RId2−/− as compared to Ctrl CD27+CD11b− cells and decreased accessibility upon NK cell differentiation (Fig. 6A, B). When compared to the CD8 T cell populations, RId2−/− NK cells had chromatin accessibility patterns that were evocative of naïve CD8 T cells. Based on these observations we hypothesized that ID2 promotes an TE-like or MP-like chromatin landscape in CD27+CD11b− NK cells and prevents a naïve chromatin context.
Fig. 6. RId2−/− NK cells acquire an accessible chromatin state similar to naïve rather than MP or TE CD8 T cells.
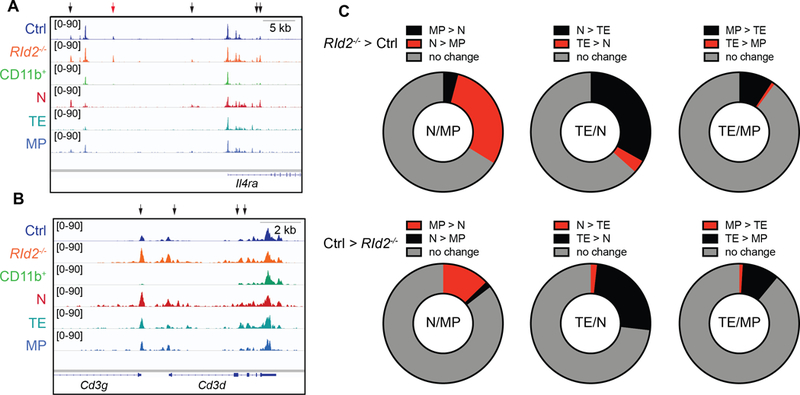
Accessible chromatin tracks for Ctrl, RId2−/−, and Ctrl CD11b+ NK cells from this study compared to CD8 T naïve, TE, or MP from GSE95237 after normalization of the data sets. Accessible chromatin domains at the (A) Il4ra, (B) Cd3d and CD3g are shown with black arrows indicating regions of increased accessibility in RId2−/− as compared to Ctrl. The red arrow indicates a peak unique to NK cells. (C) Peaks that increased in RId2−/− as compared to Ctrl by greater than 400% (P<0.05; 486 peaks) were compared to the accessible peaks in naïve as compared to MP, TE as compared to naive, or TE as compared to MP. A change in the CD8 T cell populations was accepted as positive if it was greater than 200% (P< 0.05). (D) As in (C) for peaks that increased by 400% (P < 0.05; 1274 peaks) in Ctrl as compared to RId2−/−.
To determine whether comparison of these populations could reveal, on a larger scale, relationships between the subsets, we determined whether the accessible chromatin regions in Ctrl CD11b+ cells as compared to CD27+CD11b− cells (differing by log22, P < 0.05) revealed an association with CD8 TE, as would be expected. Indeed, these regions were more accessible in TE as compared to naive or MP (Fig. S4A). In contrast, regions that were more accessible in CD27+CD11b− NK cells were frequently more accessible in naive and MP than in TE cells (Fig. S4B). When a similar analysis was performed for regions that were more accessible in RId2−/− NK cells than in Ctrl CD27+CD11b− NK cells, we found that these regions were more accessible in naive as compared to MP or TE (Fig. 6C). In contrast, regions that were more accessible in Ctrl CD27+CD11b− NK cells compared to RId2−/− NK cells were more accessible in TE than naive or MP and in MP as compared to naive CD8 T cells. These data are consistent with the failure of RId2−/− cells to active the CD8 TE-like program and indicate that ID2 prevents E proteins from promoting a naïve-like chromatin landscape in CD27+CD11b− NK cells.
We also note that in all of our comparisons NK cells had a substantial number of differentially accessible regions that were not differentially accessible between any CD8 T cell subsets. This observation was due, in part, to the stringency of our assignment of changes in accessibility because associations were more striking when we reduced the magnitude of differential accessibility or the statistical significance (Fig. S4C−D). However, even in this less stringent analysis there were numerous differentially accessible peaks in RId2−/− NK cells as compared to Ctrl, or Ctrl CD27+CD11b− compared to CD27−CD11b+ NK cells that were not differentially accessible between CD8 T cell subsets consistent with the distinct lineage derivation and functional capacities NK cells and CD8 T cells (Fig. S4).
ID3 was required for development of ID2-deficient NK cells.
One of the up-regulated genes in RId2−/− NK cells was Id3 (Fig. 4B), which codes for an ID2-related protein (12). We identified an E box containing chromatin region downstream of Id3 that was more accessible in RId2−/− NK cells than Ctrl that was not accessible in any T cell population (Fig. 7A), although Id3 mRNA is expressed in both naïve and memory CD8 T cells (16, 37, 38). In T cells, ID3 is most highly expressed in naïve cells and maintains the naïve state (16, 36). To determine whether ID3 was required in RId2−/− NK cells we examined NK cells from Il7raCreId2−/− (LId2−/−), Il7raCreId2−/−Id3−/− (LId2−/−Id3−/−), and Ctrl (Il7RaCre/+ or Id2f/f) BM after transplantation into lethally irradiated CD45.1 mice. We used a transplantation approach for these experiments because we found previously that the γδNKT-like cells present in Id3−/− mice repressed NK cell development but these cells failed to develop in BM chimeras. Using this approach we found that ID3 was not required for NK cell development consistent with its exceedingly low expression in Ctrl NK cells (Fig. 7B and Fig. S5A−D)(39). Under these transplantation conditions, LId2−/− BM generated a slightly reduced frequency of Lin−CD122+ cells compared to Ctrl BM and approximately half of these cells were donor derived (CD45.2+) compared to nearly 80% in Ctrl BM transplanted mice. The NK cells that developed in LId2−/− chimeras were arrested at the CD27+CD11b− NK cell stage (Fig. 7C). The percent reconstitution for RId2−/− NK cells, determined as the percent of CD45.2+ cells amoung Lin−CD122+NK1.1+DX5+ cells was about half of that in mice transplanted with Ctrl BM (Fig. 7D). The percent reconstitution in the spleen was better than in the BM but LId2−/− NK cells continued to be arrested at the CD27+CD11b− stage (Fig. 7E, F). Chimeric mice established with LId2−/−Id3−/− BM, in contrast to LId2−/− BM, showed a near complete lack of CD45.2+ NK cells in both the BM and spleen (Fig. 7C−F). Taken together these data demonstrate that ID3 is required for development of ID2-deficient NK cells.
Fig. 7. ID3 is required for development of ID2-deficient NK cells.
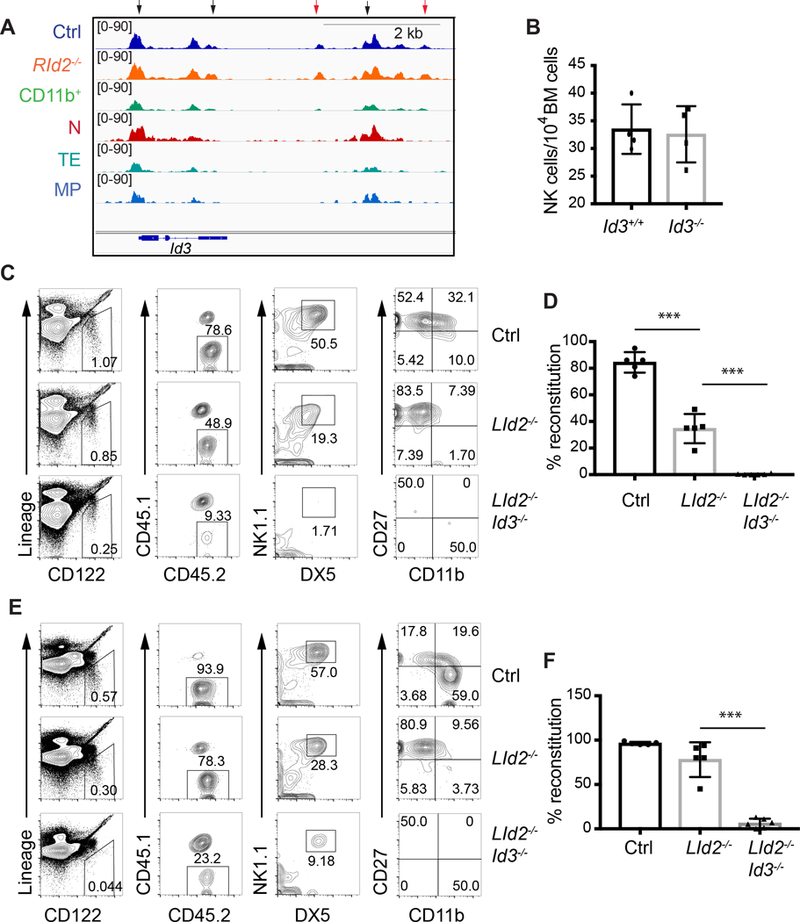
(A) Accessible chromatin tracks for the indicated populations surrounding the Id3 gene. Arrows indicate regions that are more accessible in RId2−/− as compared to Ctrl NK cells. The red arrows indicate peaks unique to NK cells. (B) CD45.2+ CD3ε−TCRβ−TCRδ−NK1.1+DX5+ NK cell numbers/104 BM cells in chimeric mice created by transplanting Id3+/+ (black) or Id3−/− (grey) bone marrrow into lethally irradiated CD45.1+ mice. Each circle represents one transplanted mouse with a unique donor. N = 4. (C) Flow cytometry of BM for CD45.2+ NK cells in CD54.1+ mice transplanted with CD45.2+ Ctrl, LId2−/− and LId2−/−Id3−/− BM. Each row of plots is gated on the population indicated in the row to the left. Lineage = CD3ε, TCRβ, TCRγ. (D) Average percent reconstitution, determined as the percent of Lin−CD122+NK1.1+DX5+ cells that were CD45.2+ + S.D. is shown for each population. N= 5. (E) and (F) are for the spleen as in (C) and (D). ** P<0.01, *** P<0.001.
DISCUSSION
Here we demonstrated that a major function of ID2 is to maintain an “MP-like” chromatin state and gene program in CD27+CD11b− NK cells when the cells are capable of innate-like cytokine responses and are preparing for differentiation into cytotoxic effector cells. In the absence of ID2, NK cells up-regulated numerous genes associated with naïve CD8 T cells resulting in a shift in chemokine and cytokine receptor expression and intracellular signaling proteins and the cells lost their ability to produce IFN-γ in response to IL-2 + IL-12. Our analyses indicate that E proteins are the major ID2 target in NK cells and imply that the observed alterations in chromatin accessibility are due to aberrant E protein-mediated recruitment of chromatin modifying and remodeling proteins such as P300/CBP and Mi-2beta to the regulatory regions of genes expressed in naïve CD8 T cells (40–42). We identified multiple putative E protein target genes in CD27+CD11b− NK cells including Id3 and we demonstrated that ID3 was essential for development of ID2-deficient NK cells. Taken together, our data support the hypothesis that ID2 enforces the MP-like characteristics of CD27+CD11b− NK cells and supports their differentiation into cytotoxic effector cells by limiting transcription of the naive gene program.
Id2−/− CD8 T cells resemble central memory cells, with increased expression of Cxcr3, Cd27, Cxcr5 and Tgfbr1 and they fail to differentiate into KLRG1high effector cells even when their survival is enhanced (37, 43). Despite the increased expression of these same genes, our data indicate that the KLRG1− NK cells present in RId2−/− mice are more closely related to naive CD8 cells than to MP cells based a comparison of sites of differential chromatin accessibility in RId2−/− and Ctrl CD27+CD11b− NK cells to those in naive, TE, and MP CD8 T cells (36). We also examined the changes in chromatin accessibility as NK cells mature from CD27+CD11b− to CD27−CD11b+ effector cells and found that these populations are most closely related to CD8 MP and TE cells, respectively. However, our analysis revealed many differences between the chromatin landscape of NK cells and CD8 T cells suggesting that the distinct developmental trajectories of these cells, or their complement of transcription factors and chromatin remodelers, resulted in the use of overlapping and unique chromatin regions to control gene expression. This conclusion is consistent with previous studies comparing mature innate and adaptive lymphoid cell chromatin landscapes (44, 45).
RId2−/− NK cells also resemble naive CD8 T cells in that they have reduced accessibility at chromatin regions with potential AP-1 binding sites (46), as exemplified by regions at the Ifng locus. IFN-γ was provoked in RId2−/− NK cells by factors that activate AP-1 (PMA + ionomycin or IL-18 + IL-12) but not in the absence of AP-1 activation (IL-2 + IL-12). The reduced AP-1 activation may be an indirect consequence of the naïve gene program. Indeed, RId2−/− NK cells have reduced expression of IL-18R, which primes NK cells for innate cytokine responsiveness and activates AP-1, as well as alterations in multiple surface receptors and signaling pathways. While IL-18R expression was low on RId2−/− NK cells, addition of excess IL-18 allowed for IFN-γ production in response to IL-12; however, the in vivo concentration of IL-18 may be insufficient for priming of NK cells with low expression of IL-18R. Alternatively, RId2−/− NK cells might not reside in their normal niche and therefore fail to receive signals that activate AP-1. Understanding the mechanisms that link ID2 to the innate cytokine responsive state may reveal mechanisms to control NK cell cytokine production in vivo.
Our study provides insight into the direct targets of E proteins in NK cells. Many of these genes are expressed at the earliest stages of NK cell development, when Id2 mRNA levels are lower than in CD27−CD11b+ NK cells. However, it remains to be determined whether E proteins are required for expression of these genes during normal NK cell development. Cxcr5 appears to be a universal E protein target, as it is directly induced in multiple cell types in which E protein function is elevated (47, 48). CXCR5 is expressed on subsets of NK cells and may allow these cells to enter germinal centers where they can impact antibody production by B cells, similar to what was recently described for CD8 T cells (49, 50). Id2 mRNA is regulated by multiple cytokines raising the possibility that CXCR5 expression on NK cells could be a consequence of E protein activity. We note that some well known E protein targets in early B cell development, such as Ebf1 and Rag2 were not expressed in RId2−/− NK cells suggesting that the these loci were inaccessible to E proteins, or that additional transcription factors were needed to induce their expression. In addition, and consistent with the naïve state of these cells, critical CD8 T cell central memory genes were not up regulated in RId2−/− CD27+CD11b− NK cells including Sell, Ccr7, and Il7ra, indicating that these genes are not direct E protein target genes, at least in NK cells.
It was reported that ID2 promotes NK cell survival by preventing E protein-mediated induction of Socs3. We found no evidence for induction of Socs3 in RId2−/− NK cells and, despite their otherwise naïve state, RId2−/− NK cells were able to proliferate in response to IL-2 and IL-15 as well as Ctrl cells. However, we cannot exclude the possibility that ID2 represses Socs3 in differentiated CD11b+ cells. Indeed, our conclusions are limited to ID2 function in CD27+CD11b− NK cells since we have not examined the consequences of Id2 deletion in CD11b+ NK cells. Moreover, while our ATAC-seq data demonstrate increased accessibility at E protein binding motifs, they do not directly demonstrate E protein binding and they do not reveal which E proteins bind to these motifs. Another potential caveat to our study is that many of our experiments were performed in Rag1−/− mice, in which NK cells have increased access to IL-2 and IL-15, and may differ from NK cells in Rag1+/+ mice in multiple ways (27). Nonetheless, our basic observations, including alterations in cell surface receptors, induction of IFN-γ by IL-18 + IL-12, and the failure to differentiate into CD11b+ NK cells were observed in Ncr1CreId2f/f mice on a Rag1+/+ background.
In contrast to Socs3, we found increased Id3 mRNA and increased chromatin accessibility near the Id3 gene in RId2−/− NK cells. Moreover, ID3 was critical for the generation of ID2-deficient NK cells. These findings raise two important questions: 1) Why isn’t chromatin accessibility near E protein DNA binding motifs inhibited by ID3? and 2) Why can’t ID3 replace ID2 to promote the NK cell “MP-like” state in CD27+CD11b− NK cells? We propose that the answer to both of these questions lays in the mechanisms of Id2 and Id3 transcription. E proteins regulate Id3 and therefore ID3 concentration is limited by its ability to inhibit the E proteins. E protein DNA binding must be balanced by ID3 at a level that favors sufficient E protein DNA binding to promote Id3 transcription. In contrast, ID2 can completely inhibit E proteins with no consequence for its own expression. Therefore, our data demonstrate that NK cell development requires tight regulation of the balance between E and ID proteins to maintain the MP-like state in CD27+CD11b− NK cells and to promote cytotoxic effector maturation.
MATERIALS AND METHODS
Study Design
The aim of this study was to determine how deletion of Id2 impacted the development of NK cells. To do this, we created mice in which Id2 was deleted in all hematopoietic cells because the Id2 germ line mutation is lethal when it is on a C57BL/6 background. The model we have studied has the genotype GzmbCre Rag1−/− Id2f/f and is on a C57BL/6 background, and referred to as RId2−/−, although we have confirmed most of our observation in Ncr1CreId2f/f and Il7raCreId2f/f mice that are Rag1+/+. We used these mice to investigate NK cell development by flow cytometry, combined with analysis of gene and protein expression, and chromatin accessibility by ATAC-seq. We were careful to compare cells at a similar stage of development, in particular, in CD27+CD11b− NK cells. All experiments were performed independently at least 3 times as indicated in the figure legends.
Animals
Rag1−/−GzmbCreId2f/f, Il7RaCreId2f/fId3−/−, Id3−/−, Ncr1CreId2f/f, B6.SJL-Ptprca and various control mice were housed at the University of Chicago under the guidelines of the University of Chicago Institutional Animal Care and Use Committee (17). Klr8−/− (Ly49H-deficient) and B6.SJL-Ptprca mice were housed at Memorial Sloan-Kettering Cancer Center under the guidelines of their Animal Use Committee (51). All mice were on a C57Bl/6 background.
Antibodies and flow cytometry
BM cells, splenocytes and liver cell suspensions were incubated with FcBlock prior to the addition of biotinylated or fluorochrome conjugated antibodies (FITC, PE, APC, PECY7, Percp-cy5.5, APC-eAF780, Brilliant Violet 421) Antibodies were purchased from eBioscience, BD Pharmingen, or Biolegend. Ki67 and BrdU staining was performed using the FoxP3 Fix/Perm staining kit (Biolegend).
Cytokine stimulation assays
DX5+ cells were isolated from BM or spleen by MACS (Miltenyi) and cultured overnight in the indicated conditions (1000 IU/ml IL-2, 10 ng/ml IL-12, 100 ng/ml IL-18, 20 ng/ml PMA or 1 ug/ml ionomycin with the inclusion of Brefeldin A (1:1000) for the last 5 hours). In vivo stimulation was performed by injecting 500 IU IL-2 or 150 ug polyI:C followed by analysis 3 days later. Cytokines were purchased from R&D Systems and Peprotech.
BM chimeric mice
CD45.2+ RId2−/− BM cells were mixed with CD45.1+ Rag1+/+ BM cells at a 1:1 ratio. A total of 5 × 10⁶ cells were injected into lethally irradiated CD45.1 hosts through the retro-orbital vein. At 8 weeks post reconstitution the frequency of CD45.1− NK cells in the BM and spleen was determined. In one of three experiments Rag1−/− Ctrl NK cells were also injected into CD45.1+ hosts along with CD45.1+ Rag1+/+ BM cells. For analysis of Id3−/− mice, 2 × 10⁶ BM cells were transplanted into lethally irradiated CD45.1+ or CD45.1+CD45.2+ mice and analyzed between 6 and 8 weeks after transplantation.
Adoptive Transfer and MCMV infection
Splenocytes were treated with anti-CD4 (GK1.5), -CD8 (53.6.72), -CD19 (1D3) and -Ter119, and anti-rat IgG-coupled magnetic beads to deplete T, B, and erythrocytes on magnetic columns (Miltenyi Biotech). Enriched Ly49H+ NK cells from B6.SJL (CD45.1+) and Ctrl or RId2–/– (CD45.2+) donors were mixed in equal numbers and approximately 3 × 10⁴ total Ly49H+ NK cells were co-transferred into adult Ly49H−/− recipients. On the following day, recipients were infected with 750 PFU of MCMV (Smith Strain; obtained from the salivary glands of MCMV-infected Balb/c mice) via intraperitoneal injection, as previously described (Sun et al, Nature, 2009). Splenocytes were examined for CD45.1+ or CD45.2+ NK cells by flow cytometry 7 days after infection.
Microarray analysis
5,000 CD27+CD11b− NK cells were sorted from the BM of Ctrl and RId2−/− mice and RNA was isolated using the RNeasy Micro kit (Qiagen). cDNA was prepared to probe Affymetrix MOE 430_2 arrays as previously described (Dias et al., 2008). Three independent samples of each cell type were examined. Raw data was normalized using RMAexpress and heatmaps and gene expression were created using dChip (52, 53).
Assay for transposase-accessible chromatin with sequencing (ATAC-Seq).
ATAC-Seq was performed as described (31). Briefly, 50,000 BM CD27+CD11b− NK cells from RId2−/− and Ctrl mice and CD27−CD11b+ NK cells from Ctrl mice were sorted and used for each ATAC-Seq assay (2 assays). Nuclei were isolated lysing the cells with cold lysis buffer (10 mM Tris-HCl, pH 7.4, 10 mM NaCl, 3 mM MgCl2 and 0.1% IGEPAL CA-630) followed by centrifugation at 500g for 10 min at 4 °C. The supernatant was carefully removed and the pellet was resuspended in transposase reaction mix (25 μl 2× Tagment buffer, 2.5 μl Tagment DNA enzyme (Illumina, FC-121–1030) and 22.5 μl nuclease-free water) and incubated at 37 °C for 30 min. After transposition, the sample was purified with a Qiagen MinElute kit and library fragments were amplified using Nextera PCR Primers (IlluminaNextera Index kit) and NEBnext PCR master mix (New England BioLabs, 0541) for a total of 10–12 cycles followed by purification with a Qiagen PCR cleanup kit.
The amplified, adaptor-ligated libraries were size-selected with Life Technologies E-Gel SizeSelect gel system in the range of 150–650 bp and quantified with an Agilent Bioanalyzer and via qPCR using the KAPA Library Quantification Kit on the Life Technologies Step One System. Libraries were sequenced on an Illumina HiSeq2000 to generate 7.5× 10⁷ to 10 × 107 50-bp paired-end reads.
Quality control and DNA alignment.
All raw sequence data were quality-trimmed to a minimum Phred score of 20 with Trimmomatic (54). Alignment to reference genome mm10 was done with Bowtie2 (55). PCR duplicates were removed using Picard MarkDuplicates (56), and alignments with an edit distance from the reference of more than 2, or those that were mapped to the reference multiple times, were removed.
ATAC-Seq analysis.
Read-alignment positions were adjusted according to their strand: +4 bp for + strand alignments, and −5 bp for – strand alignments. We called open chromatin regions using Macs2 with the “—nomodel” option set (57).
For nucleosome positioning, we filtered properly paired alignments by their fragment size. Fragments less than 100 bp in size were considered nucleosome free and were replaced with a single BED region and used as a background. Those with sizes between 180 and 247 bp were considered mononucleosomes and were replaced with a single BED region; those with sizes between 315 and 473 bp were considered dinucleosomes and were replaced with two BED regions, each spanning half the overall fragment length; and those with sizes between 558 and 615 bp were considered trinucleosomes and were replaced with three BED regions, each spanning one-third of the overall fragment length. The mono-, di- and trinucleosome regions were concatenated and used as the nucleosome signal. The resulting BED regions were analyzed with DANPOS with the parameters –p 1 –a 1 –d 20 –clonalcut 0 to identify regions enriched or depleted for nucleosomes (58).
Enriched transcription factor motifs were identified using HOMER (59), heatmaps and accessibility plots were generated using NGSplot (60), and data tracks were visualized using Integrated Genome Browser (IGV) (61).
Quantitative Real-Time PCR (qRT-PCR)
qRT-PCR was performed as described previously (62). Data is presented as mRNA expression relative to Hprt mRNA. Primer sequences are available upon request.
Statistical analysis
Statistical differences between groups were calculated using Student’s t-test, with P<0.05 considered significant. All statistics were performed using Prism 7 (GraphPad Software). All error bars are standard deviation. *, P<0.05. **,P<0.01. ***P<0.001.
Supplementary Material
Acknowledgements:
We thank Grant van der Voort and Samantha Cuthbert for technical assistance, E. Vivier, H.R. Rodewald, and E.J. Wherry for providing mice, and the UC Cytometry and Antibody Facility and the Functional Genomics Facility for cell sorting and sequencing.
Funding: This work was funded by the NIH through RO1 AI106352 (B.L.K) and R01 AI100874 (J.C.S.), T32 AI007090 and F32 CA177235 (E.C.Z.), T32 DK007074 (Y.X.). M.M-C. was supported in part by NIH CTSA grant UL1TR002003.
Footnotes
Competing interests: The authors declare that there are no competing interests to be declared.
REFERENCES
- 1.Sun JC, Lanier LL, NK cell development, homeostasis and function: parallels with CD8(+) T cells. Nat Rev Immunol 11, 645–657 (2011). [DOI] [PMC free article] [PubMed] [Google Scholar]
- 2.Schuster IS, Coudert JD, Andoniou CE, Degli-Esposti MA, “Natural Regulators”: NK Cells as Modulators of T Cell Immunity. Front Immunol 7, 235 (2016). [DOI] [PMC free article] [PubMed] [Google Scholar]
- 3.Rutishauser RL, Kaech SM, Generating diversity: transcriptional regulation of effector and memory CD8 T-cell differentiation. Immunol Rev 235, 219–233 (2010). [DOI] [PubMed] [Google Scholar]
- 4.Michel T, Poli A, Cuapio A, Briquemont B, Iserentant G, Ollert M, Zimmer J, Human CD56bright NK Cells: An Update. J Immunol 196, 2923–2931 (2016). [DOI] [PubMed] [Google Scholar]
- 5.Chiossone L, Chaix J, Fuseri N, Roth C, Vivier E, Walzer T, Maturation of mouse NK cells is a 4-stage developmental program. Blood 113, 5488–5496 (2009). [DOI] [PubMed] [Google Scholar]
- 6.Di Santo JP, Vosshenrich CA, Bone marrow versus thymic pathways of natural killer cell development. Immunol Rev 214, 35–46 (2006). [DOI] [PubMed] [Google Scholar]
- 7.O’Sullivan TE, Sun JC, Lanier LL, Natural Killer Cell Memory. Immunity 43, 634–645 (2015). [DOI] [PMC free article] [PubMed] [Google Scholar]
- 8.Kamimura Y, Lanier LL, Homeostatic control of memory cell progenitors in the natural killer cell lineage. Cell Rep 10, 280–291 (2015). [DOI] [PMC free article] [PubMed] [Google Scholar]
- 9.Zook EC, Kee BL, Development of innate lymphoid cells. Nat Immunol 17, 775–782 (2016). [DOI] [PubMed] [Google Scholar]
- 10.Cannarile MA, Lind NA, Rivera R, Sheridan AD, Camfield KA, Wu BB, Cheung KP, Ding Z, Goldrath AW, Transcriptional regulator Id2 mediates CD8+ T cell immunity. Nat Immunol 7, 1317–1325 (2006). [DOI] [PubMed] [Google Scholar]
- 11.Verykokakis M, Zook EC, Kee BL, ID’ing innate and innate-like lymphoid cells. Immunol Rev 261, 177–197 (2014). [DOI] [PMC free article] [PubMed] [Google Scholar]
- 12.Kee BL, E and ID proteins branch out. Nat Rev Immunol 9, 175–184 (2009). [DOI] [PubMed] [Google Scholar]
- 13.Miyazaki K, Miyazaki M, Murre C, The establishment of B versus T cell identity. Trends Immunol 35, 205–210 (2014). [DOI] [PMC free article] [PubMed] [Google Scholar]
- 14.Omilusik KD, Shaw LA, Goldrath AW, Remembering one’s ID/E-ntity: E/ID protein regulation of T cell memory. Curr Opin Immunol 25, 660–666 (2013). [DOI] [PMC free article] [PubMed] [Google Scholar]
- 15.Delconte RB, Shi W, Sathe P, Ushiki T, Seillet C, Minnich M, Kolesnik TB, Rankin LC, Mielke LA, Zhang JG, Busslinger M, Smyth MJ, Hutchinson DS, Nutt SL, Nicholson SE, Alexander WS, Corcoran LM, Vivier E, Belz GT, Carotta S, Huntington ND, The Helix-Loop-Helix Protein ID2 Governs NK Cell Fate by Tuning Their Sensitivity to Interleukin-15. Immunity 44, 103–115 (2016). [DOI] [PubMed] [Google Scholar]
- 16.Miyazaki M, Rivera RR, Miyazaki K, Lin YC, Agata Y, Murre C, The opposing roles of the transcription factor E2A and its antagonist Id3 that orchestrate and enforce the naive fate of T cells. Nat Immunol 12, 992–1001 (2011). [DOI] [PMC free article] [PubMed] [Google Scholar]
- 17.Xu Y, Evaristo C, Alegre ML, Gurbuxani S, Kee BL, Analysis of GzmbCre as a Model System for Gene Deletion in the Natural Killer Cell Lineage. PLoS One 10, e0125211 (2015). [DOI] [PMC free article] [PubMed] [Google Scholar]
- 18.Gabrielli S, Sun M, Bell A, Zook EC, de Pooter RF, Zamai L, Kee BL, Murine thymic NK cells are distinct from ILC1s and have unique transcription factor requirements. Eur J Immunol, (2017). [DOI] [PMC free article] [PubMed] [Google Scholar]
- 19.Yokota Y, Mansouri A, Mori S, Sugawara S, Adachi S, Nishikawa S, Gruss P, Development of peripheral lymphoid organs and natural killer cells depends on the helix-loop-helix inhibitor Id2. Nature 397, 702–706 (1999). [DOI] [PubMed] [Google Scholar]
- 20.Boos MD, Yokota Y, Eberl G, Kee BL, Mature natural killer cell and lymphoid tissue-inducing cell development requires Id2-mediated suppression of E protein activity. J Exp Med 204, 1119–1130 (2007). [DOI] [PMC free article] [PubMed] [Google Scholar]
- 21.Huang da W, Sherman BT, Lempicki RA, Systematic and integrative analysis of large gene lists using DAVID bioinformatics resources. Nat Protoc 4, 44–57 (2009). [DOI] [PubMed] [Google Scholar]
- 22.Huang da W, Sherman BT, Lempicki RA, Bioinformatics enrichment tools: paths toward the comprehensive functional analysis of large gene lists. Nucleic Acids Res 37, 1–13 (2009). [DOI] [PMC free article] [PubMed] [Google Scholar]
- 23.Huntington ND, Puthalakath H, Gunn P, Naik E, Michalak EM, Smyth MJ, Tabarias H, Degli-Esposti MA, Dewson G, Willis SN, Motoyama N, Huang DC, Nutt SL, Tarlinton DM, Strasser A, Interleukin 15-mediated survival of natural killer cells is determined by interactions among Bim, Noxa and Mcl-1. Nat Immunol 8, 856–863 (2007). [DOI] [PMC free article] [PubMed] [Google Scholar]
- 24.Sun JC, Madera S, Bezman NA, Beilke JN, Kaplan MH, Lanier LL, Proinflammatory cytokine signaling required for the generation of natural killer cell memory. J Exp Med 209, 947–954 (2012). [DOI] [PMC free article] [PubMed] [Google Scholar]
- 25.Madera S, Sun JC, Cutting edge: stage-specific requirement of IL-18 for antiviral NK cell expansion. J Immunol 194, 1408–1412 (2015). [DOI] [PMC free article] [PubMed] [Google Scholar]
- 26.Sun JC, Beilke JN, Lanier LL, Adaptive immune features of natural killer cells. Nature 457, 557–561 (2009). [DOI] [PMC free article] [PubMed] [Google Scholar]
- 27.Karo JM, Schatz DG, Sun JC, The RAG recombinase dictates functional heterogeneity and cellular fitness in natural killer cells. Cell 159, 94–107 (2014). [DOI] [PMC free article] [PubMed] [Google Scholar]
- 28.Subramanian A, Tamayo P, Mootha VK, Mukherjee S, Ebert BL, Gillette MA, Paulovich A, Pomeroy SL, Golub TR, Lander ES, Mesirov JP, Gene set enrichment analysis: a knowledge-based approach for interpreting genome-wide expression profiles. Proc Natl Acad Sci U S A 102, 15545–15550 (2005). [DOI] [PMC free article] [PubMed] [Google Scholar]
- 29.Mootha VK, Lindgren CM, Eriksson KF, Subramanian A, Sihag S, Lehar J, Puigserver P, Carlsson E, Ridderstrale M, Laurila E, Houstis N, Daly MJ, Patterson N, Mesirov JP, Golub TR, Tamayo P, Spiegelman B, Lander ES, Hirschhorn JN, Altshuler D, Groop LC, PGC-1alpha-responsive genes involved in oxidative phosphorylation are coordinately downregulated in human diabetes. Nat Genet 34, 267–273 (2003). [DOI] [PubMed] [Google Scholar]
- 30.Tripathi S, Pohl MO, Zhou Y, Rodriguez-Frandsen A, Wang G, Stein DA, Moulton HM, DeJesus P, Che J, Mulder LC, Yanguez E, Andenmatten D, Pache L, Manicassamy B, Albrecht RA, Gonzalez MG, Nguyen Q, Brass A, Elledge S, White M, Shapira S, Hacohen N, Karlas A, Meyer TF, Shales M, Gatorano A, Johnson JR, Jang G, Johnson T, Verschueren E, Sanders D, Krogan N, Shaw M, Konig R, Stertz S, Garcia-Sastre A, Chanda SK, Meta- and Orthogonal Integration of Influenza “OMICs” Data Defines a Role for UBR4 in Virus Budding. Cell Host Microbe 18, 723–735 (2015). [DOI] [PMC free article] [PubMed] [Google Scholar]
- 31.Buenrostro JD, Wu B, Chang HY, Greenleaf WJ, ATAC-seq: A Method for Assaying Chromatin Accessibility Genome-Wide. Curr Protoc Mol Biol 109, 21 29 21–29 (2015). [DOI] [PMC free article] [PubMed] [Google Scholar]
- 32.Massari ME, Murre C, Helix-loop-helix proteins: regulators of transcription in eucaryotic organisms. Mol Cell Biol 20, 429–440 (2000). [DOI] [PMC free article] [PubMed] [Google Scholar]
- 33.Tassi I, Cella M, Presti R, Colucci A, Gilfillan S, Littman DR, Colonna M, NK cell-activating receptors require PKC-theta for sustained signaling, transcriptional activation, and IFN-gamma secretion. Blood 112, 4109–4116 (2008). [DOI] [PMC free article] [PubMed] [Google Scholar]
- 34.Balasubramani A, Shibata Y, Crawford GE, Baldwin AS, Hatton RD, Weaver CT, Modular utilization of distal cis-regulatory elements controls Ifng gene expression in T cells activated by distinct stimuli. Immunity 33, 35–47 (2010). [DOI] [PMC free article] [PubMed] [Google Scholar]
- 35.Chaix J, Tessmer MS, Hoebe K, Fuseri N, Ryffel B, Dalod M, Alexopoulou L, Beutler B, Brossay L, Vivier E, Walzer T, Cutting edge: Priming of NK cells by IL-18. J Immunol 181, 1627–1631 (2008). [DOI] [PMC free article] [PubMed] [Google Scholar]
- 36.Yu B, Zhang K, Milner JJ, Toma C, Chen R, Scott-Browne JP, Pereira RM, Crotty S, Chang JT, Pipkin ME, Wang W, Goldrath AW, Epigenetic landscapes reveal transcription factors that regulate CD8(+) T cell differentiation. Nat Immunol 18, 573–582 (2017). [DOI] [PMC free article] [PubMed] [Google Scholar]
- 37.Yang CY, Best JA, Knell J, Yang E, Sheridan AD, Jesionek AK, Li HS, Rivera RR, Lind KC, D’Cruz LM, Watowich SS, Murre C, Goldrath AW, The transcriptional regulators Id2 and Id3 control the formation of distinct memory CD8+ T cell subsets. Nat Immunol 12, 1221–1229 (2011). [DOI] [PMC free article] [PubMed] [Google Scholar]
- 38.Masson F, Minnich M, Olshansky M, Bilic I, Mount AM, Kallies A, Speed TP, Busslinger M, Nutt SL, Belz GT, Id2-mediated inhibition of E2A represses memory CD8+ T cell differentiation. J Immunol 190, 4585–4594 (2013). [DOI] [PMC free article] [PubMed] [Google Scholar]
- 39.Verykokakis M, Boos MD, Bendelac A, Adams EJ, Pereira P, Kee BL, Inhibitor of DNA binding 3 limits development of murine slam-associated adaptor protein-dependent “innate” gammadelta T cells. PLoS One 5, e9303 (2010). [DOI] [PMC free article] [PubMed] [Google Scholar]
- 40.Hyndman BD, Thompson P, Bayly R, Cote GP, LeBrun DP, E2A proteins enhance the histone acetyltransferase activity of the transcriptional co-activators CBP and p300. Biochim Biophys Acta 1819, 446–453 (2012). [DOI] [PubMed] [Google Scholar]
- 41.Bayly R, Chuen L, Currie RA, Hyndman BD, Casselman R, Blobel GA, LeBrun DP, E2A-PBX1 interacts directly with the KIX domain of CBP/p300 in the induction of proliferation in primary hematopoietic cells. J Biol Chem 279, 55362–55371 (2004). [DOI] [PubMed] [Google Scholar]
- 42.Williams CJ, Naito T, Arco PG, Seavitt JR, Cashman SM, De Souza B, Qi X, Keables P, Von Andrian UH, Georgopoulos K, The chromatin remodeler Mi-2beta is required for CD4 expression and T cell development. Immunity 20, 719–733 (2004). [DOI] [PubMed] [Google Scholar]
- 43.Knell J, Best JA, Lind NA, Yang E, D’Cruz LM, Goldrath AW, Id2 influences differentiation of killer cell lectin-like receptor G1(hi) short-lived CD8+ effector T cells. J Immunol 190, 1501–1509 (2013). [DOI] [PMC free article] [PubMed] [Google Scholar]
- 44.Koues OI, Collins PL, Cella M, Robinette ML, Porter SI, Pyfrom SC, Payton JE, Colonna M, Oltz EM, Distinct Gene Regulatory Pathways for Human Innate versus Adaptive Lymphoid Cells. Cell 165, 1134–1146 (2016). [DOI] [PMC free article] [PubMed] [Google Scholar]
- 45.Shih HY, Sciume G, Mikami Y, Guo L, Sun HW, Brooks SR, Urban JF Jr., Davis FP, Kanno Y, O’Shea JJ, Developmental Acquisition of Regulomes Underlies Innate Lymphoid Cell Functionality. Cell 165, 1120–1133 (2016). [DOI] [PMC free article] [PubMed] [Google Scholar]
- 46.Yu VW, Yusuf RZ, Oki T, Wu J, Saez B, Wang X, Cook C, Baryawno N, Ziller MJ, Lee E, Gu H, Meissner A, Lin CP, Kharchenko PV, Scadden DT, Epigenetic Memory Underlies Cell-Autonomous Heterogeneous Behavior of Hematopoietic Stem Cells. Cell 167, 1310–1322 e1317 (2016). [DOI] [PubMed] [Google Scholar]
- 47.Liu X, Chen X, Zhong B, Wang A, Wang X, Chu F, Nurieva RI, Yan X, Chen P, van der Flier LG, Nakatsukasa H, Neelapu SS, Chen W, Clevers H, Tian Q, Qi H, Wei L, Dong C, Transcription factor achaete-scute homologue 2 initiates follicular T-helper-cell development. Nature 507, 513–518 (2014). [DOI] [PMC free article] [PubMed] [Google Scholar]
- 48.Miyazaki M, Miyazaki K, Chen S, Itoi M, Miller M, Lu LF, Varki N, Chang AN, Broide DH, Murre C, Id2 and Id3 maintain the regulatory T cell pool to suppress inflammatory disease. Nat Immunol 15, 767–776 (2014). [DOI] [PMC free article] [PubMed] [Google Scholar]
- 49.Rydyznski C, Daniels KA, Karmele EP, Brooks TR, Mahl SE, Moran MT, Li C, Sutiwisesak R, Welsh RM, Waggoner SN, Generation of cellular immune memory and B-cell immunity is impaired by natural killer cells. Nat Commun 6, 6375 (2015). [DOI] [PMC free article] [PubMed] [Google Scholar]
- 50.Leong YA, Chen Y, Ong HS, Wu D, Man K, Deleage C, Minnich M, Meckiff BJ, Wei Y, Hou Z, Zotos D, Fenix KA, Atnerkar A, Preston S, Chipman JG, Beilman GJ, Allison CC, Sun L, Wang P, Xu J, Toe JG, Lu HK, Tao Y, Palendira U, Dent AL, Landay AL, Pellegrini M, Comerford I, McColl SR, Schacker TW, Long HM, Estes JD, Busslinger M, Belz GT, Lewin SR, Kallies A, Yu D, CXCR5(+) follicular cytotoxic T cells control viral infection in B cell follicles. Nat Immunol 17, 1187–1196 (2016). [DOI] [PubMed] [Google Scholar]
- 51.Fodil-Cornu N, Lee SH, Belanger S, Makrigiannis AP, Biron CA, Buller RM, Vidal SM, Ly49h-deficient C57BL/6 mice: a new mouse cytomegalovirus-susceptible model remains resistant to unrelated pathogens controlled by the NK gene complex. J Immunol 181, 6394–6405 (2008). [DOI] [PMC free article] [PubMed] [Google Scholar]
- 52.Bolstad BM, Irizarry RA, Astrand M, Speed TP, A comparison of normalization methods for high density oligonucleotide array data based on variance and bias. Bioinformatics 19, 185–193 (2003). [DOI] [PubMed] [Google Scholar]
- 53.Li C, Hung Wong W, Model-based analysis of oligonucleotide arrays: model validation, design issues and standard error application. Genome Biol 2, RESEARCH0032 (2001). [DOI] [PMC free article] [PubMed] [Google Scholar]
- 54.Bolger AM, Lohse M, Usadel B, Trimmomatic: a flexible trimmer for Illumina sequence data. Bioinformatics 30, 2114–2120 (2014). [DOI] [PMC free article] [PubMed] [Google Scholar]
- 55.Langmead B, Salzberg SL, Fast gapped-read alignment with Bowtie 2. Nat Methods 9, 357–359 (2012). [DOI] [PMC free article] [PubMed] [Google Scholar]
- 56.A. Wysoker, K. Tibbetts, T. Fennell. (http://picard.sourceforge.net, 2013).
- 57.Zhang Y, Liu T, Meyer CA, Eeckhoute J, Johnson DS, Bernstein BE, Nusbaum C, Myers RM, Brown M, Li W, Liu XS, Model-based analysis of ChIP-Seq (MACS). Genome Biol 9, R137 (2008). [DOI] [PMC free article] [PubMed] [Google Scholar]
- 58.Chen K, Xi Y, Pan X, Li Z, Kaestner K, Tyler J, Dent S, He X, Li W, DANPOS: dynamic analysis of nucleosome position and occupancy by sequencing. Genome Res 23, 341–351 (2013). [DOI] [PMC free article] [PubMed] [Google Scholar]
- 59.Heinz S, Benner C, Spann N, Bertolino E, Lin YC, Laslo P, Cheng JX, Murre C, Singh H, Glass CK, Simple combinations of lineage-determining transcription factors prime cis-regulatory elements required for macrophage and B cell identities. Mol Cell 38, 576–589 (2010). [DOI] [PMC free article] [PubMed] [Google Scholar]
- 60.Shen L, Shao N, Liu X, Nestler E, ngs.plot: Quick mining and visualization of next-generation sequencing data by integrating genomic databases. BMC Genomics 15, 284 (2014). [DOI] [PMC free article] [PubMed] [Google Scholar]
- 61.Freese NH, Norris DC, Loraine AE, Integrated genome browser: visual analytics platform for genomics. Bioinformatics 32, 2089–2095 (2016). [DOI] [PMC free article] [PubMed] [Google Scholar]
- 62.Verykokakis M, Boos MD, Bendelac A, Kee BL, SAP protein-dependent natural killer T-like cells regulate the development of CD8(+) T cells with innate lymphocyte characteristics. Immunity 33, 203–215 (2010). [DOI] [PMC free article] [PubMed] [Google Scholar]
Associated Data
This section collects any data citations, data availability statements, or supplementary materials included in this article.