

Abstract
The complexation equilibria between Mg2+ and d-gluconate (Gluc–) ions are of particular importance in modeling the chemical speciation in low- and intermediate-level radioactive waste repositories. NMR measurements and potentiometric titrations conducted at 25 °C and 4 M ionic strength revealed the formation of the MgGluc+, MgGlucOH0, MgGluc(OH)2–, and Mg3Gluc2(OH)40 complexes. The trinuclear species provides indirect evidence for the existence of multinuclear magnesium(II) hydroxido complexes, whose formation was proposed earlier but has not been confirmed yet. Additionally, speciation calculations demonstrated that MgCl2 can markedly decrease the solubility of thorium(IV) at low ligand concentrations. Regarding the structure of MgGluc+, both IR spectra and density functional theory (DFT) calculations indicate the monodentate coordination of Gluc–. By the potentiometric data, the acidity of the water molecules is higher in the MgGluc+ and MgGlucOH0 species than in the Mg(H2O)62+ aqua ion. On the basis of DFT calculations, this ligand-promoted hydrolysis is caused by strong hydrogen bonds forming between Gluc– and Mg(H2O)62+. Conversely, metal-ion-induced ligand deprotonation takes place in the case of calcium(II) complexes, giving rise to salient variations on the NMR spectra in a strongly alkaline medium.
Short abstract
Combining potentiometric, NMR spectroscopic, and density functional theory quantum-chemical methods, we gained a detailed understanding about the complexation equilibria between magnesium(II) and d-gluconate ions. The thermodynamic aspect of the results is that, under the conditions of radioactive waste disposals, MgCl2 may lower the solubility of thorium(IV). Regarding the structural implications, we found that deprotonation of the magnesium(II) gluconate complexes takes place on the metal-bound water molecule(s) and is promoted by the formation of strong hydrogen bonds.
Introduction
The chemical behavior of actinides in aqueous solutions is of general importance for the disposal of nuclear waste in underground salt mines. The solubility of actinide hydroxides in the so-called pore water is determined by various factors, such as the pH, ionic strength, presence of complexing agents, etc. Portland cement, used for the formulation of cementitious materials,1 has a large impact on the solution pH. The pH of the pore water is known to increase from neutral to ca. 12.5 because of the dissolution of Ca(OH)2(s).2 In underground salt mines, concentrated MgCl2- or NaCl-containing salt brines are supposed to form as a result of the incidental intrusion of water.3 Bube and co-workers reported that, for brines containing ≈3.8 M MgCl2, the pH increases to ≈12, while most of the Mg2+ ions are replaced by Ca2+ ions.3 In leachant solutions containing ≈5.4 M NaCl, the pH becomes as high as 13.
In principle, a highly caustic medium leads to the precipitation of radionuclides, thereby lowers their mobility as well as their release to the geosphere. The presence of various organic molecules, however, may result in an increase of the solubility through the formation of stable metal complexes. d-Gluconate (Gluc–; Scheme 1), being used as an additive in cement,4 is likely to be present in underground repositories; thus, it is regarded as a general model compound for organic contaminants. Gluc– is known to chelate thorium(IV),5,6 uranium(IV),7 uranium(VI),8,9 neptunium(IV),10 plutonium(IV),11,12 and americium(III)13 in an alkaline medium.
Scheme 1. Structural Formula of Gluc–

In a caustic medium, one of the OH groups of Gluc– undergoes deprotonation:
| 1 |
The corresponding concentration stability constant, Ka, reads as
| 2 |
where c⌀ is the standard molar concentration, 1 mol·dm–3. In concentrated electrolyte solutions, the pK was found to be 13.7 (I = 1 M)14,15 and 14.1 (I = 4 M).16 Additionally, the deprotonation reaction was invoked to explain the solubility curve of UO2(OH)2(s)9 as well as Th(OH)4(s)5,17 in the presence of Gluc–. The pK of the ThGluc(OH)4– aqueous species was calculated to be 9.2 (at infinite dilution).17 In conclusion, deprotonation of Gluc– occurs more readily in its metal-bound form compared to the free ligand.
The solubility of actinides can be affected by CaCl2 and/or MgCl2; both salts are expected to be present at high concentrations.3 First, stable binary complexes forming between Ca2+ or Mg2+ and Gluc– ions may suppress the formation of actinide gluconate species, resulting in a decrease of the solubility. For calcium(II), the formation of CaGlucOH0 was detected above pH ≈ 11, while the multinuclear Ca2Gluc(OH)30 and Ca3Gluc2(OH)40 complexes are the predominant ones at higher CaCl2 and ligand concentrations.15
Second, the formation of ternary species consisting of calcium(II), actinide(IV), and gluconate ions increases the solubility. For thorium(IV), the CaThGluc2(OH)40 complex was proposed to elucidate the sorption properties of thorium(IV) onto calcite at pH = 13.3.13 The formation of this ternary species can be promoted via the mononuclear CaGlucOH0:
| 3 |
Ternary complexes with similar stoichiometry and stability might be formed with Mg2+ ions as well. Contrary to Ca2+/Gluc– complexes, the literature concerning Mg2+/Gluc– interactions is sporadic. In an early paper, the MgGluc+ species was reported to form at neutral pH.18 Using IR and 1H NMR spectroscopic means at 25 °C, it was found that the interaction with Mg2+ mainly localizes to the carboxylate group of Gluc–.19 Above ≈35 °C, 13C NMR relaxation studies indicated the additional participation of the terminal hydroxymethyl group (C6-OH; Scheme 1).20 Alteration of the coordination mode was interpreted in terms of conformational changes: at T < 30 °C, Gluc– exists in solution as a mixture of the planar (zigzag) and bent-chain forms. With increasing temperature, however, the bent-chain conformer becomes predominant,20−23 rendering the simultaneous coordination of COO– and C6-OH possible.
In contrast to Ca2+, the complexation equilibria between Mg2+ and Gluc– ions in the alkaline pH regime were not studied. The formation of such coordination compounds may have a marked influence on the solubility of actinides in the presence of Gluc–. Thus, for modeling the solubility and aqueous speciation of these metal ions in MgCl2-containing solutions, a quantitative description of the Mg2+/Gluc–/OH– system is indispensable. Furthermore, to reveal the binding sites of the ligand and to make reliable comparisons with the calcium(II) complexes, structural analysis of the magnesium(II) species is necessary.
In this Article, we report on the solution equilibria of magnesium(II) gluconate complexes forming in a neutral-to-alkaline medium. The complexation reactions were studied by potentiometry, IR as well as 1H and 13C NMR spectroscopies. Additionally, the experiments were augmented with quantum-chemical computations. The results are discussed with respect to (1) the effect of MgCl2 on the solubility of thorium(IV) and (2) the possible structures of the magnesium(II) gluconate complexes in comparison with the calcium(II) ones.
Experimental Section
Reagents and Solutions
NaGluc (≥98%, Acros Organics), MgCl2·6H2O (ACS grade, VWR Chemicals), CaCl2·2H2O (ACS grade, VWR Chemicals), and NaCl (analytical reagent grade, VWR Chemicals) were used without further purification. Stock solutions of NaGluc, MgCl2, and CaCl2 were prepared by dissolving the salts in Milli-Q Millipore water. The exact concentration of the Mg2+ or Ca2+ ions was determined by ethylenediaminetetraacetic acid titration.
A 1 M stock solution of NaOH was prepared by diluting a carbonate-free 50% (w/w) NaOH prepared by the procedure reported in ref (24). The NaOH solution was then standardized against HCl. The 1 M stock solution of HCl was made by volumetric dilution of ≈37% (w/w) HCl (analytical reagent grade, VWR Chemicals), and its concentration was determined via titration of a KHCO3 solution.
Potentiometric Titrations
The potentiometric titrations were carried out using a Metrohm Titrando 888 titration instrument in a double-jacketed glass cell. Each solution was stirred continuously, while the temperature was kept at 25.0 ± 0.1 °C by a Julabo F12-MB thermostat. The equilibrium cell potentials were measured by a Jenway 3540 Bench pH and conductivity meter using a SenTiX-62 combined glass electrode (from WTW). The ionic strength was adjusted to 4 M with NaCl.
During the course of electrode calibration, a weak acid (0.200 M malonic acid) and, subsequently, a strong acid (0.196 M HCl) were titrated with ≈1 M NaOH. These titration curves were evaluated with the pHCali(25) software. The program applies a nonlinear-fitting procedure, allowing for calculation of the electrode slope and intercept, the pKw, the first and second protonation constants of the malonate ion, the exact concentration of the titrant, and the carbonate content. For log Kw, a value of –14.26 was used (determined previously by applying a platinized platinum electrode),16 while the two protonation constants of CO32– were taken from the literature.26
As a result, the electrode response was found to be linear in the range of 1.8 < pHc < 12.2, where pHc is defined as −log([H+]/cø). The linear relationship is demonstrated in Figures S1 and S2. Furthermore, the ratio of CO32– relative to NaOH was found to be <0.5 mol %, while the slope and intercept (±3SE) were calculated to be 58.1 ± 0.2 and 456.3 ± 1.1 mV, respectively. On the basis of the latter parameter, the error in pHc is ±0.02, which we consider to be the minimum error of the equilibrium constants determined.
To investigate the protonation of Gluc–, two series were studied: 70 mL solutions containing [Gluc–]T = 0.100 and 0.200 M were titrated with 0.246 and 0.496 M HCl solutions, respectively. For component X, hereafter [X]T,0 or [X]T represents its initial total (at V = 0 for titrations) or simply its total concentration (for NMR and IR measurements), while [X] is referred to as the equilibrium concentration.
To study the complex formation between Mg2+ and Gluc– ions, two titration series were undertaken. First, 70 mL solutions with [Gluc–]T,0 = 0.100–0.200 M, [Mg2+]T,0 = 0.051–0.203 M, and [HCl]T,0 = 0.005 M were titrated with 0.050 M NaOH. Second, 70 mL samples containing [Gluc–]T,0 = 0.100–0.200 M and [OH–]T,0 = 0.005–0.100 M or [HCl]T,0 = 0.096 M were titrated with 1.017 M MgCl2.
NMR Spectroscopic Measurements
1H and 13C NMR spectra were recorded with a Bruker Ascend 500 MHz NMR spectrometer equipped with a 5 mm inverse broad-band probe head furnished with z-oriented magnetic-field-gradient capability. The magnetic field was stabilized by locking it to the 2D signal of the solvent prior to spectral acquisition. The sample temperature was set to 25 ± 1 °C for measurements at a constant temperature and to 7–47 °C during the temperature-dependent experiments. 10% (v/v) D2O was added to each sample, and 32 or 256 interferograms were collected to obtain the 1H or 13C NMR spectra. For comparison, the spectra were baseline-corrected and normalized.
The pH values of the solutions were set using the SenTix-62 electrode, which was calibrated with buffers (obtained from WTW). Conversely, the activity coefficient of H+ in the buffers is considerably different from that in the samples because of the more concentrated ionic media and use of D2O in the latter. Thus, the nominal pH adjusted in the solutions is referred to as pH* hereafter, and its deviation from the real pH can be estimated as ±0.2 units. Nevertheless, this difference is acceptable for qualitative purposes.
To study the complex formation between Mg2+ and Gluc– at neutral pH, solutions with [Gluc–]T = 0.200 M and [Mg2+]T = 0.000–0.492 M were prepared. The ionic strength was adjusted to 4 M. It has to be noted that incidental variations in the pH may affect the chemical shifts of Gluc–. For this series, however, the pH* was found to be 6.7–6.9; thus, the formation of HGluc can be ruled out. Consequently, the observed changes in the chemical shifts were solely due to complex formation.
To study the pH dependence of the spectra, sample sets with [Gluc–]T = 0.2 M as well as [Gluc–]T = 0.2 M and [Mg2+]T or [Ca2+]T = 0.1 M were prepared at pH* = 6–13. The temperature dependence of a solution containing [Gluc–]T = 0.2 M and [Mg2+]T = 0.1 M was studied in the range of 7–47 °C, and the pH* was adjusted to 10.0 at T = 22 °C. In each case, the pH* was set by HCl or NaOH solutions (right before the measurements), and the ionic strength was not adjusted.
IR Spectroscopic Measurements
The IR spectra were recorded at room temperature, using a Bio-Rad Digital Division FTS-65 A/896 Fourier transform infrared instrument with a spectral resolution of 4 cm–1. The measurements were performed in transmittance mode in the 750–4000 cm–1 range, and 256 scans were collected for each sample. The spectra were baseline-corrected and normalized.
To investigate the effect of Mg2+ ions on the IR absorption of gluconate, a series with [Gluc–]T = 0.2 M and [Mg2+]T = 0–1.0 M was prepared by applying D2O as the solvent. The pH* values of the solutions were checked and found to be neutral.
Computations
Data Evaluation and Speciation Calculations
The potentiometric and NMR spectroscopic data were evaluated with the aid of PSEQUAD.27 The general complexation reaction and corresponding conditional stability product, βpqr, read as
| 4 |
| 5 |
During fitting, the stability product, log βpqr, was refined by minimizing the so-called fitting parameter, FP, which reads as
| 6 |
where Yi,calc and Yi,meas pertain to the calculated and measured data (pHc or chemical shift), while n and k represent the number of the measured data and fitted parameters, respectively. The log Kw value was set to −14.2616 throughout the calculations.
For homogeneous systems, speciation calculations were carried out utilizing the MEDUSA(28) program. For heterogeneous systems, where the solubility is controlled by Th(OH)4(s), PSEQUAD(27) was applied by setting the Th(OH)4(aq) complex as the primary species. The stability product of Th(OH)4(s) and those of the various hydrolysis species, Th(OH)r(4–r)+, were taken from the respective NEA-TDB review.29 No formation constant was selected for the Th(OH)3+ complex; hence, it was taken from ref (30). Concerning the gluconate complexes of thorium(IV),5,6 the equilibrium constants were taken from ref (17). All of these values are presented in Table S1.
In order to perform speciation calculations for the Th4+/Mg2+/Gluc–/OH– system, the literature data of the thorium(IV)-containing species were converted to I = 4 M. For this purpose, the specific-ion-interaction theory (SIT)31−34 was applied. The SIT introduces ion-interaction parameters (εij) to describe short-range ion interactions and the ionic strength dependence of the mean activity coefficient. It is worth mentioning that, in general, the Pitzer approach35 or the modified SIT36 is known to be more accurate at higher ionic strength. The literature data, however, are insufficient (especially for the gluconate complexes) to perform accurate calculations with these models. Nonetheless, the SIT approach was found to be applicable at I > 4 M in numerous cases, a also for different background electrolytes,37−39 including NaCl.40,41 Hence, we used this model following the approach of the standard NEA-TDB review.29
The respective εij coefficients (Table S2) were taken from refs (29) and (42). The stability constants calculated using the SIT equation are listed in Table S1. For further details, the reader is referred to the Supporting Information and to refs (29)–34.
Quantum-Chemical Calculations
To model the structure of the complexes, in vacuo calculations were performed using the M11 range-separated hybrid meta-generalized gradient approximation density functional theory (DFT) functional43 coupled with the cc-pVDZ basis set. The recently developed M11 functional was shown to provide excellent performance for main-group energies, proton and electron affinities, barrier heights, bond dissociation, and noncovalent interaction energies. The computations were coupled with conformational analysis by varying the freely rotating HCCH dihedral angles of Gluc–.
Subsequent geometry optimizations of all structures were carried out utilizing the same functional and the aug-cc-pVTZ basis set. These calculations with the higher basis set were undertaken by taking solvent effects into account with the aid of the conductor-like polarizable continuum model (CPCM)44 (where water was considered to be the solvent). All calculations were carried out using the Gaussian09(45) software package.
Results and Discussion
Complexation between Mg2+ and Gluc– in a Neutral Medium
With increasing [MgCl2]T in solutions containing [Gluc–]T = 0.2 M, the H2 and H3 NMR signals of Gluc– show a gradual downfield shift (Figure 1). Simultaneously, the position of the C1 signal shifts upfield. Such variations indicate complex formation as in the case of Ca2+ binding, which was confirmed by 2D 1H–43Ca NMR measurements.46 Moreover, no additional peaks appear on the spectra, which stems from fast ligand-exchange processes between free and complexed Gluc–.
Figure 1.

1H and 13C NMR chemical shifts as a function of [Mg2+]T. Experimental conditions: I = 4 M (NaCl) and T = 25 ± 1 °C; [Gluc–]T = 0.200 M. Symbols represent measured data, while solid lines were calculated assuming the formation of MgGluc+. The chemical shifts were normalized to the neat Gluc– ion for better visualization.
The experimentally obtained chemical shifts were fitted as a function of [Mg2+]T, assuming formation of the 1:1 complex.18 The relationship between the observed chemical shift (δobs) and the equilibrium concentrations of Gluc– and MgGluc+ is as follows:
| 7 |
where δGluc– and δMgGluc+ are the limiting chemical shifts of Gluc– and MgGluc+, respectively.
When solely the 13C chemical shifts are fitted, log β110 was determined to be 0.25–0.33, with FP (eq 6) being 0.002–0.006 ppm. When only the 1H chemical shifts are fitted, log β110 ranged from 0.46 to 0.60 (FP = 0.0006–0.0012 ppm). When both the 1H and 13C shifts were taken into account, log β110 was found to be 0.25 on average (FP = 0.002 ppm). The best fitting from each set is shown in Table 1, while the calculations considering all chemical shifts are depicted in Figure 1.
Table 1. Stability Products, log βpqr, for Equilibria Taking Place in the Mg2+/Gluc–/H3O+/OH– Systema.
| reaction | log βpqr ± 3SE | methodb | ref |
|---|---|---|---|
| H2O = H+ + OH– | –14.26 | H2-Pt POT | (16) |
| HGluc = Gluc– + H+ | –3.73 ± 0.05 | GLE POT | p.w. |
| Gluc– = GlucH–12– + H+ | –13.92 ± 0.06 | GLE POT | p.w. |
| –14.08 ± 0.03 | H2-Pt POT | (16) | |
| –13.90 ± 0.03 | 13C NMR | (16) | |
| Mg2+ + H2O = MgOH+ + H+ | –12.33 ± 0.18 | GLE POT | (47) |
| Ca2+ + H2O = CaOH+ + H+ | –13.92 ± 0.36 | ISE POT | (48) |
| Mg(OH)2(s) + 2H2O = Mg2+ + 2H+ | 17.64 ± 0.20c,d | SOL/ICP-OES | (49) |
| Ca(OH)2(s) + 2H2O = Ca2+ + 2H+ | 24.00 ± 0.09c | ISE POT | (48) |
| Mg2+ + Gluc– = MgGluc+ | 0.47 ± 0.05 | 1H NMR | p.w. |
| 0.25 ± 0.02 | 13C NMR | p.w. | |
| 0.25 ± 0.05 | 1H/13C NMR | p.w. | |
| 0.33 ± 0.04 | GLE POT | p.w. | |
| 0.4 ± 0.2e | p.w. | ||
| 0.70d | GLE POT | (18) | |
| Ca2+ + Gluc– = CaGluc+ | 0.85 ± 0.15 | 13C NMR | (46) |
| 1.21d | GLE POT | (18) | |
| Mg2+ + Gluc– + H2O = MgGlucOH0 + H+ | –10.20 ± 0.01 | GLE POT | p.w. |
| Ca2+ + Gluc– + H2O = CaGlucOH0 + H+ | –11.73 ± 0.03 | H2-Pt POT | (16) |
| Mg2+ + Gluc– + 2H2O = MgGluc(OH)2– + 2H+ | –21.66 ± 0.06 | GLE POT | p.w. |
| 3Mg2+ + 2Gluc– + 4H2O = Mg3Gluc2(OH)40 + 4H+ | –38.52 ± 0.10 | GLE POT | p.w. |
| 3Ca2+ + 2Gluc– + 4H2O = Ca3Gluc2(OH)40 + 4H+ | –43.80 ± 0.03 | H2-Pt POT | (16) |
For comparison, analogous constants for the Ca2+/Gluc–/H3O+/OH– system are presented. The constants correspond to T = 25 °C and I = 4 M (NaCl), unless indicated differently.
H2-Pt, GLE, ISE POT: potentiometry applying hydrogen (platinized platinum), glass or calcium ion-selective electrode. 1H and 13C NMR: nuclear magnetic resonance spectroscopy. SOL/ICP-OES: solubility determined with inductively coupled plasma optical emission spectroscopy.
Here the solubility product (log Ksp) is given.
Recommended value for log β110 (see the text for discussion).
The difference in the formation constants obtained by 1H and 13C nuclei is not unusual for weak complexes because β110 and the actual limiting chemical shifts are highly correlated. Hence, on the basis of the NMR results, we suggest 0.4 ± 0.2 for log β110; this value is in reasonable agreement with log β110 = 0.70 determined potentiometrically at I = 0.2 M.18 Using log β110 = 0.4, 50% of the ligand molecules are complexed at the highest [MgCl2]T (Figure S3).
Although the uncertainty of the formation constant of MgGluc+ is rather high, it seems to be less stable than CaGluc+. This difference is unambiguous in Cannan and Kibrick’s work: they determined log β110 = 0.70 for MgGluc+ and 1.21 for CaGluc+.18 In general, the stability order of 1:1 complexes forming between alkaline-earth metal and glycolate, lactate, or glycerate ions is as follows: Mg2+ < Ca2+ > Sr2+ > Ba2+.18,50,51 From Ca2+ to Ba2+, the decreasing order follows from the decreasing charge density of the cation.
Conversely, other thermodynamic factors may play important roles in the complex formation reactions of Mg2+. First, Mg2+ prefers 6-fold coordination, while the first coordination sphere of Ca2+ is rather flexible, with the hydration number being 6–8.52−59 As a result, binding of the COO– group requires the loss of (at least) one solvent molecule for Mg2+, while Ca2+ can accommodate it without dehydration, yielding more stable calcium(II) complexes. Moreover, if dehydration occurs in both cases, it is again more favorable for Ca2+: the enthalpy of dehydration was found to be 16.8–17.7 kJ·mol–1 for Ca(H2O)72+, while 23.4–24.2 kJ·mol–1 was determined for Mg(H2O)62+.60
It is important to note that the release of water molecules would result in higher disorder, thereby favoring the formation of MgGluc+. The higher stability constant of CaGluc+, however, indicates that enthalpy effects dominate the formation of 1:1 complexes.
Coordination Mode of Gluc– in the MgGluc+ Complex
The variations of the NMR chemical shifts do not allow one to decide whether Gluc– is bound in a mono- or a bidentate manner to the metal ion. To unravel the coordination mode in the 1:1 complex, a solution series of [Gluc–]T = 0.2 M and [Mg2+]T = 0–1 M was studied via IR spectrosopy, applying D2O as the solvent.
Upon the addition of Mg2+ ions, the region of O–H stretching vibrations (3000–3700 cm–1) does not exhibit any significant changes upon metal-ion coordination. In conclusion, the metal–ligand interactions are localized to the region of carboxylate stretching vibrations, in agreement with a previous IR study.19 Therefore, only this region is presented (Figure 2) and discussed.
Figure 2.

Traces of IR spectra of a solution series of [NaGluc]T = 0.2 M and [MgCl2]T = 0–1 M at room temperature.
Assignment of the symmetric and asymmetric stretching vibrations of Gluc– is rather difficult. The asymmetric vibration mode is obviously split into two components (1599 and 1653 cm–1), which was also previously observed on the spectrum of the solid NaGluc salt.16 Such a splitting is an indicative of two different coordination modes between the metal ion and ligand, as was proposed for the cobalt(II) acetate dihydrate and calcium succinate trihydrate salts.61,62 Conversely, given that Na+ is a weekly binding cation, the degree of association between Na+ and Gluc– is probably low; therefore, it cannot completely account for the observed splitting. An analogous interpretation can be the dynamic equilibrium between the planar and bent-chain conformations of the free ligand;20−23 however, none of these two scenarios can be unambiguously confirmed or ruled out. Nevertheless, the symmetric vibration mode must be split as well, giving rise to the appearance of two peaks in the region of 1350–1450 cm–1. Furthermore, this region coincides with the C–O–H bending modes,19,63 which explains the presence of a third peak in this frequency range.
Upon the addition of Mg2+ ions, the spectra simplify to two broad peaks, known as the symmetric and asymmetric COO– regions.63−65 Two important conclusions can be drawn from the observed variations. First, the disappearance of the splitting seen for Gluc– implies one coordination mode. Second, the distance between the peak maxima of the symmetric and asymmetric modes increases with increasing [Mg2+]T, as a token of complex formation. At [MgCl2]T = 1 M, ca. 70% of the ligand is bound in the 1:1 complex, where the distance is 180 cm–1. On the basis of IR analysis of numerous solid complexes,64,65 such a difference refers to the so-called pseudobridged monodentate coordination, where one oxygen atom of the COO– group is bound to the metal ion, while the other establishes hydrogen bonding of a neighboring OH group.
Solely on the basis of the IR spectra, participation of the OH groups in ligand coordination is still uncertain. To address this problem, quantum-chemical computations were undertaken. The following scenarios were taken into consideration: (1) monodentate binding, (2) bidentate coordination of COO–, and (3) monodentate binding of COO– and the adjacent OH group. During calculations, octahedral geometry around Mg2+ was assumed.
For bidentate coordination modes, the binding of both oxygen atoms of the COO– group (Figure S4) yields a less stable complex than monodentate coordination of both the COO– and OH groups (Figure S5). The difference in energy is 13.5 kJ·mol–1, significantly higher than the energy of thermal motion (≈2.5 kJ·mol–1 at 25 °C). Thus, bidentate coordination of COO– can be excluded, in agreement with the outcome of the IR experiments.
To compare the stabilities of the chelate (Figure S5) and monodentate species, the number of water molecules must match. Hence, a water molecule was added to the chelate complex, and its position was varied around the metal ion and along the gluconate backbone. The most stable structure is depicted in Figure S6. Alternatively, this complex represents the product of the reaction
| 8 |
Its energy, however, is higher by 6.2 kJ·mol–1 than that of Mg(H2O)5Gluc+ (Figure S7). In conclusion, the bidentate coordination of Gluc– is not favored because of the strong hydration of Mg2+. Additionally, one oxygen atom of COO– establishes strong hydrogen bonding with an axial metal-bound water molecule (dashed line in Figure S7), resulting in pseudobridged monodentate coordination.64,65 The discussion of the role of hydrogen bonding is deferred to the Role of Hydrogen Bonds in the MgGluc+ and MgGlucOH0 Complexes section.
In summary, both IR measurements and structure computations suggest that Gluc– acts as a monodentate ligand in the MgGluc+ complex. Conversely, chelate formation is preferred for CaGluc+.46
Effect of the pH on the Complexation between Mg2+ and Gluc– Ions
In order to examine the complex formation between Mg2+ and Gluc– as well as protonation of the ligand, a series of potentiometric titrations were performed in the pHc range of 1.9–12.1. To demonstrate the pH changes caused by complex formation, several comparative titration curves are shown in Figure 3.
Figure 3.

Equilibrium pHc values as a function of the added titrant volume. Experimental conditions: T = 25 ± 1 °C, I = 4 M (NaCl), and V0 = 70 mL; [HCl]T,0 = 0.005 M, while [Gluc–]T and [Mg2+]T are listed in the legend. The titrant was 0.050 M NaOH in each case. Hollow circles indicate the range of precipitation of Mg(OH)2(s). Inset: Zoomed region of the acidic and alkaline pH regimes.
The red curve depicts the pHc values of a slightly acidic solution of 0.2 M NaGluc titrated with NaOH. Upon the addition of MgCl2 (0–0.2 M), the shapes of the curves resemble that of 0.2 M NaGluc. The pHc, however, is much lower after the equivalence point, indicating complex formation.
Furthermore, the titration curves of solutions with [Gluc–]T,0 = 0.1 M and [Mg2+]T,0 = 0.1 M (orange curve) and [Gluc–]T,0 = 0.2 M and [Mg2+]T,0 = 0.05 M (blue curve) are essentially the same in the alkaline region. According to the Guldberg–Waage mass action law, the equilibrium concentration of the complex(es) formation must be proportional to that of [Mg2+]α·[Gluc–]β and, hence, to that of [Mg2+]Tα·[Gluc–]Tβ. Because in both cases [Mg2+]T·[Gluc–]T ≈ 0.01, the similar values of pHc imply that α = β = 1, i.e., the formation of 1:1 species. It is also worth mentioning that, with increasing [Mg2+]T,0, a small but significant decrease in pHc is discernible in the acidic region, which follows from the reaction
| 9 |
When the titration curve of the solution containing only 0.1 M MgCl2 (black curve) is compared to those containing Gluc–, it is seen that the increase of pHc is less steep for the latter, indicating a stronger buffering capacity and, thus, complexation between the Mg2+ and Gluc– ions in the alkaline regime. This is strongly supported by the fact that, in contrast to the solution with 0.1 M MgCl2, precipitation of Mg(OH)2(s) cannot be observed in the presence of Gluc–.
Expectedly, titrations performed with 1 M MgCl2 as the titrant (Figure S8) exhibit a remarkable pHc decrease (ΔpHc = 2) upon the addition of 5 mL of titrant. Starting with the titrations from the acidic region ([HCl]T,0 = 0.1 M), a lower but still pronounced pHc decrease (ΔpHc ≈ 0.3) is seen as a token of the formation of MgGluc+ (eq 9).
During data evaluation, the pH- and MgCl2-dependent titrations as well as the protonation measurements of Gluc– were fitted simultaneously. Assuming the formation of HGluc, GlucH–12–, MgGluc+, and its two deprotonated forms, MgGluc(OH)0 and MgGluc(OH)2–, the FP was found to be 0.024 (in pHc units).
Further improvement of the FP (0.017) could be achieved by taking the formation of Mg3Gluc2(OH)40 into consideration. Expectedly, the two curves, starting from the alkaline region and with MgCl2 as the titrant, are the most affected ones. That is, the individual FP decreased from 0.034 to 0.021 (Figure S8, red curve) as well as from 0.040 to 0.015 (Figure S8, blue curve). Given that the calcium(II) analogues were detected in the presence of Gluc–,15,16 the presence of such a trinuclear magnesium(II) complex seems to be realistic.
In conclusion, the proposed chemical model for the Mg2+/Gluc–/OH–/H+ system consists of HGluc, GlucH–12–, MgGluc+, MgGlucOH0, MgGluc(OH)2–, and Mg3Gluc2(OH)40. The calculated potentials are depicted in Figures S8–S10, while the respective stability products are listed in Table 1. To the best of our knowledge, the deprotonation constant of HGluc (at I = 4 M NaCl) is the only one to date. Regarding GlucH–12–, the reliability of its stability constant (−13.92) is justified by the excellent agreement with that (−13.90) determined previously via 13C NMR at the same ionic strength.16 As for MgGluc+, log β110 = 0.33 agrees well with that proposed from the NMR results (0.4 ± 0.2).
Comparing the stability products of the calcium(II) and magnesium(II) analogues (i.e., the 1:1:1 and 3:2:4 species), it is evident that more stable complexes are formed with Mg2+. This striking difference can be explained by the fact that Mg2+ ions undergo hydrolysis more readily. In fact, the stability of MgOH+ is higher by roughly 1.5 orders of magnitude than that of CaOH+.47,48 Similarly, the solubility product of Mg(OH)2(s) is smaller by more than 6 orders of magnitude than that of Ca(OH)2(s).48,49
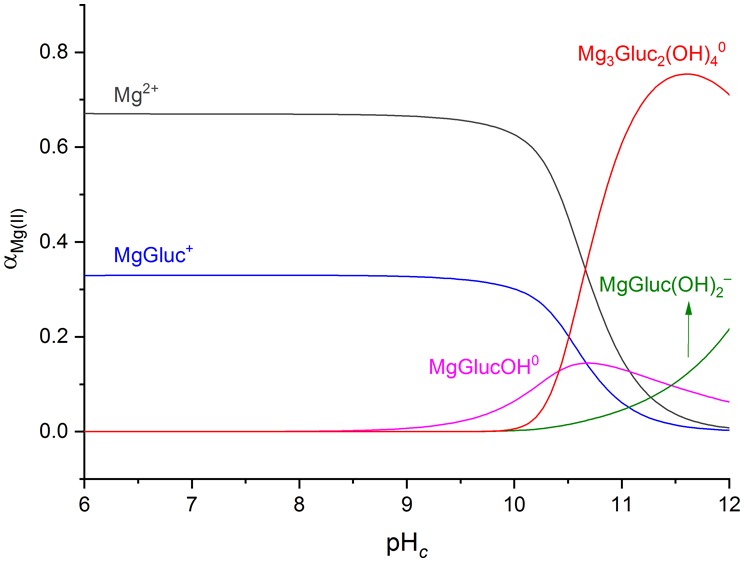
Figure 4 shows the concentration distribution diagram of magnesium(II) for the most concentrated solution used in our studies ([Gluc–]T = 0.2 M and [Mg2+]T = 0.1 M). It is seen that the Mg3Gluc2(OH)40 species is the predominant one in the pHc range of 10.5–12.0. As for the stoichiometry of Mg3Gluc2(OH)40, it shows a pronounced similarity with both the Mg3(OH)42+ and Mg4(OH)44+ polynuclear species that were invoked in previous studies.47,66,67 These complexes, however, were not accepted in a later critical review68 because their formation coincides with the onset of the precipitation of Mg(OH)2(s). Nevertheless, the formation of Mg3Gluc2(OH)40 can be indirect evidence of the existence of these hydroxido complexes because they might be stabilized by Gluc– through the following reactions:
Figure 4.

Speciation diagram with respect to magnesium(II) as a function of pHc. The calculations were based on equilibrium constants corresponding to T = 25 °C and I = 4 M (NaCl). Total concentrations: [Mg2+]T = 0.100 M and [Gluc–]T = 0.200 M.
| 10 |
| 11 |
Effect of MgCl2 on the Solubility of Thorium(IV)
The impact of MgCl2 on the solubility of Th(OH)4(s) in the presence of Gluc– was assessed via calculation of the solubility curve of thorium(IV) using the solubility and stability products listed in Tables 1 and S1. The pHc ranged from 7 to 10, [Gluc–]T was set to 10–5 to 10–2 M, and [Mg2+]T was adjusted to 0, 0.1, 0.2, 0.3, 0.5, and 1 M. It has to be mentioned that the last two concentrations are too high compared to that of the background electrolyte; therefore, the ionic interaction coefficients (Table S2) are only approximate. Thus, these calculations are considered to be semiquantitative.
It is known that thorim(IV) has a high affinity to form multinuclear hydroxido complexes. For the formation of these species, however, reasonably high concentrations of thorium(IV) (>10–6 M) and acidic solutions (pH < 5) are prerequisites.29,30,68 Given the pH range of the present simulations, these complexes were neglected. Furthermore, because of the presence of MgCl2, precipitation of Mg(OH)2(s) is expected to occur. The only literature data with respect to 4 M NaCl was obtained by the solubility method at 22.5 °C.49 Although it was later not accepted in Ekberg and Brown’s critical review, it was used here to estimate the onset of precipitation.
Figure 5 shows the solubility curve of thorium(IV) in the absence and presence of 10–5 M NaGluc and the increasing amount of MgCl2. At [MgCl2]T = 0 M and pHc < 9, log([ThIV]T/cø) increases by 0.1–0.2 units because of the ThGluc(OH)4– complex.5,6,17 The increase is significantly higher at pHc = 10, where the ThGluc(OH)52– (or the ThGlucH–1(OH)42–) complex5,17 is formed to a significant extent.
Figure 5.

Solubility of thorium(IV) hydroxide as a function of pHc. The calculations were based on equilibrium constants corresponding to T = 25 °C and I = 4 M (NaCl). Total concentrations: [Gluc–]T = 0 M (black line) and 0.00001 M (colored lines). [Mg2+]T: listed in the legend. In the pH ranges depicted with dashed lines, Mg(OH)2(s) is expected to precipitate.
Increasing [MgCl2]T lowers the solubility of thorium(IV) dramatically because of the formation of magnesium(II) gluconate complexes proposed in this work (Table 1). That is, at high concentrations of MgCl2, their formation partially suppresses that of the thorium(IV) gluconate species. The direction of this variation would be the opposite if a ternary complex such as CaThGluc2(OH)40 was also formed with Mg2+. This kind of species, however, was not reported so far.
At higher concentrations of gluconate (Figures 6 and S11 and S12), however, the decrease of the solubility becomes less pronounced, which stems from the extremely high stability of both the ThGluc(OH)4– and ThGluc(OH)52– species. For instance, at pHc = 7, log([ThIV]T/cø) is −8.3 at [Gluc–]T = 0 M, while it increases to −6.3 at [Gluc–]T = 0.01 M (Figure 6). Upon the addition of 1 M MgCl2, this value decreases only to −6.8. In conclusion, the formation of thorium(IV) gluconate complexes cannot be completely suppressed even at high [Mg2+]T/[Gluc–]T ratios. On the other hand, the effect of the Mg2+ ions might be expected to be more significant under the conditions of radioactive waste disposals, with [MgCl2]T being as high as 4 M.3
Figure 6.

Solubility of thorium(IV) hydroxide as a function of pHc. The calculations were based on equilibrium constants corresponding to T = 25 °C and I = 4 M (NaCl). Total concentrations: [Gluc–]T = 0 M (black line) and 0.01 M (colored lines). [Mg2+]T: listed in the legend. In the pH ranges depicted with dashed lines, Mg(OH)2(s) is expected to precipitate.
As any speciation model, this one should also be justified experimentally via solubility measurements, albeit carrying out such experiments in the alkaline pH range is a difficult endeavor even for the experts of this field. First, solubility equilibria of actinide hydroxides are usually established very slowly (if at all) because of the formation of more soluble amorphous precipitates or amorphous layers on the surface of the thermodynamically stable, crystalline phases.30 Namely, the transformation of such metastable phases to crystalline phases is kinetically hindered. Second, because the concentrations to be detected are extremely low (<10–8–10–7 M), the scattering range of the data is often 1 order of magnitude or higher, even upon application of state-of-the art instrumentation. The predicted effects of MgCl2 are within this uncertainty and, hence, difficult to detect experimentally. Thus, we believe that our calculations serve as a good first estimation for modeling the solubility of thorium(IV) in the presence of NaGluc and MgCl2.
Effect of the pH and Temperature on the NMR Spectra of Gluc– in the Presence of MgCl2
To gain further insights concerning the structures of the complexes formed, a series of NMR spectra were recorded. Figure 7 shows the pH dependence of the 1H spectra of Gluc– in solutions containing [Gluc–]T = 0.2 M and [Mg2+]T = 0.1 M. At pH* = 6, ca. 14% of [Gluc–]T is bound in the MgGluc+ complex. [It has to be noted that only a semiquantitative comparison is possible because the formation constants of the present samples are somewhat different (I < 1 M) from those used for the speciation calculations (I = 4 M).]
Figure 7.

1H NMR spectra of solutions containing [Gluc–]T = 0.200 M and [Mg2+]T = 0.100 M as a function of the nominal pH* at T = 25 ± 1 °C.
At pH* = 6–9, the spectra remain unchanged, while at pH* = 9.5–10, the H2 peak is shifted slightly downfield; furthermore, the H4–H5 signals become more resolved. These minor variations probably result from the formation of MgGlucOH0, which is supported by the speciation diagram (Figure 8): the formation of this species starts at pHc = 9. Interestingly, the shape of the spectra above pH* = 10 returns to those observed at pH* < 9. This is a hint that another complex is formed that suppresses the formation of MgGlucOH0. Indeed, these reverse spectral changes coincide well with the Mg3Gluc2(OH)40 species, which appears at pHc = 10 and becomes the dominant one up to pHc = 12 (Figure 8). In parallel, the amount of free ligand drops to approximately 60%, yet the spectra resemble those of the free ligand (at pH* = 6). This similarity implies that the interactions between Mg2+ and Gluc– are weaker in the trinuclear complex than in MgGlucOH0; hence, Mg3Gluc2(OH)40 might be the ligand-stabilized form of the Mg3(OH)42+ or Mg4(OH)42+ unit.47,66,67
Figure 8.

Speciation diagram with respect to gluconate as a function of pHc. The calculations were based on equilibrium constants corresponding to T = 25 °C and I = 4 M (NaCl). Total concentrations: [Mg2+]T = 0.100 M and [Gluc–]T = 0.200 M.
Above pH* ≈ 13, the H3–H6′ peaks are slightly shifted upfield because of the formation of GlucH–12–. Conversely, the same downfield shift is seen on the H2 signal, indicating that the structures of the MgGlucOH0 and the newly-formed MgGluc(OH)2– species are similar. This conclusion is corroborated by the 13C NMR spectra as well (Figure S13), on which the same trend is seen. Additionally, the C1 signal (Figure S14) exhibits the highest variation: its chemical shift increases by 0.8 ppm at pH* = 10, while it merges to the baseline at pH* = 13. Hence, the COO– group is likely to be bound to Mg2+ in these complexes, similarly to MgGluc+.
On the other hand, it is not obvious where the deprotonation takes place: on an alcoholic OH group of the ligand or on a coordinated water molecule. Although potentiometry is in general not suitable to distinguish between these processes, comparing pK values of the ligand and aqua complexes of a given metal ion might help. In this respect, Van Duin and co-workers proposed a general ionization scheme for the complexation reactions occurring between metal ions and poly(hydroxycarboxylates).69 Accordingly, deprotonation of MGluc+ can be attributed to ionization of the α-hydroxy (C2–OH) group because the respective pK is lower by ≈2 units than that of the first hydrolytic step of the aqua complex (pKh). The same conclusion was drawn by analyzing the formation constants of the gluconate complexes of aluminum(III)70,71 and praseodymium(III),72 respectively. This so-called metal-ion-induced ligand deprotonation is driven by the formation of very stable, five-membered chelate complexes.
The pKh of the Mg2+ aqua ion (i.e., −log β101) was reported to be 12.33.47 For MgGluc+, using log β110 = 0.33, pK1 is 10.53 (i.e., log β110 – log β111), while pK2 is 11.46 (i.e., log β111 – log β112). Given that pK1 < pK2 < pKh, even the second deprotonation of the 1:1 complex can occur on the alcoholic OH groups of Gluc–. Because displacement of an alcoholic proton has already been established for the calcium(II) gluconate complexes,15 comparative NMR measurements were undertaken for the Gluc–, Mg2+/Gluc–, and Ca2+/Gluc– systems. The 1H NMR spectra are displayed in Figure 9, while the 13C NMR spectra are depicted in Figures S15 and S16.
Figure 9.

1H NMR spectra of solutions containing (a) [Gluc–]T = 0.200 M, (b) [Gluc–]T = 0.200 M and [Mg2+]T = 0.100 M, and (c) [Gluc–]T = 0.200 M and [Ca2+]T = 0.100 M as function of the nominal pH* at T = 25 ± 1 °C.
From pH* = 6 to 10, only small spectral variations are discernible for both metal-ion-containing solutions compared to the spectra of free Gluc–. These changes are caused by formation of the mononuclear species, discussed in detail in the previous sections as well as in ref (46). Conversely, the spectrum of the Ca2+/Gluc– system exhibits salient changes at pH* = 12. That is, the 1H peaks are broadened, especially the H2 and H3 ones, indicating their substantial role in the formation of two deprotonated complexes, CaGlucOH0 and Ca3Gluc2(OH)40, which is visualized on the distribution diagram of this system (Figure S17). (To calculate the species distribution, formation constants were obtained from refs (16), (46), and (48).) The dramatic changes seen on the 1H NMR spectra appear on the 13C NMR spectra as well: the peaks of C1–C4 are merged to the baseline, while those of C5 and C6 are widened (Figures S15 and S16).
Such marked changes can be interpreted in terms of metal-ion-induced ligand deprotonation. Namely, the simultaneous coordination of Ca2+ and deprotonation of the OH group(s) lead to the formation of alcoholate binding site(s) and therefore much stronger coordinative bonds than those present in the CaGluc+ species. As a result, the rate of ligand exchange between bound and free Gluc– slows down, becoming commensurate to the NMR relaxation rates. This, in turn, results in an increase of the signal half-widths, especially of those belonging to the coordination sites. Such a spectral feature was detected for the Ca2+/Gluc– system, and the shift from slow to fast complexation dynamics was attested by temperature-dependent measurements.15
Conversely, only marginal changes can be observed for Mg2+ at the same pH*. Given that the concentrations of the magnesium(II) gluconate complexes are higher than those of the calcium(II) complexes (Figure 8 vs Figure S17), this difference is striking. Obviously, there is no sign of metal-ion-promoted deprotonation of Gluc–, indicating that, similarly to MgGluc+, the alcoholic OH groups are not directly bound to the metal ion. The lack of ligand deprotonation is also supported by the temperature-dependent 1H and 13C NMR experiments (Figures S18–S20). At pH* = 10 (at T = 22 °C), where the concentration of MgGlucOH0 is the highest, the characteristic transition between the slow and fast exchange rates is absent. Furthermore, the monotonous shift of the C6 peak position provides no sound evidence of coordination of the C6–OH group, which was proposed in a previous 13C NMR relaxation study.20 A possible reason is that the chemical shift is a less sensitive quantity compared to the relaxation time.
In conclusion, deprotonation in the magnesium(II) gluconate species takes place not on the ligand side but on one of the coordinated water molecules. Still, proton displacement occurs more readily in the MgGluc+ complex (pK1 ≈ 10.5) than in the Mg(H2O)62+ aqua ion (pKh ≈ 12.3).47 Hence, this apparent ligand-promoted hydrolysis of Mg2+ in the 1:1 species probably arises from other structural features that are invisible for NMR spectroscopy.
Role of Hydrogen Bonds in the MgGluc+ and MgGlucOH0 Complexes
The structure of MgGluc+ was optimized by assuming octahedral coordination geometry around Mg2+ and monodentate binding of the COO– group. The optimum geometry is depicted in Figure 10, while the metal–oxygen distances and hydrogen bonds are listed in Table 2.
Figure 10.

Optimized structure of the Mg(H2O)5Gluc+ complex at the M11 level, applying the aug-cc-pVTZ basis set. The solvation effects were taken into account by utilizing the CPCM. Dashed lines indicate the hydrogen-bonding system.
Table 2. Selected Bond Lengths and Hydrogen Bond Distances (in Å) in the Optimized Structures of the Mg(H2O)5Gluc+ and MgGluc(H2O)4(OH)0 Complexesa.
| d(Mg–O) | Db | H | Ab | d(D–H) | d(H···A) | ||
|---|---|---|---|---|---|---|---|
| MgGluc+ | |||||||
| Mg | O1B | 2.044 | O1W | H(O1W) | O1A | 0.995 | 1.687 |
| Mg | O1W | 2.069 | O3W | H(O3W) | O3 | 0.986 | 1.746 |
| Mg | O2W | 2.094 | O3 | H(O3) | O4 | 0.969 | 2.172 |
| Mg | O3W | 2.083 | O2 | H(O2) | O1A | 0.974 | 1.951 |
| Mg | O4W | 2.071 | O4 | H(O4) | O2 | 0.972 | 1.920 |
| Mg | O5W | 2.093 | O6 | H(O6) | O4 | 0.968 | 1.961 |
| MgGlucOH0 | |||||||
| Mg | O1B | 2.081 | O1W | H(O1W) | O1A | 0.994 | 1.694 |
| Mg | OH | 1.967 | O3W | H(O3W) | O3 | 0.982 | 1.765 |
| Mg | O1W | 2.115 | O3 | H(O3) | O4 | 0.969 | 2.192 |
| Mg | O2W | 2.180 | O2 | H(O2) | O1A | 0.974 | 1.939 |
| Mg | O3W | 2.095 | O4 | H(O4) | O2 | 0.973 | 1.902 |
| Mg | O5W | 2.130 | O6 | H(O6) | O4 | 0.968 | 1.956 |
| O2W | H(O2W) | O(OH) | 0.991 | 1.758 | |||
The calculations were performed at the M11/aug-cc-pVTZ level of theory, while solvation effects were considered by applying the CPCM.
D: donor oxygen atom. A: acceptor oxygen atom.
First, it is seen that the Mg–O1B distance (2.04 Å) is lower only by 0.03–0.05 Å than the respective Mg–O1W bond lengths, implying that the Mg2+––OOC and Mg2+–OH2 interactions are of similar strengths. Second, two OH groups of Gluc– interact with the hydrating water molecules; namely, very strong hydrogen bonds are established between O1A and O1W (1.69 Å) as well as O3 and O3W (1.75 Å). (In general, strong hydrogen bonds are considered when d < 2.5 Å.73) Meanwhile, the respective O1W–H and O3W–H covalent bond lengths are more elongated (0.99–1.00 Å) than those for the other water molecules (≈0.96 Å). Interestingly, those structures that are less stable but whose differences in energy are lower than the energy of thermal motion (≈2.5 kJ·mol–1 at 25 °C) exhibit the same coordination motif.
Structure optimization of the MgGlucOH0 species was based on the most stable geometry of MgGluc+ as the input, and the site of deprotonation was varied from O1W to O5W. The lowest-energy complex is shown in Figure 11, and the corresponding bond distances are listed in Table 2.
Figure 11.

Optimized structure of the Mg(H2O)4(OH)Gluc0 complex at the M11 level, applying the aug-cc-pVTZ basis set. The solvation effects were taken into account by utilizing the CPCM. Dashed lines indicate the hydrogen-bonding system.
Deprotonation on the equatorial 4W water molecule results in slight weakening of the Mg–O1B (2.08 Å) and of the Mg–OH2 (2.10–2.18 Å) bonds, while the formation of a hydroxide ion establishes strong interaction with the metal ion (1.97 Å) as well as a hydrogen bond with O2W (1.76 Å). (It is worth mentioning that a complex hydrogen-bonding network is present in MgGluc+ and MgGlucOH0, respectively. Such intramolecular interactions were found in the NaGluc and CaGluc20 solid complexes as well.74,75) More importantly, strong hydrogen bonding is seen between O1A and O1W as well as O3 and O3W, as for MgGluc+.
Concerning the hydrogen bonding in these species, this unique feature at the molecular level can be related to our macroscopic findings. That is, elongation of the water O–H bonds results in the increased acidity of these H2O molecules compared to those in the Mg(H2O)62+ ion. Hence, coordination of Gluc– leads to the “ligand-promoted” hydrolysis of Mg2+, and the order of pK1 < pK2 < pKh can be elucidated qualitatively. Additionally, such hydrogen bonds in metal complexes are difficult to discern by conventional NMR measurements.
Furthermore, the formation of both MgGluc(OH)0 and MgGluc(OH)2– is facilitated by these hydrogen bonds by lowering the pK value of the ligand. Consequently, Gluc– is able to keep Mg2+ ions in solution without precipitation. To prove this effect, two samples were prepared with [Mg2+]T = 0.08 M, [OH–]T = 0.006 M, and [L–]T = 0.17 M, where L– is gluconate or acetate (Ac–). For comparison, Ac– was chosen because it has no OH groups, and the stability of MgAc+ 18,50 is similar to that of MgGluc+. For Gluc–, the formation of Mg(OH)2(s) was not observed. Conversely, the precipitate was detected right after the addition of NaOH in the case of Ac–. Because hydrogen bonding between COO– and H2O is also possible in the MgAc+ species, the different behavior of Gluc– highlights the importance of ligand OH groups in the stabilization of Mg2+.
Conclusions
The complex formation between Mg2+ and Gluc– was studied in neutral-to-alkaline aqueous solutions at 25 °C and 4 M ionic strength. The formation of the MgGluc+ complex was observed and quantitatively described via 1H and 13C NMR spectroscopic measurements. It was proven by additional IR measurements and quantum-chemical computations that the preferred coordination mode is a pseudobridged monodentate, where one oxygen atom of COO– is bound to the metal ion, while the other is in hydrogen-bonding interaction with an adjacent OH group.
Further potentiometric titrations revealed the formation of stable, deprotonated complexes, namely, the MgGlucOH0, MgGluc(OH)2–, and Mg3Gluc2(OH)40 species; the calcium(II) analogue of the latter was reported earlier. Furthermore, the presence of such a trinuclear complex may be indirect proof for the existence of multinuclear hydroxido complexes of magnesium(II) proposed in the literature.
Because concentrated MgCl2 salt brines might contact with underground radioactive waste disposals, the effect of Mg2+ ions on the solubility of actinides is a key factor in the long-term stability assessment of these repositories. Using the stability products obtained in the present work, we calculated the solubility curve of thorium(IV) as a function of pHc by varying the concentrations of Gluc– and MgCl2. It was found that, with an increase in the concentration of MgCl2, the solubility of thorium(IV) decreases, which stems from binary complexes forming between the Mg2+ and Gluc– ions. These processes can effectively suppress complexation between Th(OH)4(s) and Gluc– at low ligand concentrations.
Additional pH-dependent 1H and 13C NMR experiments showed that deprotonation does not significantly affect the spectrum of Gluc–. Comparing these spectra with those of the Ca2+/Gluc– system revealed that, for the magnesium(II) complexes, deprotonation takes place on the coordinated water molecules rather than on the OH groups of the ligand. The main reason for the difference between the two metal complexes is that, in contrast to Ca2+, the OH groups are not directly attached to Mg2+.
On the basis of the titration data, hydrolysis of Mg2+ is facilitated by the coordination of Gluc–; this phenomenon can be interpreted on the basis of molecular structures of the MgGluc+ and MgGlucOH0 complexes. DFT calculations showed that, in parallel to ligand binding, two strong hydrogen bonds are established between the COO– and C3–OH groups of Gluc– and two metal-bound water molecules, leading to increased acidity of these O–H bonds. Macroscopically, this yields lower pK values for the complexes compared to the aqua ion.
In conclusion, ligand-promoted metal-ion hydrolysis appears to be the result of strong hydrogen bonding between the ligand and hydrating water molecules, while the direct binding of ligand OH groups gives rise to metal-ion-induced ligand deprotonation.
Acknowledgments
The authors are thankful to Dr. Gábor Varga and Ákos Buckó for their help in recording the IR and NMR spectra as well as to Shuai Fu for contributing to the preparation of the graphic content of this Article. Financial support of the New National Excellence Programme (Project UNKP-17-3-IV-SZTE-9) and Grants GINOP-2.3.2-15-2016-00013 and NKFIA K 124265 is highly appreciated.
Supporting Information Available
The Supporting Information is available free of charge on the ACS Publications website at DOI: 10.1021/acs.inorgchem.9b00289.
Detailed description about conversion of the stability/solubility products of the ThpGlucq(OH)r(4p–q–r)+ species applying the SIT model, tables listing the converted equilibrium constants and ion interaction parameters, graphical representation of the electrode calibration curves and fitted titration data, optimized structures for the MgGluc+ complex with varying coordination modes, additional speciation diagrams for the Mg2+/Gluc– and Ca2+/Gluc– systems, additional solubility curves of thorium(IV), pH-dependent 13C NMR, and temperature-dependent 1H and 13C NMR spectra (PDF)
The authors declare no competing financial interest.
Supplementary Material
References
- Glasser F. P.; Atkins M. Cements in Radioactive Waste Disposal. MRS Bull. 1994, 19, 33–38. 10.1557/S0883769400048673. [DOI] [Google Scholar]
- Berner U. R. Evolution of Pore Water Chemistry During Degradation of Cement in a Radioactive Waste Repository Environment. Waste Manage. 1992, 12, 201–219. 10.1016/0956-053X(92)90049-O. [DOI] [Google Scholar]
- Bube C.; Metz V.; Bohnert E.; Garbev K.; Schild D.; Kienzler B. Long-Term Cement Corrosion in Chloride-Rich Solutions Relevant to Radioactive Waste Disposal in Rock Salt – Leaching Experiments and Thermodynamic Simulations. Phys. Chem. Earth. 2013, 64, 87–94. 10.1016/j.pce.2012.11.001. [DOI] [Google Scholar]
- Ramachandran S.; Fontanille P.; Pandey A.; Larroche C. Gluconic Acid: Properties, Applications and Microbial Production. Food Technol. Biotechnol. 2006, 44, 185–195. [Google Scholar]
- Felmy A. R.Chemical Speciation of Americium, Curium and Selected Tetravalent Actinides in High Level Waste. Pacific Northwest National Laboratory Report EMSP-73749; Pacific Northwest National Laboratory: Richland, WA, 2012.
- Colàs E.; Grivé M.; Rojo I.; Duro L. Solubility of ThO2•xH2O(am) in the Presence of Gluconate. Radiochim. Acta 2011, 99, 269–273. 10.1524/ract.2011.1837. [DOI] [Google Scholar]
- Warwick P.; Evans N.; Hall T.; Vines S. Stability Constants of Uranium(IV)-α-IsosaccharinicAcid and Gluconic Acid Complexes. Radiochim. Acta 2004, 92, 897–902. 10.1524/ract.92.12.897.55106. [DOI] [Google Scholar]
- Sawyer D. T.; Kula R. J. Uranium(VI) Gluconate Complexes. Inorg. Chem. 1962, 1, 303–309. 10.1021/ic50002a021. [DOI] [Google Scholar]
- Colàs E.; Grivé M.; Rojo I. Complexation of Uranium(VI) by Gluconate in Alkaline Solutions. J. Solution Chem. 2013, 42, 1545–1557. 10.1007/s10953-013-0048-0. [DOI] [Google Scholar]
- Rojo H.; Tits J.; Gaona X.; Garcia-Gutiérrez M.; Missana T.; Wieland E. Thermodynamics of Np(IV) Complexes with Gluconic Acid Under Alkaline Conditions: Sorption Studies. Radiochim. Acta 2013, 101, 133–138. 10.1524/ract.2013.2022. [DOI] [Google Scholar]
- Cross J. E.; Ewart F. T.; Greenfield B. F. Modelling the Behaviour of Organic Degradation Products. MRS Online Proc. Libr. 1988, 127, 715–722. 10.1557/PROC-127-715. [DOI] [Google Scholar]
- Moreton A. D. Thermodynamic Modeling of the Effect of Hydroxycarboxylic Acids on the Solubility of Plutonium at High pH. MRS Online Proc. Libr. 1992, 294, 753–758. 10.1557/PROC-294-753. [DOI] [Google Scholar]
- Tits J.; Wieland E.; Bradbury M. H. The Effect of Isosaccharinic Acid and Gluconic Acid on the Retention of Eu(III), Am(III) and Th(IV) by Calcite. Appl. Geochem. 2005, 20, 2082–2096. 10.1016/j.apgeochem.2005.07.004. [DOI] [Google Scholar]
- Coccioli F.; Vicedomini M. On the Dissociation of Gluconate Ions and Their Complex Formation with Lead(II) in Alkaline Solution. J. Inorg. Nucl. Chem. 1978, 40, 2106–2110. 10.1016/0022-1902(78)80216-4. [DOI] [Google Scholar]
- Pallagi A.; Bajnóczi É. G.; Canton S. E.; Bolin T.; Peintler G.; Kutus B.; Kele Z.; Pálinkó I.; Sipos P. Multinuclear Complex Formation between Ca(II) and Gluconate Ions in Hyperalkaline Solutions. Environ. Sci. Technol. 2014, 48, 6604–6611. 10.1021/es501067w. [DOI] [PubMed] [Google Scholar]
- Buckó Á.; Kutus B.; Peintler G.; Pálinkó I.; Sipos P. Temperature Dependence of the Acid-Base and Ca2+-Complexation Equilibria of D-gluconate in HyperalkalineAqueous Solutions. Polyhedron 2019, 158, 117–124. 10.1016/j.poly.2018.10.034. [DOI] [Google Scholar]
- Gaona X.; Montoya V.; Colàs E.; Grivé M.; Duro L. Review of the Complexation of Tetravalent Actinides by ISA and Gluconate UnderAlkaline to HyperalkalineConditions. J. Contam. Hydrol. 2008, 102, 217–227. 10.1016/j.jconhyd.2008.09.017. [DOI] [PubMed] [Google Scholar]
- Cannan R. K.; Kibrick A. Complex Formation Between Carboxylic Acids and Divalent Metal Cations. J. Am. Chem. Soc. 1938, 60, 2314–2320. 10.1021/ja01277a012. [DOI] [Google Scholar]
- Carper W. R.; Coffin D. B.; Addis J. R. Studies of Magnesium and Manganese Interactions with Gluconate and 1,5-Gluconolactone. Spectrochim. Acta 1989, 45A, 391–392. 10.1016/0584-8539(89)80106-0. [DOI] [Google Scholar]
- Bailey G. D.; Carper W. R. 13C Relaxation Studies of Gluconate and Magnesium-Gluconate Interactions. J. Inorg. Biochem. 1993, 52, 99–108. 10.1016/0162-0134(93)85026-5. [DOI] [Google Scholar]
- Coffin D. B.; Carper W. R. Carbon-13 NMR Relaxation Studies of Gluconate and Manganese-Gluconate Interactions. Magn. Reson. Chem. 1988, 26, 591–594. 10.1002/mrc.1260260711. [DOI] [Google Scholar]
- Carper W. R.; Coffin D. B. NMR Studies of Paramagnetic Metal Ion Interactions with Gluconate and 1,5-Gluconolactone. Inorg. Chim. Acta 1990, 167, 261–264. 10.1016/S0020-1693(00)80507-1. [DOI] [Google Scholar]
- Horton D.; Wałaszek Z.; Ekiel I. Conformations of D-Gluconic, D-Mannonic, and D-Galactonic Acids in Solution, as Determined by N.M.R. Spectroscopy. Carbohydr. Res. 1983, 119, 263–268. 10.1016/0008-6215(83)84063-4. [DOI] [Google Scholar]
- Sipos P.; May P. M.; Hefter G. T. Carbonate Removal from Concentrated Hydroxide Solutions. Analyst 2000, 125, 955–958. 10.1039/a910335j. [DOI] [Google Scholar]
- Peintler G.; Kormányos B.; Gyurcsik B.. pHCali, version 1.32a-20070323; University of Szeged, Szeged, Hungary, 2007.
- Crea F.; Stefano C.; Gianguzza A.; Piazzese D.; Sammartano S. Protonation of Carbonate in Aqueous Tetraalkylammonium Salts at 25°C. Talanta 2006, 68, 1102–1112. 10.1016/j.talanta.2005.07.025. [DOI] [PubMed] [Google Scholar]
- Zékány L.; Nagypál I.; Peintler G.. PSEQUAD for Chemical Equilibria, update 5-5.10; Sprinker: Budapest, Hungary, 2000. –2008.
- Puigdomenech I.MEDUSA, version 1; KTH Royal Institute of Technology: Stockholm, Sweden, 2015.
- Rand M.; Fuger J.; Grenthe I.; Neck V.; Rai D.. Chemical Thermodynamics of Thorium. In Chemical Thermodynamics.; Mompean F. J., Perrone J., Illemassène M., Eds.; OECD Publications: Paris, France, 2011; Vol. 11. [Google Scholar]
- Neck V.; Kim J. I. Solubility and Hydrolysis of Tetravalent Actinides. Radiochim. Acta 2001, 89, 1–16. 10.1524/ract.2001.89.1.001. [DOI] [Google Scholar]
- Brønsted J. N. Studies of Solubility: IV. The Principle of Specific Interaction of Ions. J. Am. Chem. Soc. 1922, 44, 877–898. 10.1021/ja01426a001. [DOI] [Google Scholar]
- Brønsted J. N. Calculation of the Osmotic and Activity Functions in Solutions of Uni-Univalent salts. J. Am. Chem. Soc. 1922, 44, 938–948. 10.1021/ja01426a003. [DOI] [Google Scholar]
- Scatchard G. Concentrated Solutions of Strong Electrolytes. Chem. Rev. 1936, 19, 309–327. 10.1021/cr60064a008. [DOI] [Google Scholar]
- Guggenheim E. A.Applications of Statistical Mechanics; Clarendon Press: Oxford, U.K., 1966. [Google Scholar]
- Pitzer K. S.Activity Coefficients in Electrolyte Solutions, 2nd ed.; CRC Press: Boca Raton, FL, 1991. [Google Scholar]
- Bretti C.; Foti C.; Sammartano S. Calculation of SIT Parameters. Part I. A New Approach in the Use of SIT in Determining the Dependence on Ionic Strength of Activity Coefficients. Application to Some Chloride Salts of Interest in the Speciation of Natural Fluids. Chem. Speciation Bioavailability 2004, 16, 105–110. 10.3184/095422904782775036. [DOI] [Google Scholar]
- Jiménez-Reyes M.; Solache-Ríos M.; Rojas-Hernández A. Application of the Specific Ion Interaction Theory to the Solubility Product and First Hydrolysis Constant of Europium. J. Solution Chem. 2006, 35, 201–214. 10.1007/s10953-006-9363-z. [DOI] [Google Scholar]
- Sipos P. Application of the Specific Ion Interaction Theory (SIT) for the Ionic Products of Aqueous Electrolyte Solutions of Very High Concentrations. J. Mol. Liq. 2008, 143, 13–16. 10.1016/j.molliq.2008.04.003. [DOI] [Google Scholar]
- Fellhauer D.; Altmaier M.; Gaona X.; Lützenkirchen J.; Fanghänel T. Np(V) Solubility, Speciation and Solid Phase Formation in Alkaline CaCl2 Solutions. Part II: Thermodynamics and Implications for Source Term Estimations of Nuclear Waste Disposal. Radiochim. Acta 2016, 104, 381–397. 10.1515/ract-2015-2490. [DOI] [Google Scholar]
- Yalçıntaş E.; Gaona X.; Altmaier M.; Dardenne K.; Polly R.; Geckeis H. Thermodynamic Description of Tc(IV) Solubility and Hydrolysis in Dilute to Concentrated NaCl, MgCl2 and CaCl2 Solutions. Dalton. Trans. 2016, 45, 8916–8936. 10.1039/C6DT00973E. [DOI] [PubMed] [Google Scholar]
- Altmaier M.; Yalçıntaş E.; Gaona X.; Neck V.; Müller R.; Schlieker M.; Fanghänel T. Solubility of U(VI) in Chloride Solutions. I. The Stable Oxides/Hydroxides in NaCl Systems, Solubility Products, Hydrolysis Constants and SIT Coefficients. J. Chem. Thermodyn. 2017, 114, 2–13. 10.1016/j.jct.2017.05.039. [DOI] [Google Scholar]
- Ciavatta L. The Specific Interaction Theory in Evaluating Ionic Equilibria. Ann. Chim. (Rome). 1980, 70, 551–567. [Google Scholar]
- Peverati R.; Truhlar D. G. Improving the Accuracy of Hybrid Meta-GGA Density Functionals by Range Separation. J. Phys. Chem. Lett. 2011, 2, 2810–2817. 10.1021/jz201170d. [DOI] [Google Scholar]
- Cossi M.; Rega N.; Scalmani G.; Barone V. Energies, Structures and Electronic Properties of Molecules in Solution with the C-PCM Solvation Model. J. Comput. Chem. 2003, 24, 669–681. 10.1002/jcc.10189. [DOI] [PubMed] [Google Scholar]
- Gaussian09, revision E.01; Gaussian, Inc.: Wallingford, CT, 2013.
- Pallagi A.; Sebók P.; Forgó P.; Jakusch T.; Pálinkó I.; Sipos P. Multinuclear NMR and Molecular Modelling Investigations on the Structure and Equilibria of Complexes That Form in Aqueous Solutions of Ca2+ and Gluconate. Carbohydr. Res. 2010, 345, 1856–1864. 10.1016/j.carres.2010.05.009. [DOI] [PubMed] [Google Scholar]
- Lewis D.; Lund A.; Vänngård T.; Håkansson R.; Munch-Petersen J. Studies on the Hydrolysis of Metal Ions. The Hydrolysis of Magnesium in Chloride Self-Medium. Acta Chem. Scand. 1963, 17, 1891–1901. 10.3891/acta.chem.scand.17-1891. [DOI] [Google Scholar]
- Kutus B.; Gácsi A.; Pallagi A.; Pálinkó I.; Peintler G.; Sipos P. A Comprehensive Study on the Dominant Formation of the Dissolved Ca(OH)2(aq) in Strongly Alkaline Solutions Saturated by Ca(II). RSC Adv. 2016, 6, 45231–45240. 10.1039/C6RA05337H. [DOI] [Google Scholar]
- Xiong Y. Thermodynamic Properties of Brucite Determined by Solubility Studies and Their Significance to Nuclear Waste Isolation. Aquat. Geochem. 2008, 14, 223–238. 10.1007/s10498-008-9034-3. [DOI] [Google Scholar]
- Martell A.; Smith R. M.. Other Organic Ligands. In Critical Stability Constants; Martell A.. Ed.; Springer: New York, 1977; Vol. 3. [Google Scholar]
- Portanova R.; Lajunen L. H. J.; Tolazzi M.; Piispanen J. Critical Evaluation of Stability Constants for α-Hydroxycarboxylic Acid Complexes with Protons and Metal Ions and the Accompanying Enthalpy Changes. Part II. Aliphatic 2-Hydroxycarboxylic Acids. IUPAC Techical Report. Pure Appl. Chem. 2003, 75, 495–540. 10.1351/pac200375040495. [DOI] [Google Scholar]
- Smirnov P. R.; Trostin V. N. Structural Parameters of Hydration of Be2+ and Mg2+ Ions in Aqueous Solutions of Their Salts. Russ. J. Gen. Chem. 2008, 78, 1643–1649. 10.1134/S1070363208090016. [DOI] [Google Scholar]
- Di Tommaso D.; De Leeuw N. H. Structure and Dynamics of the Hydrated Magnesium Ion and of the Solvated Magnesium Carbonates: Insights from First Principles Simulations. Phys. Chem. Chem. Phys. 2010, 12, 894–901. 10.1039/B915329B. [DOI] [PubMed] [Google Scholar]
- Bai G.; Yi H.-B.; Li H.-J.; Xu J.-J. Hydration Characteristics of Ca2+ and Mg2+: A Density Functional Theory, Polarized Continuum Model and Molecular Dynamics Investigation. Mol. Phys. 2013, 111, 553–568. 10.1080/00268976.2012.737035. [DOI] [Google Scholar]
- Van Panthaleon van Eck C. L.; Mendel H.; Boog W. X-Ray Diffraction of Aqueous Electrolyte Solutions. Discuss. Faraday Soc. 1957, 24, 200–205. 10.1039/df9572400200. [DOI] [Google Scholar]
- Probst M. M.; Radnai T.; Heinzinger K.; Bopp P.; Rode B. M. Molecular Dynamics and X-Ray Investigation of an Aqueous Calcium Chloride Solution. J. Phys. Chem. 1985, 89, 753–759. 10.1021/j100251a007. [DOI] [Google Scholar]
- Fulton J. L.; Heald M. S.; Badyal Y. S.; Simonson J. M. Understanding the Effects of Concentration on the Solvation Structure of Ca2+ in Aqueous Solution. I: The Perspective on Local Structure from EXAFS and XANES. J. Phys. Chem. A 2003, 107, 4688–4696. 10.1021/jp0272264. [DOI] [Google Scholar]
- Megyes T.; Grosz T.; Radnai T.; Bako I.; Palinkas G. Solvation of Calcium Ion in Polar Solvents: An X-ray Diffraction and Ab Initio Study. J. Phys. Chem. A 2004, 108, 7261–7271. 10.1021/jp048838m. [DOI] [Google Scholar]
- Rudolph W. W.; Irmer G. Hydration of the Calcium(II) Ion in an Aqueous Solution of Common Anions (ClO4–, Cl–, Br–, and NO3–). Dalton Trans. 2013, 42, 3919–3935. 10.1039/c2dt31718d. [DOI] [PubMed] [Google Scholar]
- Rodriguez-Cruz S. E.; Jockusch R. A.; Williams E. R. Hydration Energies and Structures of Alkaline Earth Metal Ions, M2+ (H2O)n, n = 5–7, M = Mg, Ca, Sr, and Ba. J. Am. Chem. Soc. 1999, 121, 8898–8906. 10.1021/ja9911871. [DOI] [PMC free article] [PubMed] [Google Scholar]
- Nickolov Zh.; Georgiev G.; Stoilova D.; Ivanov I. Raman and IR Study of Cobalt Acetate Dihydrate. J. Mol. Struct. 1995, 354, 119–125. 10.1016/0022-2860(95)08877-X. [DOI] [Google Scholar]
- Binitha M. P. Studies on Growth and Properties of Some Metal Succinate Crystals. Ph.D. Thesis, University of Calicut, Calicut, India, 2014; p 61. [Google Scholar]
- Tajmir-Riahi H. A. Carbohydrate Complexes with Alkaline Earth Metal Ions. Interaction of D-Glucono-1,5-Lactone with the Mg(II), Ca(II), Sr(II), and Ba(II) Cations in the Crystalline Solid and Aqueous Solution. J. Inorg. Biochem. 1990, 39, 33–41. 10.1016/0162-0134(90)80013-N. [DOI] [PubMed] [Google Scholar]
- Deacon G. B.; Phillips R. J. Relationships Between the Carbon-Oxygen Stretching Frequencies of Carboxylato Complexes and the Type of Carboxylate Coordination. Coord. Chem. Rev. 1980, 33, 227–250. 10.1016/S0010-8545(00)80455-5. [DOI] [Google Scholar]
- Papageorgiou S. K.; Kouvelos E. P.; Favvas E. P.; Sapalidis A. A.; Romanos G. E.; Katsaros F. K. Metal–Carboxylate Interactions in Metal–Alginate Complexes Studied with FTIR Spectroscopy. Carbohydr. Res. 2010, 345, 469–473. 10.1016/j.carres.2009.12.010. [DOI] [PubMed] [Google Scholar]
- Einaga H. Hydrolysis of Magnesium(II) in 1.0 moldm–3 Aqueous (Na,H)NO3 Solution. J. Chem. Soc., Dalton Trans. 1977, 912–914. 10.1039/DT9770000912. [DOI] [Google Scholar]
- Burkov K. A.; Bus’ko E. A.; Garmash L. A.; Khonin G. V. Hydrolysis of Magnesium Perchlorate at 25–140 °C. Zh. Neorg. Khim. 1978, 23, 1767–1772. [Google Scholar]
- Ekberg C.; Brown P. L.. Hydrolysis of Metal Ions.; Wiley-VCH, Weinheim, Germany, 2016. [Google Scholar]
- Van Duin M.; Peters J. A.; Kieboom A. P. G.; Van Bekkum H. A General Coordination-Ionization Scheme for Polyhydroxy Carboxylic Acids in Water. Recl. Trav. Chim. Pays-Bas. 1989, 108, 57–60. 10.1002/recl.19891080204. [DOI] [Google Scholar]
- Motekaitis R. J.; Martell A. E. Complexes of Aluminum(II1) with Hydroxy Carboxylic Acids. Inorg. Chem. 1984, 23, 18–23. 10.1021/ic00169a006. [DOI] [Google Scholar]
- Lakatos A.; Kiss T.; Bertani R.; Venzo A.; Di Marco V. B. Complexes of Al(III) with D-Gluconic Acid. Polyhedron 2008, 27, 118–124. 10.1016/j.poly.2007.08.035. [DOI] [Google Scholar]
- Giroux S.; Rubini P.; Henry B.; Aury S. Complexes of Praseodymium(III) with D-Gluconic Acid. Polyhedron 2000, 19, 1567–1574. 10.1016/S0277-5387(00)00422-8. [DOI] [Google Scholar]
- Jeffrey J. A.An Introduction to Hydrogen Bonding.; Oxford University Press: New York, 1997. [Google Scholar]
- Di Y.-Y.; Zhang Y.-H.; Liu Y.-P.; Kong Y.-X.; Zhou C.-S. Crystal Structure and Thermodynamic Properties of Sodium D-Gluconate Na[D-C6H11O7](s). J. Therm. Anal. Calorim. 2017, 127, 1835–1843. 10.1007/s10973-016-6033-2. [DOI] [Google Scholar]
- Bugris V.; Dudás Cs.; Kutus B.; Harmat V.; Csankó K.; Brockhauser S.; Pálinkó I.; Turner P.; Sipos P. Crystal and Solution Structures of Calcium Complexes Relevant to Problematic Waste Disposal: Calcium Gluconate and Calcium Isosaccharinate. Acta Crystallogr., Sect. B: Struct. Sci., Cryst. Eng. Mater. 2018, 74, 598–609. 10.1107/S2052520618013720. [DOI] [Google Scholar]
Associated Data
This section collects any data citations, data availability statements, or supplementary materials included in this article.