Abstract
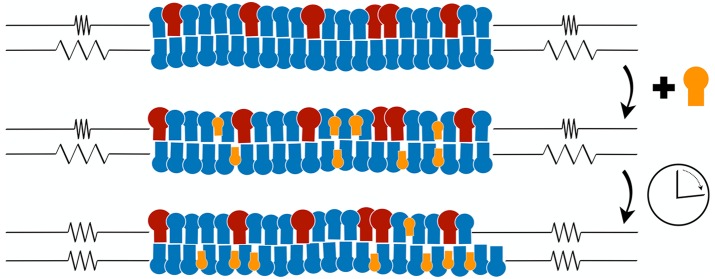
Biomembranes are built up from lipid bilayers with two leaflets that typically differ in their lipid composition. Each lipid molecule stays within one leaflet of the bilayer before it undergoes a transition, or flip-flop, to the other leaflet. The corresponding flip-flop times are very different for different lipid species and vary over several orders of magnitude. Here, we use molecular dynamics simulations to elucidate the consequences of this separation of time scales for compositionally asymmetric bilayers. We first study bilayers with two lipid components that do not undergo flip-flops on the accessible time scales. In such a situation, one must distinguish a bilayer state in which both leaflets have the same preferred area from another state in which each leaflet is tensionless. However, when we add a third lipid component that undergoes frequent flip-flops, the bilayer relaxes toward the state with tensionless leaflets, not to the state with equal preferred leaflet areas. Furthermore, we show that bilayers with compositional asymmetry acquire a significant spontaneous curvature even if both leaflets are tensionless. Our results can be extended to lipid bilayers with a large number of lipid components provided at least one of these components undergoes frequent flip-flops. For cellular membranes containing lipid pumps, the leaflet tensions also depend on the rates of protein-induced flip-flops.
Keywords: Bilayer membrane, preferred area, preferred tension, bilayer asymmetry, GM1, cholesterol
Biological membranes are assembled from a complex assortment of lipids and membrane proteins. The lipids form asymmetric bilayers, displaying different lipid compositions in their two leaflets.1−4 Each lipid molecule stays within one leaflet until it undergoes a transition or flip-flop, also known as transbilayer motion, to the other leaflet. In the absence of membrane proteins that act as lipid pumps, the flip-flops represent a thermally activated process with flip-flop times that vary from hours or even days for phospholipids5−7 to seconds8,9 or even milliseconds10 for cholesterol and other sterols. In cellular membranes, lipid flip-flops are also induced by proteins, some of which act as lipid pumps.4,11−13
The bilayer asymmetry affects many membrane properties and in particular the membranes’ morphology. However, the complexity of any biological membrane, which typically contains hundreds of lipid species and numerous integral and peripheral membrane proteins, makes it difficult to unravel the underlying molecular mechanisms. On the other hand, giant unilamellar vesicles (GUVs) have emerged as useful model systems for biomembranes.14 When the two leaflets of a GUV membrane have the same lipid composition, the membrane behavior is primarily governed by a single elastic parameter, the bending rigidity. When the GUV membrane possesses some bilayer asymmetry,15−19 the broken symmetry between the two leaflets is described by another elastic parameter, the preferred or spontaneous curvature of the membrane.
The bending rigidity and the spontaneous curvature determine the curvature elasticity of the GUV membanes. The corresponding curvature models come in several variants20,21 that lead to the same stationary shapes but differ in the corresponding free energy landscapes. The different variants also differ in their assumptions about the frequency of lipid flip-flops.
The spontaneous curvature (SC) model20,22 describes bilayer asymmetry fully through the local spontaneous curvature m that arises from the underlying molecular interactions. In the model, the area difference between the two leaflets is not explicitly considered and is thus free to change, which requires at least one membrane component to undergo frequent flip-flops between the two leaflets.23 In contrast, the bilayer couple (BC) model,20,24 which is based on the bilayer couple hypothesis,25 assumes that the number of molecules is conserved within each leaflet, and describes shape transformations of GUVs with a fixed area difference between the leaflets.
The SC and the BC models represent two limiting cases of the area-difference elasticity (ADE) model,21 which represents an extension of the chemically induced moments model of ref (26). In the ADE model, the number of molecules is conserved within each leaflet, as in the BC model, but the area difference between the leaflets is allowed to change via expansion and compression of the individual leaflets. The ADE model can be mapped onto the SC model by introducing a nonlocal, shape-dependent contribution to the spontaneous curvature.27
On the nanometer scale, bilayer asymmetry and spontaneous curvature can be studied by molecular simulations.18,28−31 In the latter studies, the number of lipid molecules were constant within each leaflet, because the molecules did not undergo flip-flops on the time scales accessible to the simulations. A spontaneous curvature can then arise from different lipid densities29,30 or different lipid compositions18,31 of the two leaflets. To calculate the spontaneous curvature, one has to simulate tensionless membranes32 for which the integral over the local stress profile vanishes. The latter constraint can be fulfilled without requiring vanishing tensions within the individual leaflets.
As a specific example, we consider two-component membranes consisting of the phospholipid POPC and the glycolipid (or ganglioside) GM1. For the latter, we use two different molecular models: cone-like GM1 and lollipop-like GM1. We first study symmetric bilayers and show that the two types of GM1 differ in their preferred molecular areas. We then consider asymmetric bilayers and determine the tensions within the individual leaflets. We identify two states of asymmetric bilayers, I and II, that differ in their lipid composition and have specific mechanical properties. For state I, the two leaflets of the bilayer have the same preferred area and, in general, nonzero leaflet tensions of opposite sign. For state II, on the other hand, both leaflet tensions vanish separately. Most importantly, we show that a bilayer approaches state II when we add another molecular component that undergoes frequent flip-flops between the two leaflets and that bilayers in state II can display a considerable spontaneous curvature.
Results and Discussion
Because all simulations presented here are done in the NPT-ensemble, the total bilayer tension is naturally kept zero in all the systems discussed below.
Leaflet Areas of Symmetric Bilayers
Let us start by looking at compositionally symmetric POPC–GM1 bilayers, for which the leaflet tensions are equal by symmetry and in fact zero because the whole bilayer is tensionless.
Figure 1 demonstrates that the shape of a GM1 lipid depends on the force field parametrization used, resulting either in a cone-like GM1 wedged deep into its leaflet18,33 or a lollipop-like GM1 with its headgroup residing mostly above the POPCs.34
Figure 1.
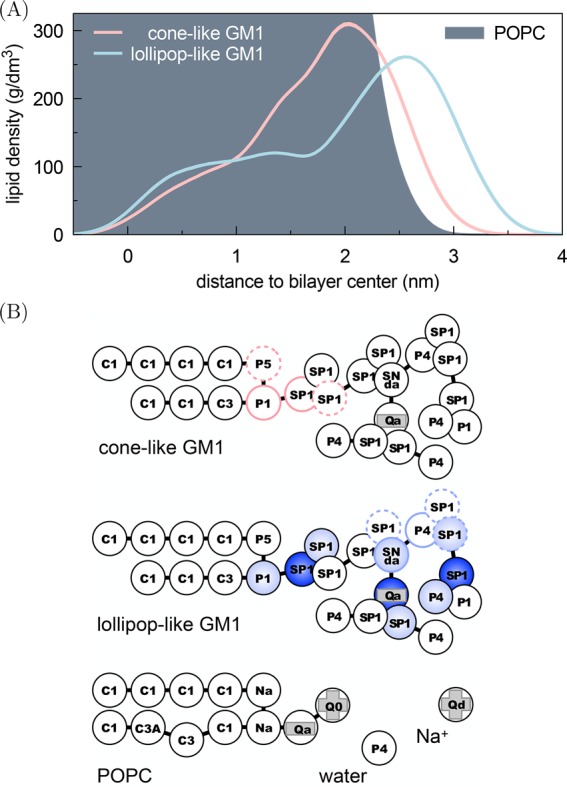
Different GM1 models led to different molecular shapes. (A) Density distributions for lipids in a given leaflet along the bilayer normal direction in symmetric bilayers containing 10 mol % GM1. (B) The cone-like GM1 model, first used by Dasgupta et al.,18 has the same nonbonded parameters as the lollipop-like GM1 introduced by Gu et al.,34 but its bonded parameters follow López et al.33 The codes within the beads indicate the Martini bead types.35 The charged beads are indicated by plus and minus signs (light gray). The angles that are only found in one model are indicated by three blue beads (the darker color indicating the central bead) and the dihedrals that are only found in one model by four beads with colored borderlines (the full lines indicating the central beads).The same POPC, Na+, and water models were used with both GM1 models.
The conformational differences observed between the two models (Figure 1) resulted in different leaflet areas occupied by the GM1 molecules. Figure 2 demonstrates that the leaflet area occupied by a single cone-like GM1 was slightly larger than that occupied by a single POPC. A lollipop-like GM1, on the other hand, occupied clearly less area than a POPC.
Figure 2.
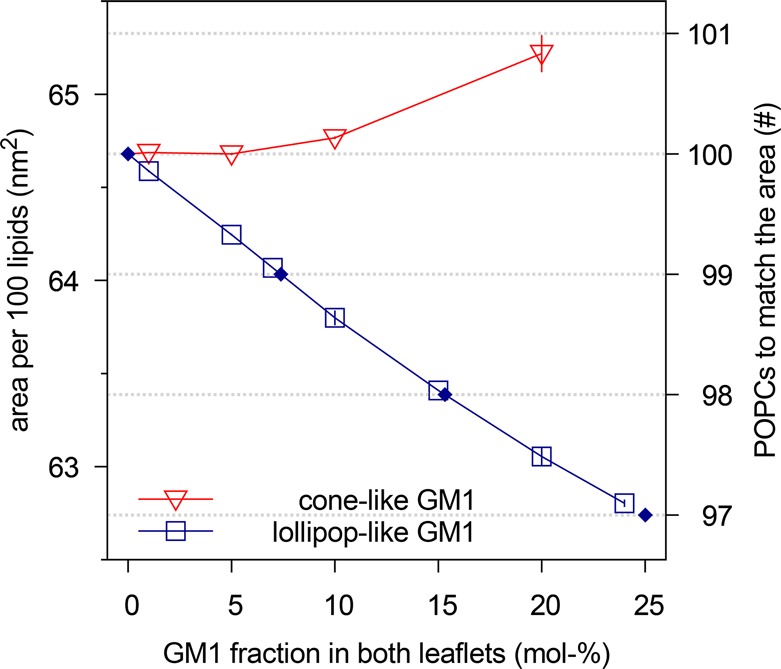
Preferred leaflet area for 100 lipids of POPC–GM1 mixture as a function of GM1 mole fraction. Here symmetric bilayers that had 100 lipids per leaflet were simulated in the NPT-ensemble to obtain tensionless bilayers and, thus, tensionless leaflets. The data for a mixture with cone-like GM1s (red triangles) imply that such a GM1 occupies slightly more leaflet area than a POPC. In contrast, the data for the lollipop-like GM1s (blue squares) reveal that this type of GM1 occupies much less leaflet area. Dotted horizontal lines correspond to the preferred leaflet areas for a certain integer number of POPCs as given by the secondary y-axis on the right; diamonds (◆) indicate the corresponding lollipop-like GM1 fractions for 100 lipids of the POPC–GM1 mixture as obtained by interpolation between the discrete data points (solid blue line).
It might seem somewhat counterintuitive that a lipid like GM1, which has a bulky headgroup, can take up less leaflet area than a POPC whose head is much smaller. The explanation, however, is readily available from Figure 1A, which shows that the large headgroup of lollipop-like GM1 resided mostly above the POPCs. As a consequence, the corresponding leaflet area is primarily determined by GM1’s sphingosine tails, which take less area than the glycerol-bound tails of a POPC.
Asymmetric Bilayers with Fixed Leaflet Compositions
Next, let us consider compositionally asymmetric bilayers with the upper leaflet consisting of the POPC–GM1 mixture as before, but the lower leaflet containing only POPC. Using the NPT ensemble, the bilayer is again maintained in a state where the total tension across the bilayer is (close to) zero. It then follows that the individual leaflet tensions must be equal in magnitude but opposite in sign. Furthermore, by judiciously choosing the number of lipids in each leaflet of an asymmetric bilayer, it is even possible to find leaflet compositions that will closely approximate the case of tensionless leaflets.
As a first approximation for the appropriate leaflet
compositions, we looked into the areas preferred in symmetric bilayers
(Figure 2) with the
aim of matching the area of the GM1-containing leaflet with that of
the pure-POPC leaflet. Let us denote the difference between the preferred
areas of the upper and lower leaflets by  . If we wish to obtain
  = 0 for the lollipop-like GM1, which requires
less leaflet area than a POPC, see Figure 2, we should decrease the number of POPCs
in the pure-POPC leaflet. For example, a leaflet with 7 mol % GM1,
corresponding to 7 GM1s and 93 POPCs, has roughly the same area as
99 POPCs. The condition of equal leaflet area is again met for 15
mol % and for 25 mol % GM1, roughly matching the area of 98 and 97
POPCs, respectively.
Now, does zero area difference imply tensionless leaflets? Figure 3 demonstrates that these two conditions are not really equivalent. To determine the leaflet tensions Σupp and Σlow of the upper and lower leaflets, we introduce the Cartesian coordinate z perpendicular to the bilayer and place the bilayer’s midsurface at z = 0. The upper and lower leaflets are then located at z > 0 and z < 0, respectively. From the stress profile s(z) across the bilayer, see Methods, we then obtain the leaflet tensions
| 1 |
and the tension difference
| 2 |
The difference ΔΣ is plotted in Figure 3 as a function of the GM1 mole fraction both for the cone-like and for the lollipop-like GM1.
Figure 3.
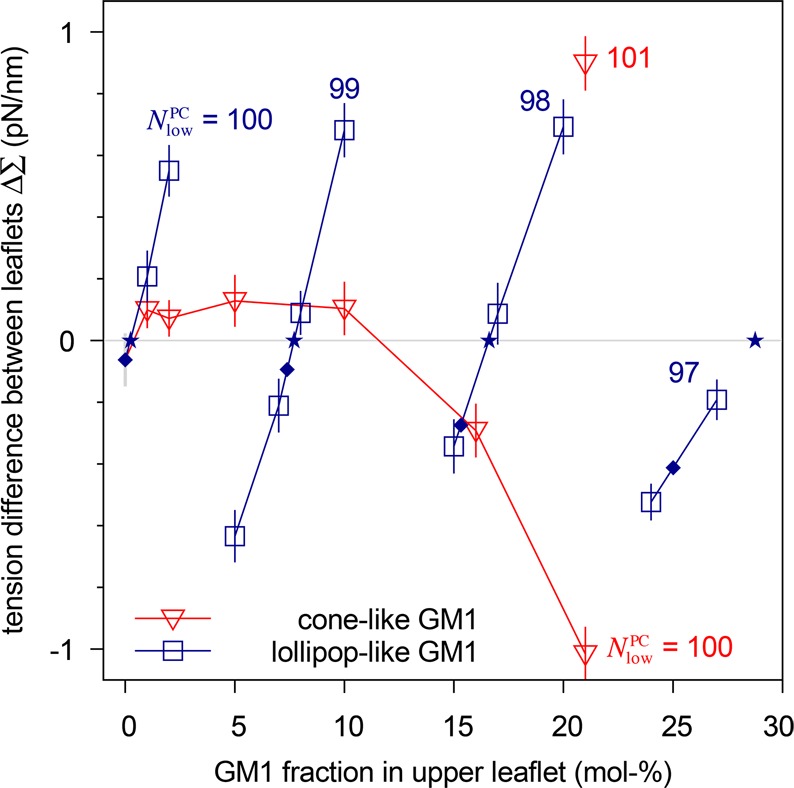
Tension difference between the leaflets, ΔΣ, as a function
of GM1 mole fraction in the upper leaflet. For both cone-like GM1
(red triangles) and lollipop-like GM1 (blue squares), the upper leaflet
contained a fixed total of 100 lipids, whereas the lower, pure-POPC
leaflet contained a variable number NlowPC of POPCs, adjusted
to match the preferred leaflet area of the upper leaflet, compare Figure 2. Data points obtained
for the same Nlow-value are joined by a line. Diamonds (◆)
indicate those lollipop-like GM1 fractions that fulfill the condition
of equal leaflet areas,  = 0, as interpolated in Figure 2. Stars (★) indicate
those lollipop-like GM1 fractions that fulfill the condition of equal
leaflet tensions, for which the tension difference ΔΣ
in eq 2 vanishes.
For the lollipop-like GM1, the condition of zero area difference corresponds to the diamonds in Figures 2 and 3. Inspection of Figure 3 reveals that these bilayers are characterized by a nonzero tension difference, whose magnitude increases with increasing GM1 fraction. For the cone-like GM1, the condition of zero area difference occurred at 21 mol % GM1 and 101 POPCs in the lower leaflet (Figure 2), but Figure 3 shows that this system again had a nonzero tension difference. Therefore, the condition of vanishing area difference is not equivalent to the condition of vanishing tension difference.
Asymmetric Bilayers with Flip-Flopping Lipid Species
We
now show that a nonzero tension difference ΔΣ relaxes
to zero when a flip-flopping lipid species is added to the bilayer.
To this end, we started from the asymmetric bilayer of 24 mol % lollipop-like
GM1: 76 POPCs and 24 GM1s in the upper leaflet and 97 POPCs in the
lower leaflet. This bilayer was characterized by practically zero
area difference,  = 0.06 ± 0.02 nm2 (Figure 2), but the tension
of its lower leaflet clearly exceeded the tension of its upper leaflet
with the tension difference ΔΣ = −0.5 ± 0.1
pN/nm (Figure 3).
We then replaced in each leaflet 10 POPCs by 10 cholesterols. During a 100 μs simulation, we found the Martini cholesterols35 to frequently flip-flop and to predominantly occupy the (lower) leaflet that was under tension in the absence of cholesterol (Figure 4A). On average there were 11.0 ± 0.2 cholesterols in the lower and 9.0 ± 0.2 in the upper leaflet. The tension difference between the leaflets, ΔΣ, depended monotonously on the instantaneous cholesterol asymmetry (Figure 4B); importantly, its mean value relaxed to ΔΣ = 0.2 ± 0.2 pN/nm. Figure 4C shows the average behavior of ΔΣ after a fluctuation has decreased the number of cholesterols in the lower leaflet below seven: We observe a monotonic decay toward the state of tensionless leaflets, a decay that is nonexponential over the first 500 ps, and thereafter well fitted by a single exponential with a time constant of 55 ns.
Figure 4.
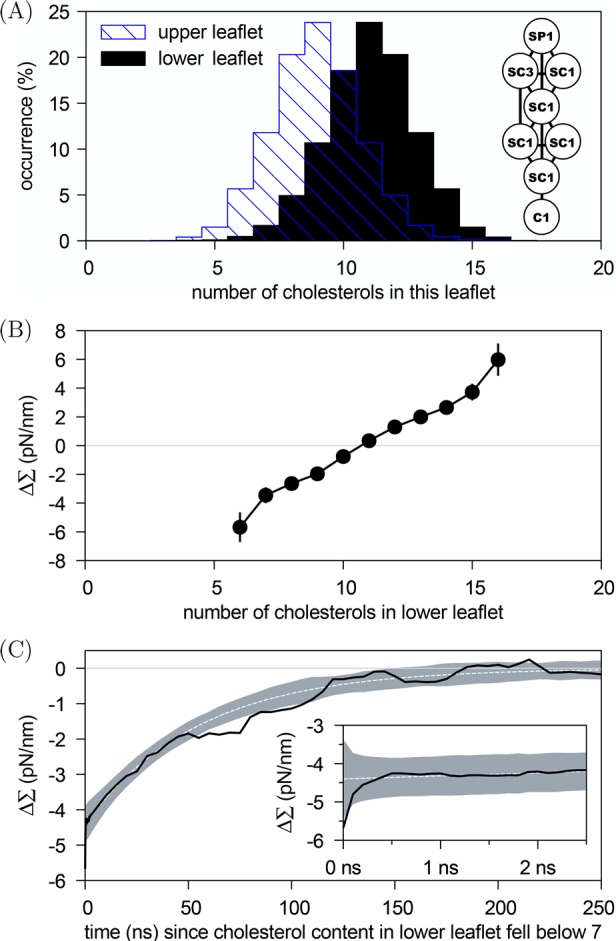
Tensionless leaflets attained via flip-flops (or transbilayer motion) of cholesterol: An asymmetric bilayer with 66 POPCs and 24 lollipop-like GM1s in the upper leaflet, 87 POPCs in the lower leaflet, and 20 cholesterols flip-flopping between the two leaflets was simulated for 100 μs. (A) Cholesterol distributions show the preference for the lower (black) over the upper (striped blue) leaflet; the average cholesterol numbers were 9.0 ± 0.2 in the upper and 11.0 ± 0.2 in the lower leaflet. The inset shows a sketch of the Martini cholesterol model.35 (B) Dependence of the tension difference between the leaflets, ΔΣ, on the number of cholesterols residing in the lower leaflet at a given instant of time. (C) Average relaxation (black solid line) toward the state with tensionless leaflets following the observed 258 events in which the number of cholesterols in the lower leaflet fell below 7. The shaded area shows the 68% confidence interval around an exponential decay (white dashed line) determined from the data. The inset zooms in on the first 2.5 ns.
What happens to area difference when tension difference
relaxes
to zero? Clearly, replacing equal amounts of POPCs by cholesterol
in both leaflets should preserve the condition  ≃ 0 of our initial asymmetric
bilayer.
To confirm this, we simulated, in the spirit of Figure 2, the corresponding symmetric bilayers with
leaflet compositions of 10:66:24 and 10:87:0 of cholesterol/POPC/GM1.
Indeed, these two bilayers had almost the same preferred leaflet area
difference,
  = 0.11 ± 0.04 nm2, as the
bilayers without cholesterol (0.06 ± 0.02 nm2, see
above). However, the two symmetric bilayers corresponding to the asymmetric
bilayer with ΔΣ = 0 (leaflet compositions of 9:66:24 and
11:87:0 of cholesterol/POPC/GM1) had different preferred areas with
  = −0.23 ± 0.04 nm 2. The negative sign indicates that the preferred area of the lower
(GM1-free) leaflet would exceed that of the upper (GM1-containing)
leaflet. This demonstrates that in the presence of a flip-flopping
species, a membrane will sacrifice zero preferred area difference,
  ≃ 0, in order to reach zero tension
difference, ΔΣ ≃ 0.
Generation of Spontaneous Curvature
In the absence of a flip-flopping species, an asymmetric and tensionless bilayer is typically characterized by leaflet tensions Σupp ≠ 0 and Σlow = −Σupp as has been shown for asymmetric lipid densities29 and asymmetric lipid compositions.31 In both cases, the spontaneous curvatures generated by these bilayer asymmetries can be understood intuitively, if one views the membrane as a thin layer bounded by two leaflet–water interfaces that have different interfacial tensions.29,36 Indeed, in order to reduce the total interfacial free energy, the membrane then prefers to bulge toward the leaflet with the lower interfacial tension.
In the previous section, we showed that an asymmetric and tensionless bilayer that contains at least one flip-flopping lipid species relaxes toward a state with tensionless leaflets, that is, with Σupp = 0 and Σlow = 0. We now demonstrate that the bilayer asymmetry can still generate a substantial spontaneous curvature even for tensionless leaflets. We consider a perpendicular section across the bilayer and focus on a stripe-like segment of this cross section with lateral width L∥. The microscopic torque per L∥ acting on such a stripelike segment is then given by the torque density29,31,37
| 3 |
corresponding to the negative first moment
of the lateral stress profile s(z) = PN – PT(z), where PN and PT are the normal and tangential
component of the pressure tensor, respectively. The torque density  is proportional to the product of the bending
rigidity κ and the spontaneous curvature m of
the bilayer. Therefore,
  should not depend on the choice for the
origin, z = 0, of the z-coordinate,
a requirement that is fulfilled as long as the whole bilayer is tensionless.
It is intuitively appealing to decompose the torque density  into two contributions arising from the
two leaflets via
  with
with
| 4 |
The two torque densities  and
and  do not depend on the origin of the z-coordinate
as long as both leaflets are tensionless. However,
even when the leaflets are tensionless, the two torque densities
  and
and  need not have the same magnitude for an
asymmetric bilayer. The latter situation will lead to a nonzero torque
density
  , implying a nonzero spontaneous curvature m in eq 3.
Figure 5 displays
the torque density  for asymmetric bilayers as a function of
GM1 mole fraction in the upper leaflet. We increased this fraction
by replacing POPCs with GM1s, that is, keeping the total number of
lipids in the upper leaflet fixed at 100. The lower leaflet contained NlowPC POPCs, and no GM1s.
Figure 5.
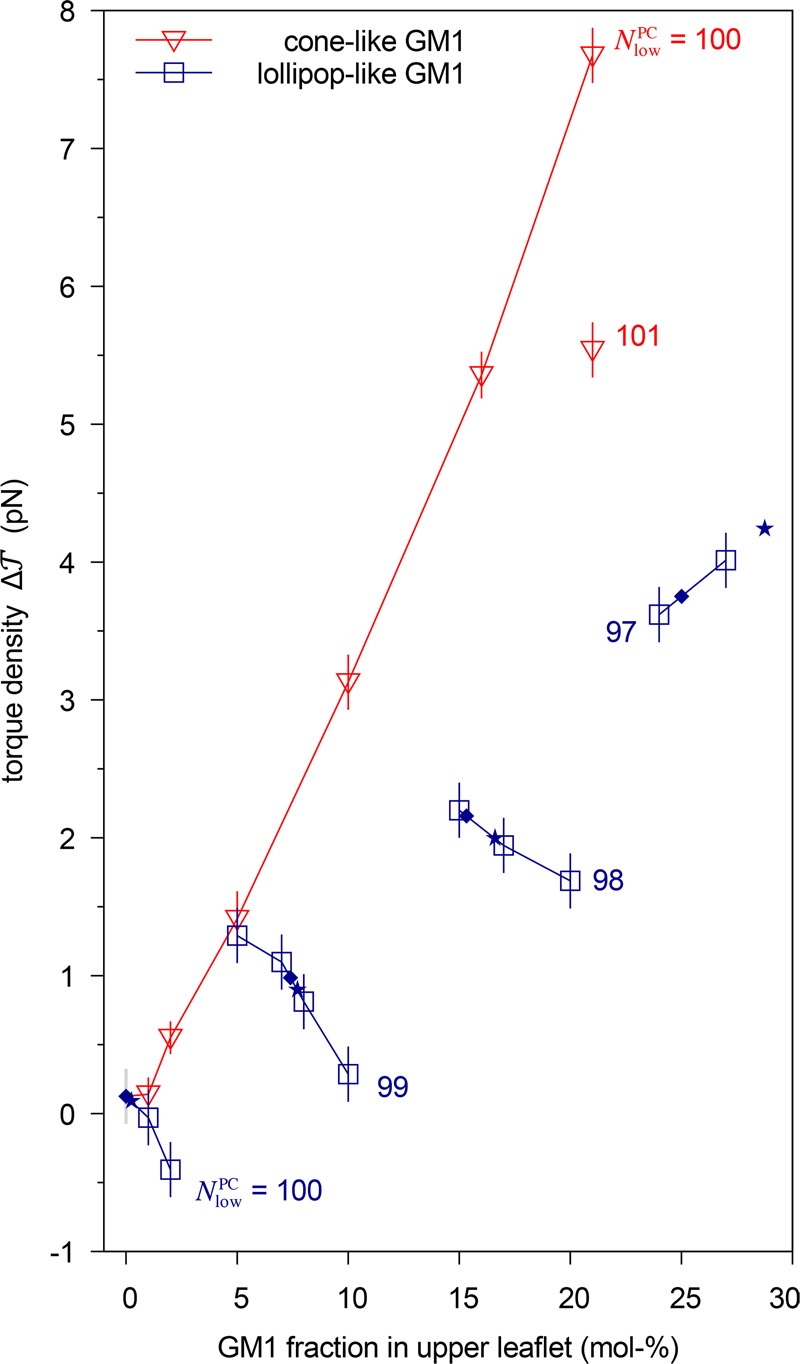
Torque density  as a function of GM1 mole fraction in the
upper leaflet. For both cone-like GM1 (red triangles) and lollipop-like
GM1 (blue squares), the upper leaflet contained a fixed total number
of 100 lipids, whereas the lower, pure-POPC, leaflet contained a variable
number of POPCs, NlowPC, adjusted to match the preferred leaflet
area of the upper leaflet, compare Figure 2. Data points with equal Nlow are joined
by a line. Diamonds (◆) indicate those lollipop-like GM1 fractions
that fulfill the condition of equal leaflet areas,
  , as interpolated
in Figure 2. Stars
(★) indicate those lollipop-like
GM1 fractions that fulfill the condition of equal leaflet tensions,
ΔΣ = 0, as interpolated in Figure 3.
For the lollipop-like GM1 data in Figure 5, we can again distinguish bilayers with
tensionless leaflets, data points with stars (★), from those
with equal preferred areas, data with diamonds (◆). Focusing
on these two sets of data, we can draw two immediate conclusions.
First, asymmetric bilayers with tensionless leaflets (★) were
characterized by a spontaneous curvature  that
increased monotonically and roughly
linearly with the GM1 mole fraction in the upper leaflet. Furthermore,
asymmetric bilayers with tensionless leaflets (★) and equal
preferred areas (◆) led to a rather similar dependence of the
spontaneous curvature on the GM1 mole fraction.
Let us now concentrate in Figure 5 on bilayers with ΔΣ ≃ 0 and let us compare the ★ data for lollipop-like GM1 to the data for cone-like GM1. We see that when the leaflets were tensionless, 2κm increased differently in the cone-like and lollipop-like GM1s. We have demonstrated before18 that the cone-like GM1 is able to capture quantitatively the experimentally observed dependence of 2κm on GM1 asymmetry between the leaflets. Therefore, the weaker dependence shown by the lollipop-like GM1 suggests that the molecular shape of the real GM1 in POPC bilayer is closer to a cone than to a lollipop.
Conclusions
We demonstrated that asymmetric and tensionless bilayers relax toward states with tensionless leaflets when they contain a lipid species that undergoes frequent flip-flops between the two leaflets (Figure 4). We also showed that asymmetric bilayers exhibit a significant spontaneous curvature even if both leaflets are tensionless. In the specific example studied here, the bilayer asymmetry was determined by the mole fraction of GM1 in the upper leaflet. The associated spontaneous curvature was found to increase monotonically and roughly linearly with this mole fraction (Figure 5).
In our study, we focused on lipid bilayers with bilayer tension Σ = Σupp + Σlow = 0 but our results can be directly generalized to bilayers that experience a nonzero tension Σ ≠ 0. In the latter situation, the presence of a flip-flopping species will lead to equal leaflet tensions Σupp = Σlow = Σ/2, which again implies that the tension difference ΔΣ = Σupp – Σlow vanishes. Furthermore, our results can be extended to bilayer membranes with an arbitrary number of lipid components. If such a bilayer contains at least one lipid component that undergoes frequent flip-flops on the accessible time scales, it will relax toward a state with tensionless leaflets.
When a lipid molecule undergoes a transition from one leaflet to the other, its polar headgroup must move across the hydrophobic core of the bilayer. The associated hydrophobic interactions determine the free energy barrier encountered by the flip-flopping lipid. Therefore, the flip-flops observed in our simulations represent thermally activated processes. In cellular membranes, this process is modulated by certain membrane proteins. Three families of such proteins can be distinguished.4 Scramblases facilitate bidirectional flip-flops between the bilayer leaflets by reducing the free energy barrier for this process. Flippases and floppases hydrolyze ATP to pump lipids toward or away from the cytosplasmic leaflet, respectively. Scramblases should accelerate the relaxation process toward bilayer states with tensionless leaflets. Flippases and floppases, on the other hand, can prevent the bilayer from attaining such a state with tensionless leaflets, if the proteins pump the lipids with a sufficiently high rate. Thus, fast pumping from the donor to the acceptor leaflet will increase the pressure in the acceptor leaflet which will then generate a lipid flux in the opposite direction until a steady state with nonzero leaflet tensions has been reached.
Methods
We used the fast, flexible, and free GROMACS38 engine version 5.1.1 to run Martini35 coarse-grained molecular dynamics simulations of GM1-containing POPC bilayers at full hydration with sodium ions to obtain zero net charge; the effect of a frequently flip-flopping species was studied by including cholesterol. We used the Martini-straight parameters:39 Timestep 20 fs, Verlet neighbor lists updated every 400 fs with the neighbor list radius automatically determined, Lennard-Jones and Coulomb potentials and forces cut off at 1.1 nm with the potentials shifted to zero at the cutoff using the potential modifiers, NPT simulations through the Parrinello–Rahman40 (semi-isotropic, P = 1 bar, τP = 12 ps), and Bussi–Donadio–Parrinello41 (membrane coupled separately from the rest, T = 303 K, τT = 1 ps) coupling schemes. Systems were built with CHARMM-GUI42,43 and allowed to relax for 1 μs before collecting data (for a minimal run time of 20 μs and a maximal run time of 300 μs); simulation trajectories and input files are permanently openly available on Zenodo.44
We calculated the lateral stress profiles s(z) by postprocessing (every 100 ps) saved trajectories with the Gromacs-4.5.5-LS package;45,46 note that only the Goetz–Lipowsky decomposition32 could be used, as the Central Force Decomposition47 can not be applied to the particular types of dihedral potentials present in the Martini GM1 headgroup. The bilayer was first centered such that its midplane (defined as the center of mass of the triply bonded Na-type beads in POPCs, see Figure 1; from lower leaflet only as many POPCs were considered as there were in the upper leaflet) was at z = 0. In each saved frame, the box was divided in 201 bins along the z (bilayer normal) direction, for which the local stress tensor σ(z) was calculated, and the lateral stress profile obtained as
| 5 |
The tension difference ΔΣ
(see eq 2) and the torque
density  (eq 3) were calculated by numerical integration of the lateral
stress profiles obtained at individual time points and then taking
the time average. This approach provided a natural way of estimating
the errors through the block-averaging approach;48 if block-averaging failed to find a plateau spanning 2
orders of magnitude in time, we estimated the error visually from
the cumulative average.
We assigned cholesterols to their leaflets based on the z-coordinate of the SP1-type bead, see Figure 4A. Figure 4C displays the average time dependence of the tension difference ΔΣ(t) following a random event (indicated by time t = 0) that took the number of cholesterols in the lower leaflet Nlowcho below 7. To obtain Figure 4C we used the mapping ΔΣ(Nlow) of Figure 4B to get for each such random event the time trace ΔΣ(Nlowcho(t)) and then averaged over all the 258 events observed.
Acknowledgments
This study has been supported by the MaxSynBio consortium, jointly funded by the Max Planck Society and the Federal Ministry of Education and Research (BMBF). M.S.M. thanks O. H. Samuli Ollila for many useful discussions.
The authors declare no competing financial interest.
References
- van Meer G.; Voelker D. R.; Feigenson G. W. Nat. Rev. Mol. Cell Biol. 2008, 9, 112–124. 10.1038/nrm2330. [DOI] [PMC free article] [PubMed] [Google Scholar]
- Fadeel B.; Xue D. Crit. Rev. Biochem. Mol. Biol. 2009, 44, 264–277. 10.1080/10409230903193307. [DOI] [PMC free article] [PubMed] [Google Scholar]
- Marquardt D.; Geier B.; Pabst G. Membranes 2015, 5, 180–196. 10.3390/membranes5020180. [DOI] [PMC free article] [PubMed] [Google Scholar]
- Yang Y.; Lee M.; Fairn G. D. J. Biol. Chem. 2018, 293, 6230–6240. 10.1074/jbc.R117.000582. [DOI] [PMC free article] [PubMed] [Google Scholar]
- van der Meer B. W. In Biomembranes: Physical Aspects; Shinitzky M., Ed.; VCH Verlagsgesellschaft, 1993; pp 97–158. [Google Scholar]
- Liu J.; Conboy J. C. Biophys. J. 2005, 89, 2522–2532. 10.1529/biophysj.105.065672. [DOI] [PMC free article] [PubMed] [Google Scholar]
- Liu J.; Brown K. L.; Conboy J. C. Faraday Discuss. 2013, 161, 45–61. 10.1039/C2FD20083J. [DOI] [PubMed] [Google Scholar]
- Steck T. L.; Ye J.; Lange Y. Biophys. J. 2002, 83, 2118–2125. 10.1016/S0006-3495(02)73972-6. [DOI] [PMC free article] [PubMed] [Google Scholar]
- Hamilton J. A. Curr. Opin. Lipidol. 2003, 14, 263–271. 10.1097/00041433-200306000-00006. [DOI] [PubMed] [Google Scholar]
- Bruckner R. J.; Mansy S. S.; Ricardo A.; Mahadevan L.; Szostak J. W. Biophys. J. 2009, 97, 3113–3122. 10.1016/j.bpj.2009.09.025. [DOI] [PMC free article] [PubMed] [Google Scholar]
- Devaux P. F. FEBS Lett. 1988, 234, 8–12. 10.1016/0014-5793(88)81291-2. [DOI] [PubMed] [Google Scholar]
- Sebastian T. T.; Baldridge R. D.; Xu P.; Graham T. R. Biochim. Biophys. Acta, Mol. Cell Biol. Lipids 2012, 1821, 1068–1077. 10.1016/j.bbalip.2011.12.007. [DOI] [PMC free article] [PubMed] [Google Scholar]
- Hankins H. M.; Baldridge R. D.; Xu P.; Graham T. R. Traffic 2015, 16, 35–47. 10.1111/tra.12233. [DOI] [PMC free article] [PubMed] [Google Scholar]
- Dimova R.; Aranda S.; Bezlyepkina N.; Nikolov V.; Riske K.; Lipowsky R. J. Phys.: Condens. Matter 2006, 18, S1151–S1176. 10.1088/0953-8984/18/28/S04. [DOI] [PubMed] [Google Scholar]
- Berndl K.; Käs J.; Lipowsky R.; Sackmann E.; Seifert U. Europhys. Lett. 1990, 13, 659–664. 10.1209/0295-5075/13/7/015. [DOI] [Google Scholar]
- Richmond D. L.; Schmid E. M.; Martens S.; Stachowiak J. C.; Liska N.; Fletcher D. A. Proc. Natl. Acad. Sci. U. S. A. 2011, 108, 9431–9436. 10.1073/pnas.1016410108. [DOI] [PMC free article] [PubMed] [Google Scholar]
- Chiantia S.; Schwille P.; Klymchenko A. S.; London E. Biophys. J. 2011, 100, L1–L3. 10.1016/j.bpj.2010.11.051. [DOI] [PMC free article] [PubMed] [Google Scholar]
- Dasgupta R.; Miettinen M. S.; Fricke N.; Lipowsky R.; Dimova R. Proc. Natl. Acad. Sci. U. S. A. 2018, 115, 5756–5761. 10.1073/pnas.1722320115. [DOI] [PMC free article] [PubMed] [Google Scholar]
- Steinkühler J.; De Tillieux P.; Knorr R. L.; Lipowsky R.; Dimova R. Sci. Rep. 2018, 8, 11838. 10.1038/s41598-018-30286-z. [DOI] [PMC free article] [PubMed] [Google Scholar]
- Seifert U.; Berndl K.; Lipowsky R. Phys. Rev. A: At., Mol., Opt. Phys. 1991, 44, 1182–1202. 10.1103/PhysRevA.44.1182. [DOI] [PubMed] [Google Scholar]
- Miao L.; Seifert U.; Wortis M.; Döbereiner H.-G. Phys. Rev. E: Stat. Phys., Plasmas, Fluids, Relat. Interdiscip. Top. 1994, 49, 5389–5407. 10.1103/PhysRevE.49.5389. [DOI] [PubMed] [Google Scholar]
- Helfrich W. Z. Z. Naturforsch., C: J. Biosci. 1973, 28, 693–703. 10.1515/znc-1973-11-1209. [DOI] [PubMed] [Google Scholar]
- Lipowsky R. In Statistical Mechanics of Biocomplexity; Reguera D., Rubi J. M., Vilar J. M. B., Eds.; Lecture Notes in Physics; Springer: Berlin, 1999; Vol. 527; pp 1–23. [Google Scholar]
- Svetina S.; Žekš B. Eur. Biophys. J. 1989, 17, 101–111. 10.1007/BF00257107. [DOI] [PubMed] [Google Scholar]
- Sheetz M. P.; Singer S. J. Proc. Natl. Acad. Sci. U. S. A. 1974, 71, 4457–4461. 10.1073/pnas.71.11.4457. [DOI] [PMC free article] [PubMed] [Google Scholar]
- Evans E. A. Biophys. J. 1974, 14, 923–931. 10.1016/S0006-3495(74)85959-X. [DOI] [PMC free article] [PubMed] [Google Scholar]
- Döbereiner H.-G.; Evans E.; Kraus M.; Seifert U.; Wortis M. Phys. Rev. E: Stat. Phys., Plasmas, Fluids, Relat. Interdiscip. Top. 1997, 55, 4458–4474. 10.1103/PhysRevE.55.4458. [DOI] [PubMed] [Google Scholar]
- Esteban-Martín S.; Risselada H. J.; Salgado J.; Marrink S. J. J. Am. Chem. Soc. 2009, 131, 15194–15202. 10.1021/ja904450t. [DOI] [PubMed] [Google Scholar]
- Rozycki B.; Lipowsky R. J. Chem. Phys. 2015, 142, 054101. 10.1063/1.4906149. [DOI] [PubMed] [Google Scholar]
- Park S.; Beaven A. H.; Klauda J. B.; Im W. J. Chem. Theory Comput. 2015, 11, 3466–3477. 10.1021/acs.jctc.5b00232. [DOI] [PMC free article] [PubMed] [Google Scholar]
- Sreekumari A.; Lipowsky R. J. Chem. Phys. 2018, 149, 084901. 10.1063/1.5038427. [DOI] [PubMed] [Google Scholar]
- Goetz R.; Lipowsky R. J. Chem. Phys. 1998, 108, 7397–7409. 10.1063/1.476160. [DOI] [Google Scholar]
- López C. A.; Sovova Z.; van Eerden F. J.; de Vries A. H.; Marrink S. J. J. Chem. Theory Comput. 2013, 9, 1694–1708. 10.1021/ct3009655. [DOI] [PubMed] [Google Scholar]
- Gu R.-X.; Ingólfsson H. I.; de Vries A. H.; Marrink S. J.; Tieleman D. P. J. Phys. Chem. B 2017, 121, 3262–3275. 10.1021/acs.jpcb.6b07142. [DOI] [PMC free article] [PubMed] [Google Scholar]
- Marrink S. J.; Risselada H. J.; Yefimov S.; Tieleman D. P.; de Vries A. H. J. Phys. Chem. B 2007, 111, 7812–7824. 10.1021/jp071097f. [DOI] [PubMed] [Google Scholar]
- Bancroft W. D. J. Phys. Chem. 1912, 17, 501–519. 10.1021/j150141a002. [DOI] [Google Scholar]
- Helfrich W.Amphiphilic mesophases made of defects. Physics of Defects; North-Holland Publishing Company: Amsterdam, 1981; pp 715–755. [Google Scholar]
- Abraham M. J.; Murtola T.; Schulz R.; Páll S.; Smith J. C.; Hess B.; Lindahl E. SoftwareX 2015, 1–2, 19–25. 10.1016/j.softx.2015.06.001. [DOI] [Google Scholar]
- de Jong D. H.; Baoukina S.; Ingólfsson H. I.; Marrink S. J. Comput. Phys. Commun. 2016, 199, 1–7. 10.1016/j.cpc.2015.09.014. [DOI] [Google Scholar]
- Parrinello M.; Rahman A. J. Appl. Phys. 1981, 52, 7182–7190. 10.1063/1.328693. [DOI] [Google Scholar]
- Bussi G.; Donadio D.; Parrinello M. J. Chem. Phys. 2007, 126, 014101. 10.1063/1.2408420. [DOI] [PubMed] [Google Scholar]
- Jo S.; Kim T.; Iyer V. G.; Im W. J. Comput. Chem. 2008, 29, 1859–1865. 10.1002/jcc.20945. [DOI] [PubMed] [Google Scholar]
- Qi Y.; Ingólfsson H. I.; Cheng X.; Lee J.; Marrink S. J.; Im W. J. Chem. Theory Comput. 2015, 11, 4486–4494. 10.1021/acs.jctc.5b00513. [DOI] [PubMed] [Google Scholar]
- Miettinen M. S.; Lipowsky R. Simulations used in "Bilayer membranes with frequent flip-flops have tensionless leaflets". Zenodo 2019, 10.1021/acs.nanolett.9b01239. [DOI] [PMC free article] [PubMed] [Google Scholar]
- Ollila O. H. S.; Risselada H. J.; Louhivuori M.; Lindahl E.; Vattulainen I.; Marrink S. J. Phys. Rev. Lett. 2009, 102, 078101. 10.1103/PhysRevLett.102.078101. [DOI] [PubMed] [Google Scholar]
- Vanegas J. M.; Torres-Sánchez A.; Arroyo M. J. Chem. Theory Comput. 2014, 10, 691–702. 10.1021/ct4008926. [DOI] [PubMed] [Google Scholar]
- Admal N. C.; Tadmor E. B. J. Elast. 2010, 100, 63–143. 10.1007/s10659-010-9249-6. [DOI] [Google Scholar]
- Flyvbjerg H.; Petersen H. G. J. Chem. Phys. 1989, 91, 461–466. 10.1063/1.457480. [DOI] [Google Scholar]


