

Abstract
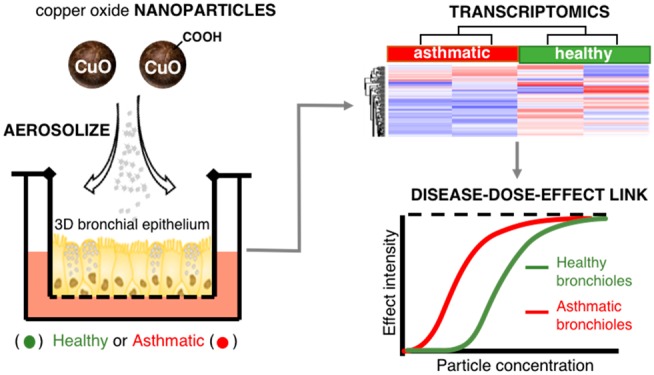
More than 5% of any population suffers from asthma, and there are indications that these individuals are more sensitive to nanoparticle aerosols than the healthy population. We used an air–liquid interface model of inhalation exposure to investigate global transcriptomic responses in reconstituted three-dimensional airway epithelia of healthy and asthmatic subjects exposed to pristine (nCuO) and carboxylated (nCuOCOOH) copper oxide nanoparticle aerosols. A dose-dependent increase in cytotoxicity (highest in asthmatic donor cells) and pro-inflammatory signaling within 24 h confirmed the reliability and sensitivity of the system to detect acute inhalation toxicity. Gene expression changes between nanoparticle-exposed versus air-exposed cells were investigated. Hierarchical clustering based on the expression profiles of all differentially expressed genes (DEGs), cell-death-associated DEGs (567 genes), or a subset of 48 highly overlapping DEGs categorized all samples according to “exposure severity”, wherein nanoparticle surface chemistry and asthma are incorporated into the dose–response axis. For example, asthmatics exposed to low and medium dose nCuO clustered with healthy donor cells exposed to medium and high dose nCuO, respectively. Of note, a set of genes with high relevance to mucociliary clearance were observed to distinctly differentiate asthmatic and healthy donor cells. These genes also responded differently to nCuO and nCuOCOOH nanoparticles. Additionally, because response to transition-metal nanoparticles was a highly enriched Gene Ontology term (FDR 8 × 10–13) from the subset of 48 highly overlapping DEGs, these genes may represent biomarkers to a potentially large variety of metal/metal oxide nanoparticles.
Keywords: copper(II) oxide, nanoparticles, asthma, 3d human bronchial epithelial cells, air−liquid interface and transcriptomics
Asthma is a chronic respiratory disease with extremely high susceptibility to environmental exposures such as allergens,1 chemicals,2 and particulate air pollutants.3−5 Asthmatic airways are typically chronically inflamed and extremely hyper-reactive, with symptoms such as recurrent wheezing, coughing, and shortness of breath. Asthma prevalence has steadily increased over the last three decades and is a major public health burden. The most recent survey estimates that as much as 4.4% of the global population (334 million people) is affected by asthma (Global Asthma Network, 2014). There is thus a clear need to prioritize development of comprehensive risk assessment frameworks and tools that take this highly susceptible population into account during implementation of regulatory and monitoring programs to curb or follow up on potentially hazardous exposures.
The varied and configurable physical and chemical properties of ENM amplify their industrial and medical applicability. Unfortunately, the toxicity of ENM can be mediated by physical and chemical properties; including, but not limited to size, shape, surface charge, aspect ratio, functionalization, etc.6,7 As a result, the number of toxicologically relevant nanoforms scales dramatically. With regards to health hazard assessment, this poses a tremendous burden (costs and ethical considerations) on the extent of animal testing that will be required. Efficient, accurate and scalable ex vivo test methods which are still applicable to human exposures and can be used to evaluate the potential health hazards associated with ENM in a timely manner, are needed. Three-dimensional cocultures for nanoparticle exposure at an air–liquid interface that mimics the human lung have recently been developed.8,9 Using this system in combination with adverse outcome assays, in vitro simulation of particle exposure and potential health hazard has been successfully performed for airborne particles and fibers.10−14
Metal oxides are one of the most abundantly produced types of engineered nanomaterials (ENM) with production volumes of up to thousands of tons every year. The electrical, optical, and magnetic features of copper oxide (CuO) makes them appealing for a variety of industrial and commercial applications such as electronic chips, solar cells, lithium batteries, paints, processed wood, and plastics. CuO nanomaterials have already been used or could be utilized in food packaging,15 wound dressings,16 skin products, and hospital textiles.17 Production volumes of CuO nanoparticles are expected to reach 1600 tons by the year 2025.18 Therefore, because CuO has a very high potential for both occupational and consumer exposure, we have used it as a model to investigate potentially enhanced nanoparticle sensitivity within the context of pre-existing asthma. Unraveling the mechanistic interplay between nanoscale materials and asthma has been thus far limited to a handful of studies.19 As such, employing an in vitro 3D human bronchial epithelial model in tandem with extensive downstream transcriptomic assessment in healthy and vulnerable individuals with a disease-compromised respiratory system is the subject of this study. 3D human bronchial epithelial cells cultured at an air–liquid interface that mimics relevant inhalatory exposure20 were exposed to aerosols of pristine (nCuO) and carboxylated (nCuOCOOH) copper oxide nanoparticles. We hypothesized that coupling this exposure setup with global transcriptomic assessment will enable identification of altered defense mechanisms and/or enhanced particle sensitivity as a result of pre-existing asthma. In addition, because these primary cells are derived from nasal/bronchial biopsies of donors, mode-of-action based approaches can inform on biomarker candidates that can be developed and investigated via noninvasive sampling in “high-exposure-risk” and “high-susceptibility” subjects.
Results and Discussion
Experimental Setup and Particle Dose Characterization
The experimental setup is depicted in Figure 1A. Cells were exposed to nanoparticle aerosols for 1 h, and all assay samples were collected after a 24 h incubation period. In a single-exposure experiment, air control, low-, mid-, and high-dose groups are exposed simultaneously using a Vitrocell exposure system. Each Vitrocell consists of three slots (inserts); thus, every time a test block is exposed, the cell material within its three inserts originates from a single donor only. Previous work has shown that when using this approach, for any parameter, differences in the average for the donors are not affected by differences among sessions, test blocks, or concentrations.20 Similarly, the differences in averages of the four CuO concentrations are not affected by interdonor variation.
Figure 1.

Experimental setup with exposure, nanoparticle, and donor cell characterization. (A) Schematic of aerosolization, dilution, exposures, and implemented downstream bioassays. (B) Scanning electron microscope view of pristine (nCuO, upper panel) and COOH-functionalized (nCuOCOOH, lower panel) copper oxide nanoparticles on a filter membrane. The filter pore sizes were 0.4 μm (nCuO) and 0.8 μm (nCuOCOOH). Twenty-four hours after the 1 h exposures at four different doses, particle deposition could be visually observed in all non-zero doses. Representative images of an air (zero) versus high dose in healthy and asthmatic donor cells are shown in (C). Cell layers of donor cells are more homogeneous compared to asthmatic cells. Changes in cell cytotoxicity were assessed by measuring release of lactate dehydrogenase (LDH) into culture medium (D). Twenty-four hours after exposures, a dose-dependent increase in relative LDH release, consistent with increasing cytotoxicity, was observed for both nanomaterials and cell types (D). The y-axis represents percent cellular cytotoxicity, with respect to their corresponding air-exposed controls. Maximum cell death observed across all exposures was around 25%. Cytotoxicity was highest in asthmatic donor cells, and pristine nCuO appears to be more cytotoxic than COOH-functionalized nCuO (nCuOCOOH). Bars are the mean with SD of three (healthy) or five (asthmatic) biological replicates. Each value was derived from the mean of three technical replicates. Statistical significance was inferred via two-way ANOVA and * denotes p-value < 0.05.
Aerosolization of nCuO resulted in agglomeration or aggregation of the particles with a median mass aerodynamic diameter (MMAD) of 1.8 μm (geometric SD = 1.57) and a MMAD of 1.4 μm (geometric SD = 1.48) for nCuOCOOH, measured using an aerodynamic particle sizer (APS) in the high dose (buffer chamber). Agglomerates or aggregates are likely to be the predominant form of the particle that interacted with all types of cells in our experiments. Such agglomeration or aggregation has been reported before.21,22 Particle concentration was calculated using an APS and a scanning mobility particle sizer (SMPS) simultaneously. APS/SMPS analyses showed particle concentrations of 6.15 × 10⁵ and 1.65 × 10⁶ particles/cm3 for nCuO and nCuOCOOH, respectively. Scanning electron microscopy (SEM) images are shown in Figure 1B. The actual exposure concentrations for the low, mid, and high groups were deduced from parallel exposures to be 23, 120, and 470 mg/m3, respectively, for nCuO and 32, 128, and 495 mg/m3 for nCuOCOOH. The deposited dose was determined for the low and mid groups to be 14% (nCuO) and 15% (nCuOCOOH) of the actual exposure concentrations. Because particle deposition at constant flow rates is governed by particle diameter,23 we can directly infer that similar deposition rates (14–15%) will be observed in the high group exposures. Aerosol deposition mechanisms in the lungs, especially with relevance to drug delivery, have been well studied. The deposition of an inhaled particle is dependent on its size. Keeping in mind that the aerosolized nanoparticles consisted of agglomerates with a mean diameter of 1.8 μm (nCuOCOOH nanoparticles) and 1.4 μm (nCuO nanoparticles), the observed 14–15% deposition rate is in line with modeled and experimentally determined 10 to 20% human bronchial airway deposition of unit density particles with a diameter of 1–2 μm.24,25
Real-Life Human Exposure Extrapolation
Extrapolating in vitro doses to human lungs is often problematic because lung morphology, air flow patterns and mucociliary particle clearance are all subject to inter individual and physiological state variability.26 Nonetheless, we have combined previous calculations from similar exposure scenarios to derive estimates of the equivalent human exposures for the low, mid and high doses used herein. Regulatory occupational exposure limits do not exist for CuO and its derived nanoparticles. Going by the permissible exposure limit (PEL) (5 mg/m3) for respirable dust of particles not otherwise regulated as defined by the US Occupational Safety & Health Administration (2012), the low, mid and high dose exposures corresponded to approximately 1, 6, and 22 8 h work days of constant human conducting airways exposure.
These real-life exposures were extrapolated as follows: first we averaged the two concentrations corresponding to low (23 and 32 mg/m3), mid (120 and 128 mg/m3), or high dose (470 and 495 mg/m3) for nCuO and nCuOCOOH particles. Having used the same Vitrocell air–liquid interface exposure system, we next derived mass/surface area exposure concentrations from 27.5 mg/m3 (low), 124 mg/m3 (mid), and 482.5 mg/m3 (high) concentrations, as described for exposure of CeO2 nanoparticles.10 Following these calculations (summarized in materials and methods section), at a flow rate of 1.5 mL/min and 15% deposition, donor cells in each Vitrocell insert were exposed to approximately 1.2 μg/cm2 (low), 5.6 μg/cm2 (mid), and 21.7 μg/cm2 (high) nanoparticles. The average deposited dose normalized by the regional surface area is the default dose metric for respiratory effects of inhaled poorly soluble particles.27 As such, we extrapolated the mass/area doses of the air–liquid interface to human bronchial epithelium. Incidentally, for particles with average aerodynamic diameters of 1–2 μm24 (note that the MMAD of aggregates/agglomerates of nCuO and nCuOCOOH nanoparticles in the current exposures are 1.8 and 1.4 μm, respectively), five different deposition models have assigned a bronchial deposition rate of around 10%. Human bronchial airway surface area of 2709–4767 cm2 for a healthy adult have been reported.27,28 To avoid being too conservative in our human equivalent dose estimates, we will use the 4767 cm2 bronchial surface area to derive region-specific doses. Finally, in order to relate the human equivalent dose to a real-life scenario, we based our extrapolations on the 5 mg/m3 PEL of occupational exposure (NIOSH, 2012). Shvedova and colleagues29 estimated the workplace nanoparticle human lung burden per day as
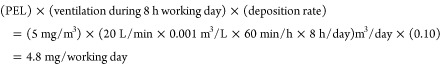 |
This implies, the low (1.2 μg/cm2), mid (5.6 μg/cm2) and high (21.7 μg/cm2) doses used in our study can be extrapolated to 1.2 ÷ 1.006 = 1.2 days, 5.9 ÷ 1.006 = 5.8 days and 21.7 ÷ 1.006 = 21.6 days of constant exposure of the bronchial airway to CuO and CuOCOOH nanoparticle aerosols in an occupational setting. Therefore, all three doses employed in the described air–liquid interface exposures can be described as human-relevant, from a realistic exposure perspective.
Visual Microscopic Inspection and Cellular Cytotoxicity Assessment
Microscopic examinations prior to nanoparticle exposure of the epithelia reveal vacuoles formed by enlarged cells. Such structures could also be observed in the epithelia constituted with cells from healthy donors, even though to a lesser extent (Figure 1C, air exposure). These vacuoles do not compromise the barrier function of the epithelia, since the regularly measured transepithelial electrical resistance of the epithelia derived from asthmatic donor cells was within the normal range (>100 Ω*cm2). In addition, when these asthmatic 3D cultures are established, culture media is absent from the apical surface of the epithelia, further confirming the structural integrity of the epithelial surface (information obtained via personal correspondence with Epithelix). Nanoparticle exposure of cells resulted in visual observable particle deposition at all doses, with the cells of asthmatic origin showing a less homogeneous cell layer compared to the cells from healthy donors (Figure 1C, high dose exposure). In both the healthy and asthmatic cells, we also observed cilia beating before and immediately after the exposures. Twenty-four hours after the 1 h exposures, most of the nanoparticle agglomerates/aggregates were located on the outer side of the insert, possibly moved there by beating cilia. LDH measurements showed that the cellular cytotoxicity was less than 25% in all exposures (Figure 1D). Compared to unexposed cells, a significant (p-value < 0.05) increase in cytotoxicity was observed in both healthy (high dose only) and asthmatic cells (low, mid, and high dose), with the highest levels of cytotoxicity detected in asthmatics. With impaired tracheobronchial mucociliary clearance observed even in the airways of nonsymptomatic asthmatic subjects,30 a higher nanoparticle-induced cellular cytotoxicity in asthmatic donor cells confirms the reliability of the model to distinguish asthmatic and healthy bronchial airways. Inefficient particle clearance prolongs epithelium–nanoparticle interaction, which may lead to exacerbated particle-induced cytotoxicity from dissolved Cu2+ ions or enhanced particle uptake. NCuO induced greater cytotoxicity when compared to nCuOCOOH in both healthy and asthmatic donor cells. Studies have shown that cell-binding events and internalization of nanoparticles are largely mediated by their surface chemistries (reviewed by Mu et al.(31)). Phospholipids, containing negatively charged phosphate groups, are the main components of pulmonary surfactant and cell membranes. The relatively lower apoptotic potential of the nCuOCOOH particles may be due (in part) to the fact that in an aqueous environment such as the surface of the respiratory epithelium deprotonation of the COOH functional group yields anionic nCuOCOO- nanoparticles with poor membrane binding efficiency (hence uptake). This line of reasoning is consistent with studies showing enhanced cytotoxicity of positively charged metal and metalloid nanoparticles relative to their neutral counterparts.32
Selected Pro-inflammatory Cytokines Are Elevated in a Dose-Dependent Manner
Being more than just a barrier, the airway epithelium synthesizes and releases potent immunomodulators like chemokines, cytokines, growth factors, and antimicrobial peptides in response to an external stimulant. These responses typify an intact defense response characteristic of human airway epithelia.33 Depending on the dose and type of material, ENM exposures typically trigger inflammation, marked by elevated levels of pro-inflammatory cytokines. Twenty-four hours after the nanoparticle exposures, we investigated changes in IL-6, IL-8, and MCP-1 since induction of these cytokines has been observed in bronchial epithelial cell cultures exposed to CuO and other metal oxide nanoparticles such as CeO2, TiO2, and ZnO.34−38 IL-8 was the most elevated of all three cytokines. Increased levels of IL-6 and IL-8 were measured in three healthy and five asthmatic donor cells (Suppl. Figure 1A). Release of IL-6 and IL-8 was dose dependent, being most significant (p-value < 0.0001) in donor cells exposed to the highest dose of nCuO nanoparticles. MCP-1 was found to be elevated (only in response to pristine nCuO nanoparticles) in two out of three and two out of five healthy and asthmatic donor cells, respectively (Suppl. Figure 1B). IL-6 is a pleiotropic cytokine with a wide range of biological activities in immune regulation, hematopoiesis, inflammation, and oncogenesis,39 while IL-8 and MCP-1 are neutrophil- and monocyte/basophil-attracting chemokines, respectively. Given that the maximum level of MCP-1 measured across all donor cells was 4- to 75-fold less than that of IL-6 and IL-8 respectively, assay detection limits coupled to technical variability might explain the observed inconsistency in MCP-1 induction. No significant difference in IL-6 and IL-8 secretion was observed between healthy and asthmatic donor cells (Figure 2A), even after normalizing cytokine release to percentage cell viability (data not shown). The expression trend of all three cytokines, as measured by microarray analysis was similar to secreted protein abundance (Figure 2B). Although macrophages are very often emphasized to be the first line of defense in pulmonary ENM-induced responses,40 release of IL-8 suggests that in the bronchial areas of the lungs, epithelial cells are the responsible cell type that play a role in triggering innate immunity responses and neutrophil influx into the lung tissue to uptake/internalize foreign particles. This is in line with the well-studied role of the respiratory epithelium in cytokine-mediated innate defense (reviewed in Whitsett and Alenghat41). In terms of the nanomaterial type, nCuO appears to be more bioreactive than nCuOCOOH, as the highest levels of all three pro-inflammatory cytokines were observed after nCuO exposure (Figure 2A,B).
Figure 2.

Cytokine profiling after nanoparticle exposures. Release of selected pro-inflammatory cytokines, previously associated with exposure to CuO nanoparticles, including their agglomerates/aggregates, was carried out after exposures (A). Twenty-four hours after exposures, a dose-dependent release of IL-6 and IL-8 was measured from cell culture medium. No clear dose-dependent pattern was observed for MCP-1 release. Overall, the expression trend across doses for each nanoparticle was similar between protein (released cytokines) and mRNA measured via microarray-based gene expression profiling (B). Statistical significance was inferred using two-way ANOVA. Transcript and protein levels of IL-6 and IL-8 progressively increase with dose, with the most significant differences observed between air-exposed and high dose-exposed donor cells in both asthmatic and healthy donor cells. A significant difference between asthmatic and healthy donor cells was only observed for IL-6 and IL-8 mRNA levels in cells exposed to the highest concentrations of nCuO. Degree of significance is represented by an *, where *, **, ***, and **** indicate p values <0.05, <0.01, <0.001, and <0.0001, respectively.
Transcriptomic Profiling of Control and Asthmatic Donor Bronchial Epithelia Identifies Known Asthma-Related Genes
Previous studies have reported similarities between the mRNA expression profiles of epithelial cells cultured at the air–liquid interface and that of tracheal and bronchial brushings from human airways.42,43 To validate the disease model in this study, we examined whether the relative expression of known asthma-associated genes, for the corresponding tissue type (bronchial epithelium), was consistent with the published literature. We identified genes related to asthma by microarray-based comparative transcriptomics on total RNA isolated from asthmatic and healthy donor cells that had only been exposed to control air. In addition, potential disease-modulating effects resulting from particle exposure were also investigated by analysis of differentially expressed genes (DEGs) in healthy versus asthmatic bronchial epithelial donor cells exposed at the air–liquid interface to CuO and CuOCOOH nanoparticle-derived aerosols. The ENM doses were selected such that cytotoxicity was less than 30% even with the highest dose. By this approach, gene expression profiling identifies early transcriptomic responses (biomarkers) that reflect the bioreactivity of CuO nanoparticles and not just genes that are related to general cell death.
Pathway analysis of genes identified as upregulated genes in asthmatic donor cells revealed a highly significant (FDR 1 × 10–22) enrichment of genes that are functionally involved in extracellular matrix organization (Figure 3A). The most upregulated of which are collagen (COL1AI, COL4A1, COL4A2, COL5A2 and COL7A1), TNC (tenascin C, a fibronectin binding protein), cadherin (CDH2, CDH4 and CDH11), MRC2 (mannose receptor C type 2), and MMP13 (Matrix Metallopeptidase13). The relative expression of these genes is in line with the increased expression of extracellular matrix proteins (fibronectin, MMP9, and MMP12) observed within the airway smooth muscle of asthma patients when compared to nonasthmatic controls.44 Araujo and colleagues44 also observed that deposition of type-I and type-III collagens correlated with the clinical severity of asthma. Asthma heterogeneity is widely acknowledged, with allergic asthma, mediated by allergen-specific T helper type 2 (TH2) cells, the most common and most studied form of asthma.45 Being that its hallmark mechanistic feature is the synthesis and release of the TH2 cytokines, IL-4, IL-5, and IL-13,46 it is no surprise that their expression levels were close to background in the studied airway epithelial cell models. However, we did detect significantly elevated expression of IL-33 and TSLP (known inducers of TH2-type proinflammatory mediators) in asthmatic donor cells (Suppl. Figure 2A). Similarly, elevated levels of IL-33 or TSLP, coupled with a concomitant correlation to disease severity, have been observed in bronchial biopsies and cultured bronchial epithelial cells derived from asthmatic patients.47−49 In terms of morphological changes, mucus accumulation (implicated in airway obstruction) is a prominent feature of asthma. Mucus hypersecretion, marked by an increase in the number of goblet cells and upregulation of mucin genes (notably MUC5AC and MUC5AB), as well as altered mucus clearance due to a decrease in the number of ciliated cells and/or cilia viability, are thought to both contribute to mucus accumulation in asthmatic airways. Incidentally, we identified modest but significant decrease in expression of FOXJ1 (marker of ciliated epithelial cells) and an increase in both MUC5AC (marker of goblet cells) and MUC5B in asthmatic donor cells (Suppl. Figure 2B). Several other mucin and mucin-like genes, MUC1, MUCL1, MUC2, MUC4, and MUC7, were also identified as significantly upregulated in MucilAir cells from asthmatic donors (Suppl. Figure 2C). A hierarchical cluster consisting of these upregulated mucin genes clearly separates asthmatic from control donor cells (Suppl. Figure 2D).
Figure 3.

Transcriptomic profiling of asthmatics versus healthy when exposed to air, nCuO, or nCuOCOOH. The gene expression of asthmatics was compared to that of healthy donor cells after exposure to control air and three doses of nanoparticle-derived aerosols. (A) The most upregulated genes in asthma air/healthy air consists of genes that represent a highly significant (FDR 1 × 10–22) functional enrichment of extracellular matrix organization. (B) Venn comparisons of differentially expressed genes (DEGs) identified in asthma/healthy exposed to air to the combined DEGs from asthma/healthy exposed to low-, mid-, and high-dose nCuO and low-, mid-, and high-dose nCuOCOOH reveal there is very little overlap across identified DEGs. This suggests there is a strong interaction between nanoparticle exposure and asthmatic phenotype. (C) K-means clustering of only the 164 DEGs between asthma and healthy exposed to air, across all exposures, separates air-exposed asthmatics and air-exposed healthy cells to the most distant clusters. Clusters of healthy donor cells exposed to control air are colored brown, and those for asthmatic donor cells exposed to control air are colored pink.
To answer whether particle exposure modulates the asthmatic genotype, we compared gene expression changes between asthmatic and healthy donor cells exposed to air or nanoparticle-derived aerosols. A Venn distribution of the topmost DEGs (fold change cutoff ≥1.5-fold and a Benjamini–Hochberg FDR of at most 5%) between healthy and asthmatic donor cells exposed to Air, nCuO, or nCuOCOOH is shown in Figure 3B. K-means clustering of all exposure groups, based only on the genes that were differentially expressed between asthmatic and healthy donor cells exposed to the control air stream, is depicted in Figure 3C. Within this dendrogram, the healthy and asthmatic groups occupy clusters that are farthest from each other. Conversely, if in addition to the genes that were different between asthmatics and healthy exposed to air those genes differing between asthmatic and healthy donor cells exposed to either nCuO or nCuOCOOH nanoparticle aerosols are included prior to hierarchical cluster generation, partitioning of the resulting cluster dendrogram then becomes based on exposure dose, with the asthmatic air and healthy air groups occupying closely related clusters (Suppl. Figure 3A,B).
In summary, when comparing air-exposed healthy and asthmatics, the main difference between all samples is driven by disease-related genes, and when the exposure to nanomaterials is considered, the main difference between samples is driven by the exposure dose. The top pathways enriched by the genes that are differentially expressed between asthmatics and healthy, when unexposed (air) or exposed to either nCuO or nCuOCOOH, are shown in Suppl. Figure 3C. An alteration from asthma-relevant pathways (extracellular matrix organization, FDR 1 × 10–22; collagen metabolic process, FDR 1 × 10–17; extracellular matrix part, FDR 3 × 10–16) to pathways associated with adverse effects of metal oxide nanomaterials (DNA damage response, FDR 1 × 10⁻⁶ to 1 × 10⁻²; response to metal ion, FDR 6 × 10–14 to 1 × 10⁻⁸; response to inorganic substance, FDR 2 × 10⁻⁷) is observed. Taken together, this indicates that in response to nanoparticle exposure, the effects of the disease (i.e., asthma) are overshadowed by the adverse exposure outcomes at the doses tested. From a mechanistic viewpoint, a notable limitation of the current study is that Mucilair asthmatic donor cells are obtained based only on symptomatic, as such given the limited number of asthmatic donors (N = 5), it is impossible to investigate particle exposure susceptibilities of different asthma subtypes.
Expression Profile of DEGs Incorporate Nanomaterial Dose, Functionalization and Asthma into the Dose–Response Axis
To characterize the gene expression profiles that represent adverse exposure to both nCuO and nCuOCOOH as a function of dose, functional group, and disease state, a total of 12 contrast sets for identification of DEGs were specified. The number of DEGs identified in each of the specified contrast sets (A–L) is shown in Suppl. Figure 4A. In total, 6523 DEGs were observed across all comparisons. The number of DEGs correlated with the dose (progressive increase in the number of DEGs from low dose to high dose). No obvious trend could be identified from the number of DEGs with respect to material type or disease state. However, the total number of DEGs from contrasts reflecting exposure to nanoparticles irrespective of disease state, or disease state exposures irrespective of the particle type, was similar for healthy and asthmatics, while an excess of 1627 DEGs was observed in nCuO relative to the nCuOCOOH exposures (Suppl. Figure 4B). This supports our previously mentioned observation that following exposure to CuO nanomaterials the difference between healthy and asthmatic cells is mainly driven by genes that are modulated in response to the nanomaterial exposure (Suppl. Figure 3C). On this basis, the main difference between asthmatic and healthy cells in response to nCuO/nCuOCOOH is more likely to be as a result of differences in sensitivity than being due to a different effect of these materials on asthmatic airways. However, a limitation of the current study protocol is that, in the absence of transcriptomic data over multiple time points, we cannot rule out the possibility that the enhanced sensitivity of the asthmatic epithelium derives from delayed (and not insufficient) self-regulation upon nanoparticle-induced irritation of the airways.
In order to visualize possible trends in the data arising from the expression profile of genes that significantly change in response to CuO and CuOCOOH exposure, we performed a principal component analysis (PCA) that was based exclusively on the 6523 genes that were significantly differentially expressed between exposed cells and their corresponding air controls. The top two principal components, explaining about 65% of the variation, are shown in Figure 4A. The different dose groups (air, low, mid and high) in the PCA plot are highlighted with distinct colors and oval shapes (legend). Interestingly there are regions of overlap between adjacent doses (low/mid, mid/high) wherein asthmatic cells exposed to nCuO from the lower dose are overrepresented. For example, in the overlap between low and mid doses, low nCuO-asthmatic cells cluster closer to the mid dose exposures than the other three [(1) nCuO-healthy, (2) nCuOCOOH-healthy, and (3) nCuOCOOH-asthmatic] low dose groups. The same holds true for the mid/high intersection. This is an indication that the presence of asthma enhances the sensitivity to the adverse effects of nCuO exposure, and this sensitivity is diminished by functionalization to a COOH group (nCuOCOOH). This observation is in line with cytotoxicity measurements in healthy and asthmatic cells after nCuO and nCuOCOOH exposures (Figure 1D). We also observed that the genes which are differentially expressed between asthmatic and healthy donor cells exposed to only to control air were differentially expressed between nanoparticle-exposed and air-exposed healthy and asthmatic donor cells (Figure 4B), meaning that the genes which reflect the asthmatic genotype in this cohort are also involved in the response to nanoparticle exposure. This could explain why the asthma versus healthy gene expression profiles were so different for donor cells exposed to either air or aggregates/agglomerates of nCuO or nCuOCOOH nanoparticles (Figure 3A). It is possible that asthmatics are more susceptible to nanoparticle exposure because the expression of some of the genes required to mount a (possibly protective) response to nanoparticle exposure is skewed in asthmatics, resulting in a delayed onset of the mechanisms required to protect against the adverse effects caused by these particles.
Figure 4.

Global differential expressed genes and genes related to regulation of cell death differentiate exposures according to dose, material type, and disease state. In total, 6523 differentially expressed genes (DEGs) were identified when exposed healthy [H] and asthmatic [A] cells were compared to their corresponding air-exposure controls. These genes were then obtained from the normalized expression matrix and used for principal component analysis (PCA). The top two components, explaining about 65% of the variance between exposures, are shown in (A). Colored ovals with dashed lines depict the different doses from air (zero) to high dose (A, left to right). Circular symbols represent healthy donors and triangles represent asthmatic donors. It can be seen from PCA that asthmatic donor cells exposed to the relatively lower dose are overrepresented in the regions where the low, mid and high doses overlap. This indicates interaction between disease and nanoparticle exposure and is further highlighted by the fact that all of the genes that are differentially expressed between baseline asthmatics and healthy donor cells were also differentially expressed in response to nanoparticle exposure (B). Approximately 9% (567 genes) of the DEGs between exposed and unexposed donor cells were identified by pathway enrichment analysis to represent GO biological processes corresponding to positive and negative regulation of cell death. Venn distribution of these nanoparticle/air DEGs related to cell death is shown in (C). K-means clustering, exclusively based on these cell death related genes, differentiates and groups the samples according to dose, surface chemistry, and disease state (D). The primary distribution of samples across the various branches of the dendrogram can be attributed to the nanoparticle deposited dose, wherein all high-dose exposures were grouped together in branch 1, air-exposed controls in branch 2A, and mid dose in branch 2B (D). All low-dose exposures are closest to the air-exposed controls in branch 2A, except nCuO-low dose (asthmatics), which clustered with the mid doses (branch 2B), and all mid doses clustered in branch 2A except nCuO-mid (asthmatics), which clustered in branch 1 with the high doses.
Expression of Genes Involved in Regulation of Cell Death Correlates with Cellular Cytotoxicity Assay
Because the dose–response differentiation was similar for both the cytotoxicity assay and expression profile of all DEGs, we next investigated whether this distinction is consistent for a subset of DEGs that represent changes in cell viability. To this end, we performed gene ontology (GO) based biological process enrichment analysis using all 6523 DEGs as input list. We used this global approach as opposed to biological process enrichment analysis for each of the contrast sets depicted in Suppl. Figure 4A because the expression profile of the combined DEGs correlated better with dose, functional group, and disease state than the number of DEGs for every contrast. The top five enriched nonredundant GO terms were regulation of cell death (GO:0010941), cilium organization (GO:0044782), response to cytokine (GO:0034097), cell projection assembly (GO:0030031), cilium assembly (GO:0060271), and cellular response to cytokine stimulus (GO:0071345). Adverse exposure to CuO nanoparticles is known to affect cell viability via oxidative stress, prolonged inflammation, and DNA damage.50 From the list of enriched biological processes represented by these 6523 DEGs (Suppl. Table 1), we selected two biological processes representing specific effects on cell death–positive (GO: 0060548–383 genes) and negative (GO:0010942–271 genes) regulation of cell death (Figure 4C and highlighted in Suppl. Table 2). In very much the same way as cell cytotoxicity measurements (Figure 1D), hierarchical clustering based solely on the expression of these regulation of cell death genes differentiates the exposures by dose (Figure 4D). Here, the enhanced sensitivity of asthmatic airways is evident as, asthmatic cells exposed to low and mid dose nanoparticles cluster closest to control cells exposed to mid- and high-dose nanoparticles, respectively. The three most distinct clusters are depicted in the dendrogram as 1, 2A, and 2B (Figure 4C). Cluster 1 consists of all high-dose exposures as well as mid-dose nCuO (asthmatic), cluster 2B consists of the remaining mid-dose exposures and low-dose nCuO (asthmatic). and cluster 2A consists of the remaining low-dose exposures and unexposed controls.
Changes in Genes Related to Cilium Functionality Highlight the Lower Potency of COOH-Functionalized CuO Nanoparticles and also Suggest Defective Mucociliary Clearance May Be Responsible for Enhanced Nanoparticle Sensitivity in Asthmatic Donor Cells
Dysfunction of cilia organization is the second most enriched pathway represented by genes that were differentially expressed in response to nCuO/nCuOCOOH exposure (Suppl. Table 2). Cilium assembly and cell projection assembly are also related pathways that are highly enriched by combined DEGs between nanoparticle-exposed and air-exposed donor cells (Figure 5A). Similar to the human airway, the MucilAir epithelial lining is covered by a mucus layer, which is produced by goblet cells and moved by ciliary beating. As a first line of defense, particles trapped within the mucus layer are cleared by highly coordinated ciliary beating, known as mucociliary clearance.51,52 Because cilium assembly and organization are key processes involved in mucociliary clearance, and ciliary dysfunction is a feature of moderate to severe asthma,53 we next sought to answer whether the observed enhanced CuO nanoparticles sensitivity in asthmatics compared to healthy subjects, could be related to intrinsic differences in ciliary function. To compare the relative expression of genes related to cilium organization between any two samples, the expression of 186 DEGs representing cilium organization (GO: 0044782) across all individual samples were Z-score normalized, separately for each nanomaterial. This normalization enables us to derive the expression of each gene relative to the entire population. Z-scores of each gene are then averaged over biological replicates. Scatter plots of the average relative expression of these genes between healthy versus asthmatic cells exposed to control air and between exposed versus unexposed cells are shown in Figure 5B,C.
Figure 5.

Scatter plot of genes related to organization of the cilia 186 differentially expressed genes were identified by pathway analysis to represent biological functions corresponding to cilia organization/cilia assembly (A). Average relative expression for each of these genes were obtained by Z-score normalization of their mRNA intensity values across all samples for the nCuO and nCuOCOOH exposures. Z-scores were then averaged for air, low, mid, and high nanoparticle doses. A scatter plot of air-exposed healthy versus asthmatic donor cells is shown in (B). As an example of a pre-existing distinction between healthy and asthmatic airways, MCIDAS and RAB3IP genes with potential relevance in the functionality of asthmatic airways are highlighted. Following exposure to nCuO (C, upper panel) or nCuOCOOH (C, lower panel) nanoparticles/nanoparticle agglomerates, a bigger change in expression (green lines) of cilia-related genes can be observed in healthy when compared to asthmatic donor cells. Furthermore, the low-dose response was distinct in all exposures, except in asthmatics exposed to nCuO (dashed red circles), wherein the low-dose response overlaps with the mid- and high-dose responses.
The first observation made is that there is a positive correlation (Pearson correlation coefficient, R = 0.64) in cilia organization genes between healthy/asthmatic cells exposed to control air (Figure 6B). Interestingly, two genes that were found to be very different in average relative expression between healthy and asthmatic donor cells, MCIDAS and RAB3IP (Figure 5B), functionally reflect differences between healthy and asthmatic phenotype. RAB3IP, low expressed in asthmatic donor cells, may be of relevance in extracellular matrix remodeling due to its role as a modulator of actin organization (www.genecards.org). Meanwhile, MCIDAS, which is highly upregulated in healthy donor cells, is required for the generation of multiciliated cells in respiratory epithelium. Patients with genetic deficiencies in MCIDAS suffer from recurrent upper and lower respiratory tract infections due to reduced generation of multiple motile cilia.54 Second, we observe that, low dose exposure to either nCuO and nCuOCOOH, triggers an upregulation in the expression of cilia-related genes, except in nCuO-exposed asthmatic donor cells (Figure 5C, red circles). Upon exposure to mid and high dose nanoparticles, the initial upregulation is closely followed by downregulation. Downregulation of cilia-related genes was clearly distinct between mid and high dose in nCuOCOOH-exposed cells. An overlap of the mid/high response was observed in nCuO-exposed healthy donor cells while in nCuO-exposed asthmatic donor cells, the low/mid/high response overlap. Taken together, we propose that mucociliary clearance is activated as an initial protective response via upregulation of genes involved in cilia organization. However, an excessive airway activation–that is tightly coupled to nanomaterial potency (greater dose–response overlap in nCuO relative to nCuO COOH) and asthma phenotype (greater dose–response overlap in asthmatic cells relative to healthy cells) triggers a negative feedback mechanism leading to downregulation of cilia-related genes. The final observation made is that, the expression scatter of cilia-related genes is greatest in exposed healthy donor cells (Figure 5C, green lines). That is, the extent of variation in expression of cilia-related genes following nanoparticle exposure is higher in healthy cells. This suggests that mucociliary clearance may be less effective in asthmatic airways due to an overall lower net change in expression (decreased plasticity) of the genes that are required for cilia (re)assembly and/or (re)organization (Figure 5C).
Figure 6.

Shared DEGs highlight core molecular signature of nanosized CuO exposure and integrates all four tested parameters into a dose–response gradient. Comparing nanoparticle-exposed healthy or asthmatic donor cells to their corresponding air-exposed controls resulted in a total of 12 contrast sets. Forty-eight differentially expressed genes were identified to be shared between 9 or more of these contrasts sets; i.e., 33 genes were shared across 9 contrasts, 12 genes in 10 contrasts, and 3 genes in 11 contrasts. A hierarchical cluster (upper panel) based on these reoccurring 48 differentially expressed genes separates all groups along a dose–response gradient, which takes into account the material surface chemistry and tissue health status. Response to transition metal nanoparticle, attributed to a subset of five metallothionein 1 genes, was identified as a highly enriched (FDR 9 × 10–13) biological process within these 48 shared DEGs. Connections between gene nodes represent physical, predicted, and genetic interactions as well as shared protein domains and pathways.
A Subset of Highly Overlapping DEGs Represents a Core Signature Response to CuO Nanoparticles
For each nanoparticle subtype, when DEGs for each dose are combined, only 31% of the DEGs were common between nCuO- and nCuOCOOH-exposed healthy donor cells. Forty-four percent of the DEGs were common between asthmatic donor cells exposed to nCuO or nCuOCOOH nanoparticle aerosols. Based on their distinct gene expression profiles, these differentially functionalized nanoparticles behave like two different metal nanoparticles. However, from a health hazard diagnostic perspective, it is essential to have a minimum set of DEGs that recapitulate organ-level sensitivity to disease. As such, we next asked whether there is a subset of DEGs whose expression profiles can distinguish the nanoparticle (sub)type, exposure dose and enhanced airway sensitivity as a result of asthma. For this purpose, we performed comprehensive Venn comparisons across all 12 exposed/unexposed contrasts (i.e., without combining DEGs from multiple doses). Using DEGs present in at least 75% of the exposed/unexposed comparisons (that is, nine or more contrasts) as cut-off, a group of 48 genes are identified (Figure 6). A cluster dendrogram of these genes, aligns nanoparticle type and disease state along the dose–response axis in a very similar manner to general transcriptome profiles, cell death related genes and LDH assay. Response to transition metal nanoparticle (FDR of 8 × 10–13) was identified as a highly enriched pathway in this gene subset. This pathway was enriched by a subset of type 1 metallothionein (MT1) genes, which are metal-binding proteins long known to be involved in metal homeostasis and detoxification in plants and animals,55 and more recently have been identified to be highly deregulated in response to metal-based nanoparticles.56−58 These 48 genes are outlined in Table 1.
Table 1. List of Highly Overlapping Differentially Expressed Genes from Nanoparticle-Exposed/Air-Exposed Contrasts.
| avg log2 difference | gene symbol | Entrez Gene name |
|---|---|---|
| 5.00 | MT1G | metallothionein 1G |
| 4.81 | MT1H | metallothionein 1H |
| 4.80 | IL6 | interleukin 6 |
| 4.57 | MT1M | metallothionein 1M |
| 3.83 | HSPA6 | heat shock protein family A (Hsp70) member 6 |
| 3.56 | MT1F | metallothionein 1F |
| 3.47 | C11orf96 | chromosome 11 open reading frame 96 |
| 3.22 | SNHG12 | small nucleolar RNA host gene 12 |
| 2.85 | MT1E | metallothionein 1E |
| 2.64 | GADD45B | growth arrest and DNA damage inducible beta |
| 1.87 | SNHG15 | small nucleolar RNA host gene 15 |
| 1.81 | IFRD1 | interferon related developmental regulator 1 |
| 1.77 | DDIT3 | DNA damage inducible transcript 3 |
| 1.71 | SNHG1 | small nucleolar RNA host gene 1 |
| 1.67 | ODC1 | ornithine decarboxylase 1 |
| 1.63 | KLF10 | Kruppel like factor 10 |
| 1.62 | ATF3 | activating transcription factor 3 |
| 1.59 | RGS2 | regulator of G protein signaling 2 |
| 1.58 | JUN | Jun proto-oncogene, AP-1 transcription factor subunit |
| 1.50 | SNAR-A3 | small ILF3/NF90-associated RNA A3 |
| 1.49 | FOSL1 | FOS like 1, AP-1 transcription factor subunit |
| 1.44 | NOP16 | NOP16 nucleolar protein |
| 1.43 | IER2 | immediate early response 2 |
| 1.41 | DDX21 | DExD-box helicase 21 |
| 1.39 | AGPAT9 | glycerol-3-phosphate acyltransferase 3 |
| 1.24 | USP36 | ubiquitin specific peptidase 36 |
| 1.18 | NOP56 | NOP56 ribonucleoprotein |
| 1.16 | ZFP36 | ZFP36 ring finger protein |
| 1.13 | SLC30A1 | solute carrier family 30 member 1 |
| 1.09 | IRS2 | insulin receptor substrate 2 |
| 1.07 | NOP58 | NOP58 ribonucleoprotein |
| 1.02 | RRS1 | ribosome biogenesis regulator homologue |
| 1.01 | ORAOV1 | oral cancer overexpressed 1 |
| 1.01 | WDR43 | WD repeat domain 43 |
| 1.00 | NOP2 | NOP2 nucleolar protein |
| 0.94 | NIFK | nucleolar protein interacting with the FHA domain of MKI67 |
| 0.90 | RPF2 | ribosome production factor 2 homologue |
| 0.90 | PIM3 | Pim-3 proto-oncogene, serine/threonine kinase |
| 0.90 | WSB1 | WD repeat and SOCS box containing 1 |
| 0.88 | RBM3 | RNA binding motif protein 3 |
| 0.88 | DUSP1 | dual specificity phosphatase 1 |
| 0.86 | GNL3 | G protein nucleolar 3 |
| 0.83 | EIF3J | eukaryotic translation initiation factor 3 subunit J |
| 0.82 | MAK16 | MAK16 homologue |
| –0.89 | ANKRD9 | ankyrin repeat domain 9 |
| –1.01 | LRRC20 | leucine rich repeat containing 20 |
| –1.14 | PIP5KL1 | phosphatidylinositol-4-phosphate 5-kinase like 1 |
| –1.43 | HILPDA | hypoxia inducible lipid droplet associated |
| existing biomarker application(s) (Ingenuity Knowledgebase) |
Conclusion
Realistic human-relevant in vitro models, combined with focused in silico approaches, have the potential to more reliably connect nanomaterial properties of concern to their health hazards. A more complete understanding of how nanomaterials can influence disease at the cellular and molecular level will enable the incorporation of important population and exposure susceptibilities into models. Here, via extensive comparative analysis of 3D human bronchial epithelial model (MucilAir) exposed to air or CuO-based aerosols, we show that existence of asthma enhances sensitivity of the airways to nanoparticle aerosols, possibly as a combined result of a hyperactive airway and inefficient mucociliary clearance mechanisms in asthmatics. The observed enhanced susceptibility to nanoparticle aerosols is of added relevance considering that asthmatic airway constriction could not even be replicated in this air–liquid interface model. Our data highlights the relevance of employing a generally applicable air–liquid interface exposure system,20 in tandem with extensive transcriptomic characterization for health hazard assessment. By focusing on highly overlapping differentially expressed genes, we have also presented a concise list of candidate biomarkers to adverse nCuO exposure, which by themselves were able to incorporate particle surface chemistry and pre-existing asthma into the dose–response gradient. This “core signature”, which may be a combination of genes that represent tissue defense and detoxification mechanisms and those involved in progression of adverse exposure outcomes, can be used for human biomonitoring and surveillance.
Materials and Methods
Experimental Equipment
A schematic of the exposure setup is shown in Figure 1. The equipment consists of an aerosol generator, an air–liquid interface exposure system, and the MucilAir 3D human bronchial epithelial model. See the work of Kooter et al.(10) for a comprehensive description of the equipment. Details specific to the current experimental setup are previously described,10,20 with a few modifications that are outlined below.
Experimental Design
The experimental assessment involved exposures to clean, humidified air, low, middle, and high concentrations of CuO and CuOCOOH. Cell material for the exposures originated from five asthmatic and three healthy donors. The exposures were split up as 1 h sessions, each consisting of a test block containing three inserts. Parallel exposure sessions were carried out to assess, cytotoxicity, cytokine release, and RNA isolation for microarray-based transcriptomics. Each Vitrocell consists of three slots (inserts); thus, every time a test block is exposed, the cell material within its three inserts originates from a single donor only. There were in total three healthy and five asthmatic donors, and the cell material of each donor was tested once in each session, once in each test block, and once at each CuO/CuOCOOH concentration.
Aerosol Generation
The test atmosphere was generated by aerosolizing nano-CuO and nano-CuOCOOH, 10–20 nm primary particle size (average primary particle size, nm ca. 15; BET, m2/g 55 ± 5, provided by NANOSOLUTIONS consortium). An air control, a low-concentration, a mid-concentration, and a high-concentration flow were realized simultaneously. The test atmosphere for the high-dose group was extracted from the buffer chamber using a mass flow controller (Bronkhorst Hi Tec B.V.) connected to a vacuum source. The test atmospheres for the mid- and low-dose groups were diluted using an AirVac eductor (AirVac Engineering Company). The incubator temperature was set to 37 °C, and relative humidity was controlled at 50% for each group with a Testo RH/T device (Testo 635; Testo GmbH & Co).
Real-Life Exposure Dose Extrapolation
The Vitrocell system consists of a module that supports several inserts with adaptable well sizes. Based on the current configuration, the total area of an exposed insert is 0.3 cm2, the dose/area is given as particle concentration in air (mg/m3) × deposition rate × volume of air in chamber (dm3) ÷ insert surface area (cm2).10 The Vitrocell setup, aerosol flow rates, and exposure time are as previously described.10 Thus, for a 14–15% nanoparticle deposition rate, the effective dose per Vitrocell insert for the low nCuOCOOH dose is 32 mg/m3 × 0.14 × 0.09 dm3÷ 0.3 cm2 = 1.344 μg/cm2 (0.09 dm3 = 0.09 × 10⁻³ m3). For the purpose of simplicity, we provide real-life exposure estimates that are based on the average of the low, mid, and high doses of nCuO and nCuOCOOH nanoparticles combined. Due to the fact that this MucilAir air–liquid interface model replicates the conducting airways, the objective of the extrapolated dose is to mimic real-life exposure of human bronchial airways. In this region of the respiratory airways the modeled and measured deposition rate of aerosols having an aerodynamic diameter of 1–2 μm is estimated to be about 14%. The measured MMAD of aerosolized nCuOCOOH and nCuO particles in the buffer chamber (high dose) was 1.8 μm (geometric SD = 1.57) and 1.4 μm (geometric SD = 1.48), respectively. In the absence of comprehensive real-life exposure measurements, we extrapolated the in vitro exposures to a time-weighted permissible exposure limit in an occupational setting (see the Results and Discussion).
MucilAir3D Human Bronchial Epithelial Model
MucilAir fully differentiated bronchial epithelial models (Epithelix Sárl, Geneva, Switzerland), reconstituted from primary human cells of healthy or asthmatic donors, were used for air–liquid exposure to CuO and CuOCOOH. The cells were maintained on 24-well Transwell culture supports at an air–liquid interface using MucilAir culture medium, supplemented with 1% amphotericin and 0.5% gentamicin, in a humidified incubator at 37 °C with 5% CO2. Prior to performing the experiments, the MucilAir cells were stabilized in culture for at least 1 week, while the medium was refreshed every 2–3 days. The basolateral culture medium was refreshed approximately 24 h before exposure. The MucilAir cells were rinsed with saline solution (0.9% NaCl, 1.25 mM CaCl2, and 10 mM HEPES buffer) approximately 24 h before and again just before exposure to ensure that each individual model contained a mucus layer of comparable thickness. Right before exposure, the insets were transferred to the exposure device. The stainless-steel wells of the exposure device contained MucilAir culture medium to feed the cell monolayer from the basal side during a 1 h exposure. The duration of the exposure is based on our experience with this model.10 Cells were stabilized for another 24 h with 0.7 mL of MucilAir culture medium at the basal site in a humidified incubator (ca. 37 °C, 5% CO2) after exposures. Cell cultures were visually inspected under the microscope before and after exposures to examine their status. The lower relative humidity of 50% during the exposures compared to the in vivo situation is not affecting the cell model. Negative controls (nonexposed in the humidified incubator, > 90%RH) and air exposed controls show both similar (absence of) cytotoxicity (figure1D), where particle exposed cells show a dose response. Other studies by authors show that even exposure up to 6 h is feasible using this setup.59,60
Cellular Effects
LDH-based cytotoxicity assessment (LDH-assay kit Roche, Mannheim, Germany), pro-inflammatory signaling (multiple analyses of cytokine (MCP-1, IL-6 and IL-8) release - human inflammation 20plex FlowCytomix Multiplex, Ebiosciences) and microarray-based global transcriptome profiling, were performed on MucilAir cells that had been cultured for 24 h post-nanoparticle exposure. The above-mentioned cytokines were chosen because they were previously identified as upregulated in vitro following exposure to nanoparticles (CeO2,10,37 CuO20) in our laboratory. Samples for analysis were taken from the basolateral medium only. For direct comparison with mRNA expression measured from microarray analysis, cytokine levels were log2 transformed. Error bars are mean and standard deviation of three to five replicates, unless otherwise specified. Two-way ANOVA (adjusted for multiple comparisons with Tukey’s test) were performed for identification of statistically significant differences in cellular cytotoxicity or cytokine release.
DNA Microarrays
Total RNA was isolated from cell lysates with RNeasy Plus Mini Kit according to manufacturer’s instructions (Qiagen, GmbH, Hilden, Germany). Desalting of the samples was required and thus, additional purification was performed by ethanol precipitation with 3 M sodium acetate (Thermo Fisher Scientific Inc., Wilmington, NC).61 Quantity and quality of the RNA samples were assessed by NanoDrop and Agilent Bioanalyzer 2100 (Agilent Technologies, Santa Clara, CA), respectively. All samples passed the quality threshold of RNA integrity number (RIN) > 8 and were included in the DNA microarray analysis.
One hundred nanograms of each independent RNA sample was used to synthesize cRNA with T7 RNA polymerase amplification method (Low Input Quick Amp Labeling Kit, Agilent Technologies). cRNAs were labeled with Cy3 and Cy5 dyes (Agilent Technologies) and thereafter purified by using RNeasy Mini spin columns (Qiagen, GmbH, Hilden, Germany). three hundred nanograms of a Cy3-labeled sample and a Cy5-labeled sample were combined (total 600 ng), fragmented, and hybridized to the Agilent 2-color 60-mer oligo arrays for 17 h at 65 °C (Agilent SurePrint G3 Human Gene Expression v3 GE 8 × 60K). The slides were washed and scanned with Agilent Microarray Scanner G2505C (Agilent Technologies). Raw intensity values were obtained with the Feature Extraction software, version 11.0.1.1 (Agilent Technologies).
All microarray data associated with this publication have been deposited in NCBI’s Gene Expression Omnibus database62 and are accessible via GEO series accession number GSE127773 (https://www.ncbi.nlm.nih.gov/geo/query/acc.cgi?acc=GSE127773).
Data Preprocessing and Differential Expression Analyses
Processing of raw files and differential expression analysis were carried out with eUTOPIA,63 a platform-independent graphical user interface based on R, with comprehensive workflows for gene expression analysis. After importing raw files, signal intensity and background corrections were performed by quantile normalization. Batch effects due to dye and array were accounted for during differential expression analysis by fitting the expression of each gene to a linear model (Limma64,65), with the exposures specified as the “variable of interest”. A Benjamini–Hochberg FDR of at most 5% and abs log2 difference ≥ 0.58 were the specified cut-offs to consider a gene as significantly different between any two contrasts.
Hierarchical Clustering
Hierarchical clustering was carried out with Perseus.66 Clustering parameters used were as follows; Distance: Euclidean, Linkage: Average and Cluster Preprocessing: K-means. To improve the differentiation accuracy and relevance of the generated clusters, hierarchical clustering analyses was always performed on a specified set of differentially expressed genes. The data matrix for cluster generation was quantile-normalized, and batch effects due to dye and array were adjusted with the ComBat(67) algorithm implemented in eUTOPIA.
Gene Set Functional Enrichment Analysis
Gene ontology (release date 2018-04-04) based identification of overrepresented biological processes were carried out using PANTHER68 enrichment analysis tool. Scoring of significantly enriched biological pathways was done by multiplying the fold enrichment by the −log of the false discovery rate. Biological processes with a < 1.5-fold enrichment and FDR ≥ 0.001 were excluded. Alternatively, identification and visualization of biological networks from predicted enriched gene functions were done using the web-based GeneMANIA prediction server.69
Acknowledgments
The work leading to these results received funding from the European Commission’s Seventh Framework Programme (FP7/2007-2013) under Grant Agreement No. 309329 (NANOSOLUTIONS). The authors are also thankful to Prof. Petri Auvinen for kindly letting us perform the microarray experiments in his laboratory.
Supporting Information Available
The Supporting Information is available free of charge on the ACS Publications website at DOI: 10.1021/acsnano.9b01823.
List of differentially expressed genes identified from all exposed versus unexposed tissue comparisons (XLSX)
Top most pathways represented by differential expressed genes (XLSX)
Figures of cytokine release from each donor tissue after nanoparticle exposure; relative expression of asthma-associated genes; expression of mucins showing increased presence of goblet cells in asthmatic bronchial airway; transcriptomic comparisons of healthy versus asthmatic donor tissues before and after exposure to nanoparticle-derived aerosols; group design for analysis of differentially expressed genes (PDF)
Author Contributions
∇ M.I. and M.G.-M. contributed equally.
The authors declare no competing financial interest.
Supplementary Material
References
- Gauvreau G. M.; El-Gammal A. I.; O’Byrne P. M. Allergen-Induced Airway Responses. Eur. Respir. J. 2015, 46, 819–831. 10.1183/13993003.00536-2015. [DOI] [PubMed] [Google Scholar]
- Malo J. L.; Chan-Yeung M. Agents Causing Occupational Asthma. J. Allergy Clin. Immunol. 2009, 123, 545–550. 10.1016/j.jaci.2008.09.010. [DOI] [PubMed] [Google Scholar]
- Donaldson K.; Stone V.; Gilmour P. S.; Brown D. M.; Macnee W. Ultrafine Particles: Mechanisms of Lung Injury. Philos. Trans. R. Soc. A Math. Phys. Eng. Sci. 2000, 358, 2741–2749. 10.1098/rsta.2000.0681. [DOI] [Google Scholar]
- Li N.; Hao M.; Phalen R. F.; Hinds W. C.; Nel A. E. Particulate Air Pollutants and Asthma: A Paradigm for the Role of Oxidative Stress in PM-Induced Adverse Health Effects. Clin. Immunol. 2003, 109, 250–265. 10.1016/j.clim.2003.08.006. [DOI] [PubMed] [Google Scholar]
- Guarnieri M.; Balmes J. R.; Francisco S. Outdoor Air Pollution and Asthma. Lancet 2014, 383, 1581–1592. 10.1016/S0140-6736(14)60617-6. [DOI] [PMC free article] [PubMed] [Google Scholar]
- Krug H. F. Nanosafety Research-Are We on the Right Track?. Angew. Chem., Int. Ed. 2014, 53, 12304–12319. 10.1002/anie.201403367. [DOI] [PubMed] [Google Scholar]
- Braakhuis H. M.; Park M. V. D. Z.; Gosens I.; De Jong W. H.; Cassee F. R. Physicochemical Characteristics of Nanomaterials That Affect Pulmonary Inflammation. Part. Fibre Toxicol. 2014, 11, 1–25. 10.1186/1743-8977-11-18. [DOI] [PMC free article] [PubMed] [Google Scholar]
- Bakand S. Cell Culture Techniques Essential for Toxicity Testing of Inhaled Materials and Nanomaterials In Vitro. J. Tissue Sci. Eng. 2016, 07, 3–7. 10.4172/2157-7552.1000181. [DOI] [Google Scholar]
- Hiemstra P. S.; Grootaers G.; van der Does A. M.; Krul C. A. M.; Kooter I. M. Human Lung Epithelial Cell Cultures for Analysis of Inhaled Toxicants: Lessons Learned and Future Directions. Toxicol. In Vitro 2018, 47, 137–146. 10.1016/j.tiv.2017.11.005. [DOI] [PubMed] [Google Scholar]
- Kooter I. M.; Gröllers-Mulderij M.; Steenhof M.; Duistermaat E.; van Acker F. A. A.; Staal Y. C. M.; Tromp P. C.; Schoen E.; Kuper C. F.; van Someren E. Cellular Effects in an In Vitro Human 3D Cellular Airway Model and A549/BEAS-2B In Vitro Cell Cultures Following Air Exposure to Cerium Oxide Particles at an Air–Liquid Interface. Appl. Vitr. Toxicol. 2016, 2, 56–66. 10.1089/aivt.2015.0030. [DOI] [Google Scholar]
- Latvala S.; Hedberg J.; Möller L.; Odnevall Wallinder I.; Karlsson H. L.; Elihn K. Optimization of an Air–Liquid Interface Exposure System for Assessing Toxicity of Airborne Nanoparticles. J. Appl. Toxicol. 2016, 36, 1294–1301. 10.1002/jat.3304. [DOI] [PMC free article] [PubMed] [Google Scholar]
- Mülhopt S.; Dilger M.; Diabaté S.; Schlager C.; Krebs T.; Zimmermann R.; Buters J.; Oeder S.; Wäscher T.; Weiss C.; Paur H. R. Toxicity Testing of Combustion Aerosols at the Air-Liquid Interface with a Self-Contained and Easy-to-Use Exposure System. J. Aerosol Sci. 2016, 96, 38–55. 10.1016/j.jaerosci.2016.02.005. [DOI] [Google Scholar]
- Loret T.; Peyret E.; Dubreuil M.; Aguerre-Chariol O.; Bressot C.; le Bihan O.; Amodeo T.; Trouiller B.; Braun A.; Egles C.; Lacroix G. Air-Liquid Interface Exposure to Aerosols of Poorly Soluble Nanomaterials Induces Different Biological Activation Levels Compared to Exposure to Suspensions. Part. Fibre Toxicol. 2016, 13, 1–21. 10.1186/s12989-016-0171-3. [DOI] [PMC free article] [PubMed] [Google Scholar]
- Geiser M.; Jeannet N.; Fierz M.; Burtscher H. Evaluating Adverse Effects of Inhaled Nanoparticles by Realistic In Vitro Technology. Nanomaterials 2017, 7, 49. 10.3390/nano7020049. [DOI] [PMC free article] [PubMed] [Google Scholar]
- Honarvar Z.; Hadian Z.; Mashayekh M. Nanocomposites in Food Packaging Applications and Their Risk Assessment for Health. Electron. physician 2016, 8, 2531–2538. 10.19082/2531. [DOI] [PMC free article] [PubMed] [Google Scholar]
- Das S.; Baker A. B. Biomaterials and Nanotherapeutics for Enhancing Skin Wound Healing. Front. Bioeng. Biotechnol. 2016, 4, 1–20. 10.3389/fbioe.2016.00082. [DOI] [PMC free article] [PubMed] [Google Scholar]
- Gabbay J.; Borkow G.; Mishal J.; Magen E.; Zatcoff R.; Shemer-Avni Y. Copper Oxide Impregnated Textiles with Potent Biocidal Activities. J. Ind. Text. 2006, 35, 323–335. 10.1177/1528083706060785. [DOI] [Google Scholar]
- Su Y.; Zheng X.; Chen Y.; Li M.; Liu K. Alteration of Intracellular Protein Expressions as a Key Mechanism of the Deterioration of Bacterial Denitrification Caused by Copper Oxide Nanoparticles. Sci. Rep. 2015, 5, 1–11. 10.1038/srep15824. [DOI] [PMC free article] [PubMed] [Google Scholar]
- Meldrum K.; Guo C.; Marczylo E. L.; Gant T. W.; Smith R.; Leonard M. O. Mechanistic Insight into the Impact of Nanomaterials on Asthma and Allergic Airway Disease. Part. Fibre Toxicol. 2017, 14, 1–35. 10.1186/s12989-017-0228-y. [DOI] [PMC free article] [PubMed] [Google Scholar]
- Kooter I. M.; Gröllers-Mulderij M.; Duistermaat E.; Kuper F.; Schoen E. D. Factors of Concern in a Human 3D Cellular Airway Model Exposed to Aerosols of Nanoparticles. Toxicol. In Vitro 2017, 44, 339–348. 10.1016/j.tiv.2017.07.006. [DOI] [PubMed] [Google Scholar]
- Ma-Hock L.; Gamer A. O.; Landsiedel R.; Leibold E.; Frechen T.; Sens B.; Linsenbuehler M.; van Ravenzwaay B. Generation and Characterization of Test Atmospheres with Nanomaterials. Inhalation Toxicol. 2007, 19, 833–848. 10.1080/08958370701479190. [DOI] [PubMed] [Google Scholar]
- Curwin B.; Bertke S. Exposure Characterization of Metal Oxide Nanoparticles in the Workplace. J. Occup. Environ. Hyg. 2011, 8, 580–587. 10.1080/15459624.2011.613348. [DOI] [PubMed] [Google Scholar]
- Darquenne C. Aerosol Deposition in Health and Disease. J. Aerosol Med. Pulm. Drug Delivery 2012, 25, 140–147. 10.1089/jamp.2011.0916. [DOI] [PMC free article] [PubMed] [Google Scholar]
- Hofmann W. Modelling Inhaled Particle Deposition in the Human Lung-A Review. J. Aerosol Sci. 2011, 42, 693–724. 10.1016/j.jaerosci.2011.05.007. [DOI] [Google Scholar]
- Cheng Y. S. Mechanisms of Pharmaceutical Aerosol Deposition in the Respiratory Tract. AAPS PharmSciTech 2014, 15, 630–640. 10.1208/s12249-014-0092-0. [DOI] [PMC free article] [PubMed] [Google Scholar]
- Fröhlich E.; Mercuri A.; Wu S.; Salar-Behzadi S. Measurements of Deposition, Lung Surface Area and Lung Fluid for Simulation of Inhaled Compounds. Front. Pharmacol. 2016, 7, 1–10. 10.3389/fphar.2016.00181. [DOI] [PMC free article] [PubMed] [Google Scholar]
- Jarabek A. M.; Asgharian B.; Miller F. J. Dosimetric Adjustments for Interspecies Extrapolation of Inhaled Poorly Soluble Particles (PSP). Inhalation Toxicol. 2005, 17, 317–334. 10.1080/08958370590929394. [DOI] [PubMed] [Google Scholar]
- Hofmann W.; Winkler-Heil R.; Balásházy I. The Effect of Morphological Variability on Surface Deposition Densities of Inhaled Particles in Human Bronchial and Acinar Airways. Inhalation Toxicol. 2006, 18, 809–819. 10.1080/08958370600753851. [DOI] [PubMed] [Google Scholar]
- Shatkin J. A.; Oberdörster G. Comment on Shvedova et al., Gender Differences in Murine Pulmonary Responses Elicited by Cellulose Nanocrystals. Part. Fibre Toxicol. 2016, 13, 1–7. 10.1186/s12989-016-0170-4. [DOI] [PMC free article] [PubMed] [Google Scholar]
- Pavia D.; Bateman J. R. M.; Sheahan N. F.; Agnew J. E.; Clarke S. W. Tracheobronchial Mucociliary Clearance in Asthma: Impairment during Remission. Thorax 1985, 40, 171–175. 10.1136/thx.40.3.171. [DOI] [PMC free article] [PubMed] [Google Scholar]
- Mu Q.; Jiang G.; Chen L.; Zhou H.; Fourches D.; Tropsha A.; Yan B. HHS Public Access. Chem. Rev. 2014, 114, 7740–7781. 10.1021/cr400295a. [DOI] [PMC free article] [PubMed] [Google Scholar]
- Fröhlich E. The Role of Surface Charge in Cellular Uptake and Cytotoxicity of Medical Nanoparticles. Int. J. Nanomed. 2012, 7, 5577–5591. 10.2147/IJN.S36111. [DOI] [PMC free article] [PubMed] [Google Scholar]
- Hiemstra P. S.; McCray P. B.; Bals R. The Innate Immune Function of Airway Epithelial Cells in Inflammatory Lung Disease. Eur. Respir. J. 2015, 45, 1150–1162. 10.1183/09031936.00141514. [DOI] [PMC free article] [PubMed] [Google Scholar]
- Val S.; Hussain S.; Boland S.; Hamel R.; Baeza-Squiban A.; Marano F. Carbon Black and Titanium Dioxide Nanoparticles Induce Pro-Inflammatory Responses in Bronchial Epithelial Cells: Need for Multiparametric Evaluation Due to Adsorption Artifacts. Inhalation Toxicol. 2009, 21, 115–122. 10.1080/08958370902942533. [DOI] [PubMed] [Google Scholar]
- Wu W.; Samet J. M.; Peden D. B.; Bromberg P. A. Phosphorylation of P65 Is Required for Zinc Oxide Nanoparticle-Induced Interleukin 8 Expression in Human Bronchial Epithelial Cells. Environ. Health Perspect. 2010, 118, 982–987. 10.1289/ehp.0901635. [DOI] [PMC free article] [PubMed] [Google Scholar]
- Jing X.; Park J. H.; Peters T. M.; Thorne P. S. Toxicity of Copper Oxide Nanoparticles in Lung Epithelial Cells Exposed at the Air–Liquid Interface Compared with In Vivo Assessment. Toxicol. In Vitro 2015, 29, 502–511. 10.1016/j.tiv.2014.12.023. [DOI] [PMC free article] [PubMed] [Google Scholar]
- Frieke Kuper C.; Gröllers-Mulderij M.; Maarschalkerweerd T.; Meulendijks N. M. M.; Reus A.; van Acker F.; Zondervan-van den Beuken E. K.; Wouters M. E. L.; Bijlsma S.; Kooter I. M. Toxicity Assessment of Aggregated/Agglomerated Cerium Oxide Nanoparticles in an In Vitro 3D Airway Model: The Influence of Mucociliary Clearance. Toxicol. In Vitro 2015, 29, 389–397. 10.1016/j.tiv.2014.10.017. [DOI] [PubMed] [Google Scholar]
- Låg M.; Skuland T.; Godymchuk A.; Nguyen T. H. T.; Pham H. L. T.; Refsnes M. Silica Nanoparticle-Induced Cytokine Responses in BEAS-2B and HBEC3-KT Cells: Significance of Particle Size and Signalling Pathways in Different Lung Cell Cultures. Basic Clin. Pharmacol. Toxicol. 2018, 122, 620–632. 10.1111/bcpt.12963. [DOI] [PubMed] [Google Scholar]
- Kishimoto T. IL-6: From Its Discovery to Clinical Applications. Int. Immunol. 2010, 22, 347–352. 10.1093/intimm/dxq030. [DOI] [PubMed] [Google Scholar]
- Sica A.; Mantovani A. Macrophage Plasticity and Polarization: In Vivo Veritas. J. Clin. Invest. 2012, 122, 787–795. 10.1172/JCI59643. [DOI] [PMC free article] [PubMed] [Google Scholar]
- Whitsett J. A.; Alenghat T. Respiratory Epithelial Cells Orchestrate Pulmonary Innate Immunity. Nat. Immunol. 2015, 16, 27–35. 10.1038/ni.3045. [DOI] [PMC free article] [PubMed] [Google Scholar]
- Pezzulo A. A.; Starner T. D.; Scheetz T. E.; Traver G. L.; Tilley A. E.; Harvey B.-G.; Crystal R. G.; McCray P. B.; Zabner J. The Air-Liquid Interface and Use of Primary Cell Cultures Are Important to Recapitulate the Transcriptional Profile of In Vivo Airway Epithelia. AJP Lung Cell. Mol. Physiol. 2011, 300, L25–L31. 10.1152/ajplung.00256.2010. [DOI] [PMC free article] [PubMed] [Google Scholar]
- Dvorak A.; Tilley A. E.; Shaykhiev R.; Wang R.; Crystal R. G. Do Airway Epithelium Air-Liquid Cultures Represent the In Vivo Airway Epithelium Transcriptome?. Am. J. Respir. Cell Mol. Biol. 2011, 44, 465–473. 10.1165/rcmb.2009-0453OC. [DOI] [PMC free article] [PubMed] [Google Scholar]
- Araujo B. B.; Dolhnikoff M.; Silva L. F. F.; Elliot J.; Lindeman J. H. N.; Ferreira D. S.; Mulder A.; Gomes H. A. P.; Fernezlian S. M.; James A.; Mauad T. Extracellular Matrix Components and Regulators in the Airway Smooth Muscle in Asthma. Eur. Respir. J. 2008, 32, 61–69. 10.1183/09031936.00147807. [DOI] [PubMed] [Google Scholar]
- Kim H.; Ellis A. K.; Fischer D.; Noseworthy M.; Olivenstein R.; Chapman K. R.; Lee J. Asthma Biomarkers in the Age of Biologics. Allergy, Asthma, Clin. Immunol. 2017, 13, 1–17. 10.1186/s13223-017-0219-4. [DOI] [PMC free article] [PubMed] [Google Scholar]
- Holgate S. T.; Polosa R. Treatment Strategies for Allergy and Asthma. Nat. Rev. Immunol. 2008, 8, 218–230. 10.1038/nri2262. [DOI] [PubMed] [Google Scholar]
- Ying S.; O’Connor B.; Ratoff J.; Meng Q.; Mallett K.; Cousins D.; Robinson D.; Zhang G.; Zhao J.; Lee T. H.; Corrigan C. Thymic Stromal Lymphopoietin Expression Is Increased in Asthmatic Airways and Correlates with Expression of Th2-Attracting Chemokines and Disease Severity. J. Immunol. 2005, 174, 8183–8190. 10.4049/jimmunol.174.12.8183. [DOI] [PubMed] [Google Scholar]
- Ying S.; O’Connor B.; Ratoff J.; Meng Q.; Fang C.; Cousins D.; Zhang G.; Gu S.; Gao Z.; Shamji B.; Edwards M. J.; Lee T. H.; Corrigan C. J. Expression and Cellular Provenance of Thymic Stromal Lymphopoietin and Chemokines in Patients with Severe Asthma and Chronic Obstructive Pulmonary Disease. J. Immunol. 2008, 181, 2790–2798. 10.4049/jimmunol.181.4.2790. [DOI] [PubMed] [Google Scholar]
- Préfontaine D.; Nadigel J.; Chouiali F.; Audusseau S.; Semlali A.; Chakir J.; Martin J. G.; Hamid Q. Increased IL-33 Expression by Epithelial Cells in Bronchial Asthma. J. Allergy Clin. Immunol. 2010, 125, 752–754. 10.1016/j.jaci.2009.12.935. [DOI] [PubMed] [Google Scholar]
- Shi M.; Kwon H. S.; Peng Z.; Elder A.; Yang H. Effects of Surface Chemistry on the Generation of Reactive Oxygen Species by Copper Nanoparticles. ACS Nano 2012, 6, 2157–2164. 10.1021/nn300445d. [DOI] [PMC free article] [PubMed] [Google Scholar]
- Wanner A.; Salathe M.; O'Riordan T. G. State of the Art Mucociliary Clearance in the Airways. Am. J. Respir. Crit. Care Med. 1996, 154, 1868–1902. 10.1164/ajrccm.154.6.8970383. [DOI] [PubMed] [Google Scholar]
- Londino J. D.; Collawn J. F.; Matalon S.. Regulation of Airway Lining Fluid in Health and Disease. In Comparative Biology of the Normal Lung, 2nd ed.; Richard A. P., Ed.; Academic Press, 2015; pp 467–477. [Google Scholar]
- Thomas B.; Rutman A.; Hirst R. A.; Haldar P.; Wardlaw A. J.; Bankart J.; Brightling C. E.; O’Callaghan C. Ciliary Dysfunction and Ultrastructural Abnormalities Are Features of Severe Asthma. J. Allergy Clin. Immunol. 2010, 126, 722–729. 10.1016/j.jaci.2010.05.046. [DOI] [PubMed] [Google Scholar]
- Boon M.; Wallmeier J.; Ma L.; Loges N. T.; Jaspers M.; Olbrich H.; Dougherty G. W.; Raidt J.; Werner C.; Amirav I.; Hevroni A.; Abitbul R.; Avital A.; Soferman R.; Wessels M.; O’Callaghan C.; Chung E. M. K.; Rutman A.; Hirst R. A.; Moya E.; Mitchison H.; et al. MCIDAS Mutations Result in a Mucociliary Clearance Disorder with Reduced Generation of Multiple Motile Cilia. Nat. Commun. 2014, 5, 4418. 10.1038/ncomms5418. [DOI] [PubMed] [Google Scholar]
- Andrews G. K. Regulation of Metallothionein Gene Expression by Oxidative Stress and Metal Ions. Biochem. Pharmacol. 2000, 59, 95–104. 10.1016/S0006-2952(99)00301-9. [DOI] [PubMed] [Google Scholar]
- Nagy A.; Hollingsworth J. A.; Hu B.; Steinbrück A.; Stark P. C.; Rios Valdez C.; Vuyisich M.; Stewart M. H.; Atha D. H.; Nelson B. C.; Iyer R. Functionalization-Dependent Induction of Cellular Survival Pathways by CdSe Quantum Dots in Primary Normal Human Bronchial Epithelial Cells. ACS Nano 2013, 7, 8397–8411. 10.1021/nn305532k. [DOI] [PubMed] [Google Scholar]
- Peng L.; He M.; Chen B.; Qiao Y.; Hu B. Metallomics Study of CdSe/ZnS Quantum Dots in HepG2 Cells. ACS Nano 2015, 9, 10324–10334. 10.1021/acsnano.5b04365. [DOI] [PubMed] [Google Scholar]
- Poon W.-L.; Alenius H.; Ndika J.; Fortino V.; Kolhinen V.; Meščeriakovas A.; Wang M.; Greco D.; Lähde A.; Jokiniemi J.; Lee J. C-Y.; El-Nezami H.; Karisola P. Nano-Sized Zinc Oxide and Silver, but Not Titanium Dioxide, Induce Innate and Adaptive Immunity and Antiviral Response in Differentiated THP-1 Cells. Nanotoxicology 2017, 11, 936–951. 10.1080/17435390.2017.1382600. [DOI] [PubMed] [Google Scholar]
- Zarcone M. C.; Duistermaat E.; van Schadewijk A.; Jedynska A.; Hiemstra P. S.; Kooter I. M. Cellular Response of Mucociliary Differentiated Primary Bronchial Epithelial Cells to Diesel Exhaust. Am. J. Physiol. Cell. Mol. Physiol. 2016, 311, L111–L123. 10.1152/ajplung.00064.2016. [DOI] [PubMed] [Google Scholar]
- Zarcone M. C.; Duistermaat E.; Alblas M. J.; van Schadewijk A.; Ninaber D. K.; Clarijs V.; Moerman M. M.; Vaessen D.; Hiemstra P. S.; Kooter I. M. Effect of Diesel Exhaust Generated by a City Bus Engine on Stress Responses and Innate Immunity in Primary Bronchial Epithelial Cell Cultures. Toxicol. In Vitro 2018, 48, 221–231. 10.1016/j.tiv.2018.01.024. [DOI] [PubMed] [Google Scholar]
- Walker S. E.; Lorsch J.. RNA Purification - Precipitation Methods. In Methods in Enzymology, 1st ed.; Jon L., Ed.; Academic Press, 2013; pp 337–343. [DOI] [PubMed] [Google Scholar]
- Edgar R. Gene Expression Omnibus: NCBI Gene Expression and Hybridization Array Data Repository. Nucleic Acids Res. 2002, 30, 207–210. 10.1093/nar/30.1.207. [DOI] [PMC free article] [PubMed] [Google Scholar]
- Marwah V. S.; Scala G.; Kinaret P. A. S.; Serra A.; Alenius H.; Fortino V.; Greco D. EUTOPIA: SolUTion for Omics Data PreprocessIng and Analysis. Source Code Biol. Med. 2019, 14, 1–12. 10.1186/s13029-019-0071-7. [DOI] [PMC free article] [PubMed] [Google Scholar]
- Smyth G. K.Limma: Linear Models for Microarray Data. In Bioinformatics and computational biology solutions using R and Bioconductor; Springer: New York, 2005; pp 397–420. [Google Scholar]
- Ritchie M. E.; Phipson B.; Wu D.; Hu Y.; Law C. W.; Shi W.; Smyth G. K. Limma Powers Differential Expression Analyses for RNA-Sequencing and Microarray Studies. Nucleic Acids Res. 2015, 43, e47. 10.1093/nar/gkv007. [DOI] [PMC free article] [PubMed] [Google Scholar]
- Tyanova S.; Temu T.; Sinitcyn P.; Carlson A.; Hein M. Y.; Geiger T.; Mann M.; Cox J. The Perseus Computational Platform for Comprehensive Analysis of (Prote)Omics Data. Nat. Methods 2016, 13, 731–740. 10.1038/nmeth.3901. [DOI] [PubMed] [Google Scholar]
- Leek J. T.; Johnson W. E.; Parker H. S.; Jaffe A. E.; Storey J. D. The SVA Package for Removing Batch Effects and Other Unwanted Variation in High-Throughput Experiments. Bioinformatics 2012, 28, 882–883. 10.1093/bioinformatics/bts034. [DOI] [PMC free article] [PubMed] [Google Scholar]
- Mi H.; Huang X.; Muruganujan A.; Tang H.; Mills C.; Kang D.; Thomas P. D. PANTHER Version 11: Expanded Annotation Data from Gene Ontology and Reactome Pathways, and Data Analysis Tool Enhancements. Nucleic Acids Res. 2017, 45, D183–D189. 10.1093/nar/gkw1138. [DOI] [PMC free article] [PubMed] [Google Scholar]
- Warde-Farley D.; Donaldson S. L.; Comes O.; Zuberi K.; Badrawi R.; Chao P.; Franz M.; Grouios C.; Kazi F.; Lopes C. T.; Maitland A.; Mostafavi S.; Montojo J.; Shao Q.; Wright G.; Bader G. D.; Morris Q. The GeneMANIA Prediction Server: Biological Network Integration for Gene Prioritization and Predicting Gene Function. Nucleic Acids Res. 2010, 38, 214–220. 10.1093/nar/gkq537. [DOI] [PMC free article] [PubMed] [Google Scholar]
Associated Data
This section collects any data citations, data availability statements, or supplementary materials included in this article.