

Abstract
Speech perception involves the integration of sensory input with expectations based on the context of that speech. Much debate surrounds the issue of whether or not prior knowledge feeds back to affect early auditory encoding in the lower levels of the speech processing hierarchy, or whether perception can be best explained as a purely feedforward process. Although there has been compelling evidence on both sides of this debate, experiments involving naturalistic speech stimuli to address these questions have been lacking. Here, we use a recently introduced method for quantifying the semantic context of speech and relate it to a commonly used method for indexing low-level auditory encoding of speech. The relationship between these measures is taken to be an indication of how semantic context leading up to a word influences how its low-level acoustic and phonetic features are processed. We record EEG from human participants (both male and female) listening to continuous natural speech and find that the early cortical tracking of a word's speech envelope is enhanced by its semantic similarity to its sentential context. Using a forward modeling approach, we find that prediction accuracy of the EEG signal also shows the same effect. Furthermore, this effect shows distinct temporal patterns of correlation depending on the type of speech input representation (acoustic or phonological) used for the model, implicating a top-down propagation of information through the processing hierarchy. These results suggest a mechanism that links top-down prior information with the early cortical entrainment of words in natural, continuous speech.
SIGNIFICANCE STATEMENT During natural speech comprehension, we use semantic context when processing information about new incoming words. However, precisely how the neural processing of bottom-up sensory information is affected by top-down context-based predictions remains controversial. We address this discussion using a novel approach that indexes a word's similarity to context and how well a word's acoustic and phonetic features are processed by the brain at the time of its utterance. We relate these two measures and show that lower-level auditory tracking of speech improves for words that are more related to their preceding context. These results suggest a mechanism that links top-down prior information with bottom-up sensory processing in the context of natural, narrative speech listening.
Keywords: computational linguistics, EEG, natural speech, perception, semantic processing, top-down effects
Introduction
Spoken language is one of the distinguishing characteristics of our species. But precisely how our brain converts complex spectro-temporal patterns into meaning remains unclear (Poeppel, 2014). There is convergent evidence in the literature that points to hierarchical levels of specialization in linguistic processing, in which different regions of the brain are implicated (Davis and Johnsrude, 2003; DeWitt and Rauschecker, 2012). For example, the superior temporal gyrus has been shown to encode fundamental spectro-temporal acoustic features relevant to speech (Mesgarani et al., 2014), whereas the superior temporal sulcus is thought to play a role in phonemic perception (Liebenthal et al., 2005; Hickok and Poeppel, 2007). At higher levels, words are subsequently retrieved from a mental lexicon, believed to be located in the left middle temporal gyrus (Badre et al., 2005) whose meanings are accessed through a widely distributed semantic network (Binder et al., 2009; Huth et al., 2016; Anderson et al., 2017).
Much debate surrounds the issue of whether context-based predictions of upcoming words that are made at these higher levels feed back to affect processing at lower levels (Kuperberg and Jaeger, 2016). It is widely acknowledged that semantic context can influence the processing of individual words as seen in reading (Ehrlich and Rayner, 1981; Hale, 2001; Frank, 2013; Smith and Levy, 2013) and electrophysiological experiments (Kutas and Hillyard, 1980), but whether this information can shape the perception of speech at a prelexical stage remains controversial (McClelland and Elman, 1986; Norris et al., 2000; Davis and Johnsrude, 2007; Travis et al., 2013). Although there has been compelling evidence on both sides of this debate, experiments involving naturalistic speech stimuli to address these questions have been lacking.
Cortical activity has been shown to track the temporal envelope of speech (Ahissar et al., 2001) and is reflective of both the acoustic (Aiken and Picton, 2008) and phonetic processing (Di Liberto et al., 2015; Khalighinejad et al., 2017) of speech in EEG. Recent studies have also shown how low-frequency cortical entrainment to the speech envelope increases as a function of speech intelligibility (Luo and Poeppel, 2007; Ding et al., 2014; Crosse et al., 2016b). This indicates that cortical tracking of the speech envelope is not merely a passive following of the acoustic signal but can be influenced by some top-down input. It remains unclear, however, what is driving this modulation. It is well known that selective attention modulates the cortical tracking of speech, as seen in studies using the “Cocktail Party” paradigm (Ding and Simon, 2012a; Power et al., 2012; Zion Golumbic et al., 2013; O'Sullivan et al., 2015). Other factors, such as listening effort (Peelle, 2018), have also been shown to affect tracking ability. Another possibility is that this increase in tracking could be partially due to the amount of semantic context and word predictability made available with increasing speech intelligibility. It has been shown that semantic information can improve perceived intelligibility of speech in noise, comparing coherent sentences with unrelated word lists (Miller et al., 1951), and coherent with incoherent sentences (Davis et al., 2011). Semantic context can also bias the perception of phonemes replaced with noise, which has been shown in behavioral (Warren, 1970) and neurophysiological studies (Leonard et al., 2016). Such studies point to a top-down, semantic-related effect on the auditory tracking of the speech signal, but whether this occurs at prelexical stage remains unclear.
In this study, we investigate the impact that semantic information may have on the early encoding of natural speech at acoustic-phonetic levels and whether this occurs for more naturalistic stimuli, such as continuous speech. Here, we use a method for quantifying words' semantic similarity to their immediately preceding sentential context, hereafter “semantic similarity” (Broderick et al., 2018) and relate it to a commonly used method for indexing low-level auditory encoding of speech. The relationship between these measures is taken to be an indication of how semantic context leading up to a word influences how its low-level acoustic and phonetic features are processed.
Materials and Methods
All data used in the analysis were originally collected for Di Liberto et al. (2015) and Broderick et al. (2018). These data are currently available to download via Dryad at https://datadryad.org/resource/doi:10.5061/dryad.070jc.
Participants
Nineteen native English speakers (6 female; 19–38 years of age) participated. The study was undertaken in accordance with the Declaration of Helsinki and was approved by the Ethics Committee of the School of Psychology at Trinity College Dublin. Each subject provided written informed consent. Subjects reported no history of hearing impairment or neurological disorder.
Stimuli and experimental procedure
Subjects undertook 20 trials, each just <180 s long, where they were presented with an audio-book version of a popular mid-20th century American work of fiction (Hemingway, 1952), read by a single male American speaker. The average speech rate was 210 words/min. The mean length of each content word was 340 ms with SD of 127 ms. Trials were presented chronologically to the story. All stimuli were presented diotically at a sampling rate of 44.1 kHz using HD650 headphones (Sennheiser) and Presentation software (Neurobehavioural Systems). Testing was performed in a dark, sound-attenuated room, and subjects were instructed to maintain visual fixation on a crosshair centered on the screen for the duration of each trial, and to minimize eye blinking and all other motor activities.
EEG acquisition and preprocessing
The 128-channel EEG data were acquired at a rate of 512 Hz using an ActiveTwo system (BioSemi). Triggers indicating the start of each trial were sent by the stimulus presentation computer and included in the EEG recordings to ensure synchronization. Offline, the data were bandpass filtered between 1 and 8 Hz using a Chebyshev Type II filter (order 54, cutoff 0.5 Hz for high pass filtering and 8.5 Hz for low pass filtering). Passband attenuation was set to 1 dB, and stopband attenuation was set to 60 dB (high pass) and 80 dB (low pass). The data were later filtered in δ and θ bands using 1–4 Hz (order 34, cutoff 0.5 Hz and 4.5 Hz) and 4–8 Hz (order 36, cutoff 3.5 Hz and 8.5 Hz) Chebyshev Type II bandpass filters. These filters had the same passband and stopband attenuation as the 1–8 Hz filter. After filtering, data were downsampled to 64 Hz (backward modeling) or 128 Hz (forward modeling; see below). To identify channels with excessive noise, the SD of the time series of each channel was compared with that of the surrounding channels. For each trial, a channel was identified as noisy if its SD was >2.5 times the mean SD of all other channels or less than the mean SD of all other channels divided by 2.5. Channels contaminated by noise were recalculated by spline interpolating the surrounding clean channels in EEGLAB (Delorme and Makeig, 2004). Finally, the data were rereferenced to the global average of all channels. We chose minimal preprocessing on the EEG signal (for example, excluding common preprocessing steps, e.g., independent component analysis) as the data would be further processed using the temporal response function (TRF; see below). This analysis identifies neural signals related to auditory processing and therefore acts as an additional preprocessing stage. A similar preprocessing pipeline has been selected for a variety of studies that use the TRF to investigate auditory processing in the brain (Di Liberto et al., 2015; O'Sullivan et al., 2015; Crosse et al., 2016b). We conducted an additional analysis to ensure that unrelated artifacts, such as ocular artifacts, did not pose as a confound in our main results (see Results).
Stimulus characterization
A speech signal can be represented in several different forms. Each characterization can be thought to index different aspects of the same speech signal and capture unique features from different levels of the language hierarchy. In our methods, we extract a variety of acoustic and linguistic features from each content word in our spoken narrative and use these features as inputs at various points in a two-stage regression analysis. These features can be categorized into three main groups based on their role and what stage they are used in the analysis.
1. The first group of features were used as input in the TRF (see below), mapping stimulus to neural response or neural response to stimulus. These characteristics are used to assess the encoding of speech at different levels of the hierarchy.
1a. Envelope.
The broadband amplitude envelope of the speech signal was calculated using the Hilbert transform.
1b. Spectrogram.
The speech signal was filtered into 16 different frequency bands between 250 Hz and 8 kHz according to Greenwood's equations (Greenwood, 1961). After filtering, the amplitude envelope was calculated for each band.
1c. Phonetic features.
To create the phonetic feature stimulus, Prosodylab-Aligner software (Gorman et al., 2011) was used. This automatically partitions each word in the story into phonemes from the American English International Phonetic Alphabet and performs forced alignment, returning the starting and ending time points for each phoneme. Each phoneme was then mapped to a corresponding set of 19 phonetic features, which was based on the University of Iowa's phonetics project (http://prosodylab.cs.mcgill.ca/tools/aligner/).
2. The second group indexes higher-level linguistic features of words and was used in the second stage of the regression analysis.
2a. Semantic similarity.
Semantic similarity was calculated for each content word in the narrative. It is based on the well-known word2vec model (Mikolov et al., 2013a; Baroni et al., 2014), whereby each word can be represented as a 400-dimensional vector (Baroni et al., 2014). Word2vec semantic vectors encode the intermediary network-level processing stage that precedes the activation of predicted words. Specifically, vectors are network weights connecting word identity input nodes to a hidden layer of 400 nodes that reflect textual contexts. The hidden contexts are the abstract latent structure within natural text corpora that are discovered by network training. The hidden layer subsequently activates an output layer of word identity nodes that encode the prediction. Crucially, words that share similar meaning will have a closer proximity in this 400-dimensional space. A word's similarity index is calculated as 1 divided by the Euclidean distance between the word's vector and the averaged vector of all the preceding words in the sentence (Broderick et al., 2018). Thus, small similarity values signify out-of-context words that by extension are unexpected. Similar measures of semantic surprisal and distance have been used to study reading time effects (Pynte et al., 2009), reading comprehension (Frank and Willems, 2017), and brain imaging of speech processing (Frank and Willems, 2017).
Semantic similarity values had a mean of 0.347 and SD of 0.072. To put these values into perspective, we estimated distributions of semantic similarity values for sentences that were purposefully constructed to reach the upper and lower bounds of semantic similarity. We took example sentence pairs from an N400 study designed by Federmeier (Federmeier and Kutas, 1999), and calculated semantic similarity values for each word in the second sentence relative to the first. This distribution of values was taken to be the upper bound. We then replaced these sentences with randomly selected sentences from the TIMIT dataset (Garofolo et al., 1993) to simulate a second distribution, and lower bound, of semantic similarity values. We found that the distribution of semantic similarity values derived from our natural text lies between the upper (mean = 0.367, SD = 0.069) and lower (mean = 0.3, SD = 0.048) distributions of semantic similarity values.
3. Finally, a third group of stimulus characterizations was identified. The purpose of this group was to be included in the second-stage regression analysis as “nuisance regressors” to soak up any variance in word reconstruction accuracy related to acoustic changes in the speaker's voice (detailed discussion below).
3a. Envelope variability.
Envelope variability was calculated by taking the SD of the speech envelope over the same time window used to measure word reconstruction accuracy. Here, we wished to control for rapid changes in the envelope amplitude as it has been shown that cortical responses monotonically increase with steeper acoustic edges (Oganian and Chang, 2018).
3b. Relative pitch.
Relative pitch was recently shown to be encoded in EEG (Teoh et al., 2019). It quantifies pitch normalized according to the vocal range of the speaker. Praat software (Boersma and Weenink, 2016) was used to extract a continuous measure of pitch (absolute pitch). The measure was then normalized to zero mean and unit SD (z units) to obtain relative pitch.
3c. Resolvability.
Resolvability measures whether the harmonics of a sound can be processed within distinct filters of the cochlea (resolved) or whether they interact within the same filter (unresolved). It has previously been shown using fMRI that pitch responses in auditory cortex are predominantly driven by resolved frequency components (Norman-Haignere et al., 2013). Custom-written scripts from an acoustic statistics toolbox from the same study were used to extract a continuous measure of harmonic resolvability.
Modeling of the stimulus–response relationship
Described below are two approaches for modeling the relationship between an audio stimulus and neural response. Our goal here is to examine how these measures might vary as a function of the amount of semantic information carried by individual words in context. As described below, the speech envelope can be reconstructed based on a “backward” model (known as a decoder) trained on the neural data. Conversely, the neural response can be predicted using a “forward” model trained on the stimulus. Both approaches offer complementary advantages (Crosse et al., 2016a). The backward modeling approach takes into account the signal from all recorded electrodes simultaneously and thus can do a better job at separating the speech-related signal from the background EEG. Given that we did not have a good sense a priori of how large the effect of semantic information on low-level processing might be, we chose to first exploit the sensitivity of this backward modeling approach to maximize our chances of identifying such an effect. On the other hand, forward modeling gives channel-specific predictions and can indicate scalp regions where the stimulus is most prominently represented. It can also more easily incorporate different multivariate speech representations (e.g., spectrograms, phonetic features). As such, we also sought to use the forward modeling approach with a view to identify how different speech features might be differentially affected by semantic information and how any such effects might be distributed on the scalp.
Backwards modeling/envelope reconstruction
A backwards model, or decoder, was trained to reconstruct an estimate of the speech envelope from the neural data (Mesgarani et al., 2009; Ding and Simon, 2012b). A decoder, gn(τ), describes a linear mapping from neural response, rn(t), to stimulus, s(t), and can be expressed by the following equation:
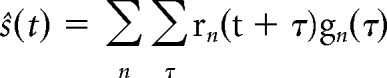 |
where ŝ(t) is the reconstructed stimulus envelope; n indicates the recorded neural channels, and τ is a specified number of time lags. Here, the decoder, g, was obtained using ridge regression, written in matrix form as follows:
where R is the lagged time series of the EEG data. The time lags ranged from −100 to 300 ms. The regularization term was used to prevent overfitting, where λ is the ridge parameter and I is the identity matrix. In a leave-one-out cross-validation procedure, a decoder, trained on all but one trial, is used to reconstruct an estimate of the speech envelope of the left-out trial. Envelope reconstruction accuracy is then found by calculating the correlation between the reconstructed envelope and the actual envelope. This is repeated for each of the 20 trials in the experiment (Crosse et al., 2016a). A range of decoders were constructed using different λ values between 0.1 and 1000. The λ value corresponding to the decoder that produced the highest envelope reconstruction accuracy, averaged across trials, was selected as the regularization parameter for all trials per subject.
Because the goal of the study was to assess the low-level encoding of each individual word as a function of its semantic similarity, we focused on the envelope reconstruction around each word. Specifically, each individual word's reconstruction accuracy was assessed by looking at the Spearman's correlation between the reconstructed envelope and the actual envelope in the first 100 ms after the word's onset (Fig. 1A, bottom right). The length of this window was chosen to capture the fast-changing dynamics of auditory encoding of each word's low-level features. Because we were interested in the effect that semantic similarity might have on the earliest stages of processing after word onset, we initially looked at 0–100 ms. Later, we shifted this window to show how these dynamics change over the course of a word utterance, as described below. There were, on average, 2 phonemes in every 100 ms window.
Figure 1.

Overview of the analysis. A, Speech can be represented by its envelope or by each word's semantic similarity to preceding sentential context, Sw. Using a backwards decoder, the speech envelope is reconstructed from recorded EEG data. A word's reconstruction accuracy is measured by comparing the predicted envelope with the actual envelope within a time window after each word's onset rw. The relationship between word reconstruction accuracy (rw) and semantic similarity (sw) is then measured by fitting a second-stage linear model with these variables and calculating the model fit and slope coefficients of R2 and β. Bottom left, Outcomes of the model. Positive or negative β values would suggest that semantic context has an effect on the cortical tracking of words. A β value of zero would suggest no interaction between the measures. B, Forward encoding models were derived to predict the EEG. These models can take different representations of speech as their input. Here, spectro-temporal and phonetic feature representations were used to index different levels of language processing. The predicted EEG signal is compared with the actual EEG at a specified time window enclosing each word to calculate word reconstruction accuracy. The parameters of the second-stage model are used to assess the relationship between semantic similarity and word reconstruction accuracy at each EEG channel.
Forward modeling/EEG prediction
The forward mapping of stimulus to response was done using the TRF (Lalor and Foxe, 2010). The TRF can be thought of as a filter that describes the brain's linear mapping between stimulus and neural response. For N recorded channels, the instantaneous neural response r(t, n), sampled at times t = 1 … T, and channel n, consists of a convolution of the stimulus property, s(t), with a channel-specific TRF, w(τ, n). The response can be modeled as follows:
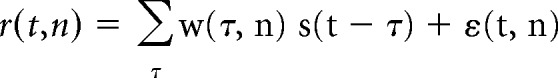 |
The TRF is estimated as follows, written in matrix format as follows:
Where S is the lagged time series of the stimulus. The time lags ranged from −100 to 300 ms. Again, in a leave-one-out cross-validation procedure, trained TRFs are used to predict the left-out EEG response based on the corresponding stimulus. This predicted response is then compared with the recorded neural data to assess EEG prediction accuracy. A range of TRFs were constructed using different λ values between 0.1 and 1000. The λ value corresponding to the TRF that produced the highest EEG prediction accuracy, averaged across trials and channels, was selected as the regularization parameter for all trials per subject.
We created three separate forward TRFs based on representing the speech input as its spectrogram (spectrogram-only), a discrete set of time-aligned phonetic features (phonetic features-only), and as a combination of its spectrogram and phonetic features (Fig. 1B, bottom left) (Di Liberto et al., 2015). These models were used to generate three separate sets of EEG predictions that reflect cortical responses to the spectral and phonological properties of speech.
Again, we wanted to look at the low-level encoding of each word. As such, for the forward modeling, we calculated the word-response prediction accuracy as the Spearman's correlation between the predicted EEG signal and the recorded EEG, for a time window of 0–100 ms after the onset of each word (Fig. 1B, bottom right). Because the forward modeling provides a prediction for each EEG channel, we can derive sets of word-response prediction accuracies at each electrode and thus assess the scalp locations where interactions between semantic similarity and cortical tracking are most pronounced.
Modeling the relationship between semantic information and cortical tracking
The main goal of the present study was to assess how the abovementioned speech encoding measures of words (envelope reconstruction and response prediction accuracy based on spectral and phonetic features) vary as a function of the semantic information associated with them. To that end, the strength of relationship between stimulus reconstruction or response prediction accuracy and semantic similarity to context was measured using a second-stage linear regression model with each content word in the narrative as a datapoint to the model (N = 5431) and with associated reconstruction/prediction accuracy and semantic similarity values as dependent and predictor variables, respectively. We used a linear mixed-effects (LME) model which models variability due to items and subjects simultaneously. The model is described as follows:
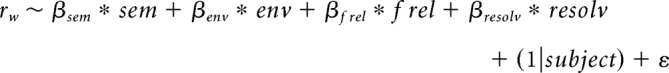 |
In addition to semantic similarity (sem), low-level acoustic correlates of pronunciation, measured in the first 100 ms after word onset, were included in the model. These were envelope variability (env), average relative pitch (frel), and average resolvability (resolv). The roles of these variables were to act as nuisance regressors to ensure no underlying acoustic-related confound existed between our two main measures. It has been shown that semantic information associated with a word will affect how it is spoken (Lieberman, 1963). Therefore, it was important to ensure that any effect of semantic information on cortical tracking was not indeed an indirect one, by proxy of changes in the speaker's voice rather than top-down effects in the listener's brain. We studied the model fit, R2, and semantic similarity features weight, βsem, to determine whether there was some relationship between the variables. All variables were normalized to zero mean and unit SD (z units) before being input to the model. Pairwise correlations for the predictor variables in the second-stage regression were calculated using Pearson's correlation and are given in Table 1.
Table 1.
Pairwise correlations between predictors variable in second-stage regression
| Semantic similarity | Envelope deviation | frel | Resolvability | |
|---|---|---|---|---|
| Semantic similarity | 1 | — | — | — |
| Envelope variability | 0.038* | 1 | — | — |
| Relative pitch | 0.0011 | 0.295* | 1 | — |
| Resolvability | −0.029 | 0.236* | 0.386* | 1 |
*Significant correlation after correcting for multiple comparisons.
For our forward modeling analysis, EEG prediction accuracies, derived from the combined spectrogram and phonetic features TRF, were used as the dependent variable in the second-stage LME model, with identical predictor variables as the second-stage backwards model. To investigate the effect of semantic context on isolated measures of acoustic and phonological processing, two additional second-stage models were constructed. These models were the same as the second-stage forward model but included prediction accuracies from the spectrogram-only TRF or the phonetic features-only TRF as additional nuisance regressors for each other. The rationale for including these nuisance regressors was that phonological feature and spectrogram representations of speech share redundant information. So, for example, including EEG prediction accuracies from the spectrogram TRF allowed us to partial out that redundant contribution and identify the effects of semantic information on phonetic feature processing in isolation. The analogous analysis was performed to identify effects of semantic context on spectrographic processing in isolation also.
Statistical analysis
Permutation testing.
To test the significance of our model, we ran repeated permutation tests in which reconstruction or prediction accuracy values were fixed and semantic similarity values were randomly shuffled between words, taking the parameters of the model at each permutation. The testing consisted of 1000 permutations. Parameters of the true model (β and R2) were deemed significant if they exceeded 95th percentile of the distributions of model parameters based on shuffled semantic similarity values.
Correcting for multiple comparisons.
Multiple-comparison correction was required for analyses that involved statistical testing at multiple scalp electrodes, multiple time windows, or both. A cluster-mass nonparametric analysis was conducted (Maris and Oostenveld, 2007) to overcome the multiple-comparison problem. This approach includes biophysically motivated constraints that can increase the sensitivity of the statistical test compared with a standard Bonferroni correction. Neighboring electrodes or time windows that show a significant correlation between semantic similarity and reconstruction/prediction accuracy (measured as the T value of the regression coefficient being higher than the critical threshold value; α = 0.05) were clustered together. Cluster-level statistics were calculated by summing the T values in each cluster separately. Permutation testing was then performed on all the data, and Monte Carlo p values were calculated for all significant clusters under the permutation distribution of the maximum cluster-level statistic (Maris and Oostenveld, 2007).
Results
Early auditory encoding of words is influenced by their semantic information
We wished to investigate the relationship between a word's similarity to its preceding context and how well it was encoded in the initial stages of its acoustic-phonetic processing. To measure the cortical tracking of words, we first reconstructed the speech envelope from the recorded neural data using a linear decoder (Fig. 1A, right). Word reconstruction accuracy was then found by comparing the reconstructed envelope with the actual spoken envelope of the word. Each content word was also scored on its similarity to preceding sentential context. The resulting sets of semantic similarity values and envelope reconstruction accuracies were used to fit a linear model with the number of datapoints corresponding to the number of spoken content words (N = 5431). The model included low-level speech features of envelope variability, pitch, and resolvability to control for confounding acoustic (or bottom-up) effects on reconstruction accuracy. Table 2 gives the feature weights of the model. This shows a significant positive relationship between a word's semantic similarity and its auditory encoding (β = 0.0126, p < 5 × 10⁻¹¹). In other words, the more semantically similar a word is to its context, the more faithfully the envelope of that word is reflected in its EEG response. The low-level acoustic predictors, most notably envelope variability, are also correlated with reconstruction accuracy. This is unsurprising given that cortical responses are sensitive to such acoustic measures (Oganian and Chang, 2018). Importantly, however, the relationship between semantic similarity and envelope reconstruction holds despite these measures accounting for a substantial amount of the variance explained in envelope reconstruction accuracy. The proportion of the variance explained by the full model is R2 = 0.0171 (residual degrees of freedom = 103,183).
Table 2.
Model weights of the second-stage regression
| β | SE | t statistic | p | |
|---|---|---|---|---|
| Semantic similarity | 0.013 | 0.0018 | 6.76 | 1.3 × 10⁻¹¹ |
| Envelope variability | 0.074 | 0.002 | 36.52 | 3.4 × 10−290 |
| Relative pitch | −0.015 | 0.0026 | −5.74 | 9.24 × 10⁻⁹ |
| Resolvability | −0.022 | 0.002 | −10.66 | 1.4 × 10⁻²² |
Although the p values show the fit and semantic variable coefficient to be highly significant, this could be an artifact of the large sample size (Lin and Lucas, 2013). Therefore, to further test the significance of this relationship, we fixed the word reconstruction accuracy values, but shuffled the values of semantic similarity and recomputed the model fit and β values. This was repeated 1000 times. The null distribution of resulting R2 values (left) and β values (right) are shown in Figure 2A, with the true model values indicated by the vertical dashed line. The average variance explained by the models with randomly permuted semantic similarity is R2 = 0.0167. It is clear from these plots that the true semantic similarity values for each word are significantly related to the accuracy of their decoding.
Figure 2.

Backward modeling approach. A, Vertical dashed lines indicate fitted model parameters, R2 (left) and β weights for the semantic variable (right). Histograms represent the distribution of resulting parameters for models in which the semantic variable was shuffled (1000 permutations). B, Individual subject fitted model parameters, R2 (left) and β coefficients (right) compared with the mean distribution values for models based on shuffled semantic similarity values (n = 1000). Each color represents a different subject. C, Second-stage linear models were constructed for word envelope reconstruction accuracies for increasingly shifted time windows, all 100 ms in length. Plotted are the β coefficients for each fit model as a function of the moving time window center. Light blue areas represent the 95% CIs of the β coefficients. Asterisks indicate the time windows where β was significantly greater than 0, after correcting for multiple comparisons. **p < 0.01, ***p < 0.001.
In the second-stage regression, we used an LME model, which can model variability due to items and subjects simultaneously. To test for the robustness of the effect within subjects, separate linear models were fit based on individual reconstruction accuracies to calculate R2 and β values. β values were significantly >0 across subjects (t = 4.2, p = 5.4 × 10⁻⁴; one-sample t test, N = 19). Again, we conducted permutation testing, shuffling semantic similarity values for each subject's individual model. This generated null distributions of R2 and β for every subject. The mean of these null distributions, along with R2 and β for models with unshuffled values, are plotted in Figure 2B for each subject. Individual subjects' R2 and β values were significantly higher than the means of these null distributions (t = 3.76, p = 1.4 × 10⁻³ and t = 4.2, p = 5.4 × 10⁻⁶, paired t test, N = 19). Nine of 19 subjects had R2 values that exceeded the 95th percentile of their null distribution (p = 1.1 × 10⁻⁷, cumulative binomial probability of achieving ≥ n results at p = 0.05 level), and 9 of 19 subjects had β values that exceeded the 95th percentile of their null distribution (p = 1.1 × 10⁻⁷, cumulative binomial probability of achieving ≥ n results at p = 0.05 level).
The reconstruction accuracies for each word were based on the correlations between the envelope and the reconstructed envelope in the first 100 ms of the word's utterance. To study how semantic similarity may affect the tracking of a word as it unfolds in time, we shifted this 100 ms window over the word, recalculating reconstruction accuracies at each 15 ms increment. Each set of reconstruction accuracies was regressed with the fixed semantic similarity set of values to calculate a model weight β for each time window. Figure 2C shows the resulting model weight β for each time window. The 95% CIs of β are shown in light blue. Asterisks indicate time windows where β values were significantly >0 after correcting for multiple comparisons. The relationship between word reconstruction accuracy and semantic similarity is maximal and at time window of 0–100 ms (window center = 50 ms). It is worth noting that this peak β value corresponds to the one calculated from the model in Figure 2A as this model was estimated on the first 100 ms of the reconstruction.
Finally, we wished to test whether any correlation existed between semantic similarity and potentially confounding measures extracted from the raw EEG signal that might not be related to linguistic processing. We estimated the mean variance across channels in the EEG signal in the first 100 ms of each word and fit an LME model for this variable with semantic similarity. This returned a slope parameter estimate that was not significant (β = 0.043, SE = 0.13, p = 0.74). We also looked at the relationship between semantic similarity and channel-specific variances in the EEG signal, fitting an LME model to each channel. We found no significant relationship between semantic similarity and channel-specific EEG variance.
Next, we wanted to measure the relationship between semantic similarity and the influence of ocular artifacts on the EEG data as recent evidence suggests that such activity may pattern with cognitive activity (Jin et al., 2018). To investigate this, we ran independent component analysis on the raw EEG data for each subject (Hyvärinen, 1999) and identified the independent component related to eyeblinks for each subject based on weighting topographies. We calculated mean and SD of the time series of this IC for the first 100 ms of each word and regressed this quantity onto semantic similarity. We found no significant relationship between eye blinks and semantic similarity (β = 0.0023, SE = 0.0026, p = 0.39 for mean eyeblink magnitude and β = 7.4 × 10⁻⁴, SE = 1.1 × 10⁻³, p = 0.51 for eyeblink variance). We additionally included all mentioned measures as nuisance regressors in the second-stage linear model and found no change in βsem.
Semantic information interacts with tracking at different levels of the processing hierarchy
Cortical tracking can further be assessed by using a forward encoding model, or the TRF (Lalor and Foxe, 2010) to predict the EEG (Fig. 1B). This maps stimulus to response, predicting channel-specific neural responses from the speech input. This method can be advantageous as it provides an indication of scalp locations where interactions between high-level semantic information and low-level auditory processing are most prominent. Forward modeling can also use different multivariate representations of speech as input to the model. The most commonly used representation for this approach has been the speech envelope. However, recent work has shown that spectro-temporal and phonological representations of speech can improve EEG prediction accuracy (Di Liberto et al., 2015). The use of a forward model in tandem with our approach, therefore, gives the added benefit of indicating at which processing stage (spectral or phonological analysis) cortical activity is affected by semantic information. We created a TRF based on representing the speech signal as a combination of its spectrogram and a discrete set of time-aligned phonological features. This gives EEG predictions from which word prediction accuracies were derived. As before, a second-stage regression analysis was conducted to measure the strength of the relationship between a word's EEG prediction accuracy and its semantic similarity to context. The model weight of the semantic similarity variable β can now be described as a function of the time window by channel by speech representation.
Figure 3A (top row; FS) shows β plotted across all EEG channels for three time windows (0–100, 50–150, and 100–200 ms) and for a combined spectrogram and phonetic feature model. Black dots indicate the channels and time windows where β coefficients were significantly >0, after correcting for multiple comparisons. This revealed that interactions between semantic similarity and early auditory encoding were significant over frontocentral scalp regions.
Figure 3.

Forward modeling approach. A, Second-stage model semantic weights (βsem) plotted across all EEG channels for three time windows and for TRF inputs of spectrogram (bottom row), phonetic features (middle row), and combined spectrogram and phonetic features (top row). Black dots indicate the channels and time points where the βsem was significantly >0, after multiple-comparison correction (B). Time course of model βsem weights for spectrogram (blue), phonetic features (red), and combination (green) models for frontocentral electrodes. Top right, The channels selected for this region. C, Second-stage model semantic weights (βsem) for individual subject models, averaged across frontocentral electrodes and taken at time windows of 0–100 ms (left) and 100–200 ms (right). Post hoc test revealed significant differences between models in each time window: *p < 0.05, **p < 0.01, ***p < 0.001; after correction.
Next, we wished to determine the effect that semantic similarity to context may have on cortical tracking at the levels of spectrogram and phonetic feature processing in isolation. This was done by running the same second-stage model but including prediction accuracies from the spectrogram TRF or phonetic features TRF as reciprocal nuisance regressors to account for any variance related to processing at the other level. These models can be denoted as either FS-S (phonetic) or FS-F (acoustic). We have conducted similar analyses in the past (Di Liberto et al., 2018) to show that top-down prior information affects the processing of acoustically degraded speech specifically at the level of phonemes. As seen in Figure 3A (middle and bottom rows), the isolated phonetic features model shows similar β values to the combined model at earlier stages (0–50 and 50–150 ms windows) but relatively reduced β values in later windows, whereas the isolated spectrogram model shows an overall reduction in β. Figure 3B shows β as a function of time window center for frontocentral scalp electrodes.
To further test the robustness of this effect at an individual subject level, we constructed subject models through the same forward modeling pipeline based on individual subject EEG prediction accuracies. We looked at the β values, averaged across frontocentral channels, for the 3 models (isolated spectrogram, isolated phonetic features, combined) at an earlier stage and later stage after word onset. We chose 2 windows that were nonoverlapping in time (0–100 ms and 100–200 ms, respectively) to represent these two stages. Figure 3C shows boxplots of scalp mean β values for individual subjects for the 3 models and 2 time windows. We ran a two-way ANOVA with factors of model (spectrogram, FS-F; phonetic features, FS-S; combined FS) and time window (0–100 ms, 100–200 ms). We found significant main effects for model (F = 11.47, p < 0.05) and time window (F = 10.69, p < 0.05) and a significant interaction effect of model and time window (F = 3.49, p < 0.05). Due to the significant interaction effect, we further compared each model for the two separate time windows using paired t tests. Significant differences after FDR correction (Benjamini and Hochberg, 1995) are shown in Figure 3C. This indicates that peaks in β are being driven largely by the effect of semantic information and phonological processing. The significant interaction effect of time windows and model suggests a propagation of information through time from higher linguistic levels of processing to lower ones.
Impact of semantic similarity on tracking in θ band
The low-frequency EEG signal was further filtered into δ and θ bands to investigate the effect of semantic context on tracking in different frequency ranges. This was based on previous studies that have posited different roles in speech processing for the δ and θ bands (Ding et al., 2014).
The filtered EEG signal was put through the same backward and forward modeling pipelines as described above. Figure 4A shows β weights of individually fitted second-stage models for EEG filtered into δ and θ bands using the backward modeling approach. Results show that β values are significantly >0 for both bands (t = 3.52, p = 2.4 × 10⁻³ for δ and t = 6.69, p = 2.8 × 10⁻⁶ for θ; one-sample t test, N = 19) as well as a significant increase for β values derived from θ band cortical tracking compared with δ band (t = 3.24, p = 0.004, paired t test, N = 19). The forward modeling approach confirms these results. β weights for a group-level averaged second-stage model were higher for θ band compared with δ band. Topographical plots taken for time windows of 0–100 and 60–160 ms show significant β values over frontocentral electrodes for θ range, whereas β values related to δ band show activity over peripheral temporal electrodes.
Figure 4.
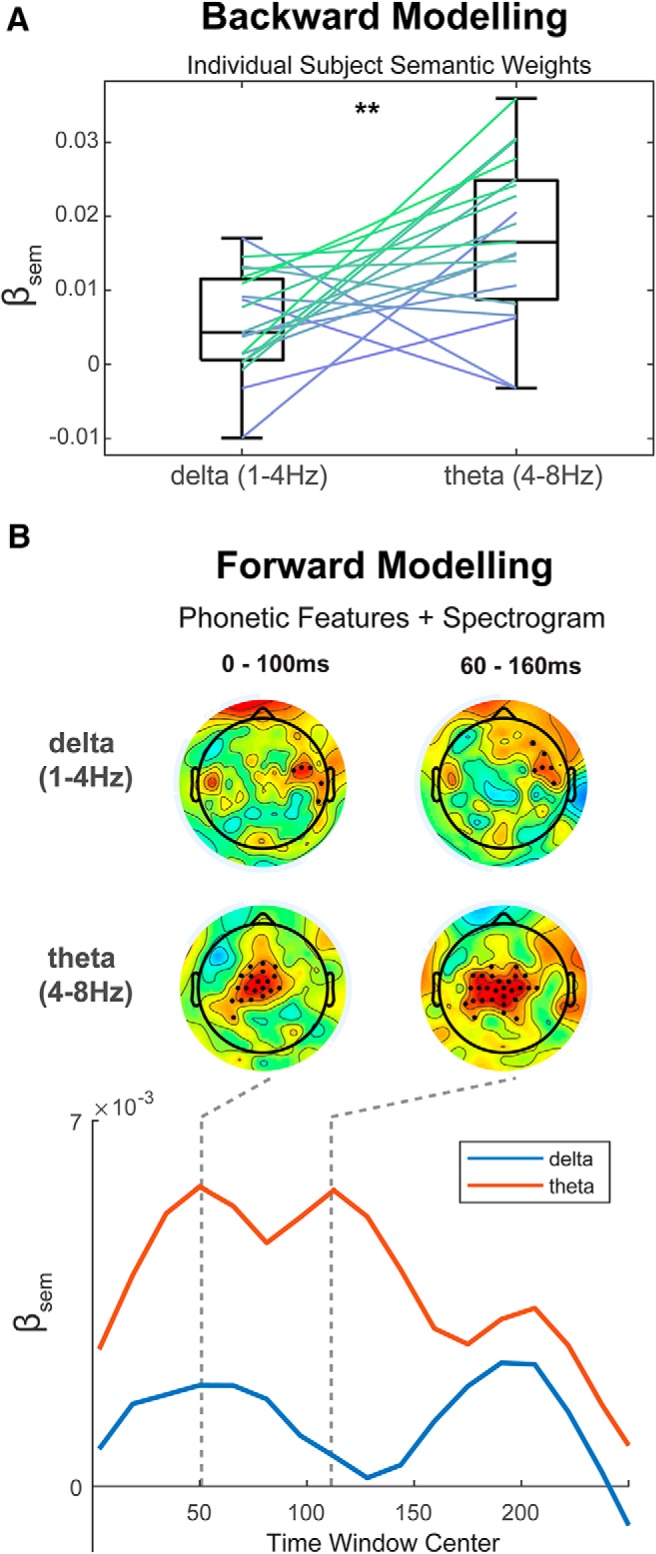
Effects of semantic similarity on tracking in different frequency bands. A, Backward model. Second-stage model semantic weights (βsem) for individual subject models show that semantic similarity has a larger effect on θ band (4–8 Hz) tracking than δ band (1–4 Hz). **p < 0.01. B, Forward model. Second-stage model semantic weights (βsem) for combined phonetic features and spectrogram TRF for δ and θ band filtered EEG. Topographical plots at time windows of 0–100 ms and 60–160 ms (top) show significant β values for θ band predominantly over frontocentral channels. Bottom, Time course of model β weights for θ (red) and δ (blue) bands average over frontocentral electrodes.
Discussion
In this study, we investigated the relationship between a word's similarity to its context and the neural processing of its acoustic and phonological features. We found that the more similar a word was to its context, the better it was encoded in the initial stages of its utterance. This is seen first in the backward modeling, where the reconstruction accuracy of a word's acoustic envelope is positively correlated with its semantic similarity. The result is mirrored by the forward modeling approach where the prediction of the EEG at the time of the word is higher for more semantically similar words. This suggests a mechanism that links top-down prior information with the early cortical entrainment of words.
Previous studies that look at the relationship between cortical activity and top-down information tend to involve paradigms where the acoustic information is masked, usually with noise, to vary intelligibility (Luo and Poeppel, 2007; Davis et al., 2011; Sohoglu et al., 2012; Ding and Simon, 2013; Ding et al., 2014). Although much insight has been gained from these studies, there are two main drawbacks to consider. First, changes in the intelligibility of the speech signal inevitably lead to changes in the acoustic properties of the same signal (Peelle et al., 2013). Thus, the observed decrease in δ and θ band tracking as a function of intelligibility could be due primarily to changes in the acoustic signal. Second, the change in a listener's attention for different levels of intelligibility could represent something of a confounding effect when considering the relationship between linguistic information and neural activity. Attention is known to modulate cortical tracking of speech (Zion Golumbic et al., 2013; O'Sullivan et al., 2015) and, therefore, could be the cause of differences in encoding measures rather than the intelligibility or linguistic content per se. Our method circumvents this confound by using natural continuous speech that does not change in its level of intelligibility. Furthermore, by implementing a general linear modeling approach, we can partially control for low-level acoustic factors of the speech signal by including them as predictor variables in the model. Subjects were instructed to engage with the audiobook, all reporting an enjoyment of the story. It is reasonable, therefore, to assume that no systematic, tonic attentional effects were influencing the auditory processing of the speech.
Better speech envelope reconstruction for words that are semantically similar to their context
The findings using the backward modeling show a significant relationship between a word's similarity to context and how well its speech envelope was reconstructed from the neural data (Fig. 2). The quality of reconstruction is taken to be a measure of how well that word was represented in or tracked by the cortex during the time of its presentation. Notably, the magnitude of this effect, measured by model fit R2 and β, is small. However, the dependent variable used for the regression is the neural signal measured for single spoken words with no averaged repetitions. It is therefore reasonable to expect low model fit and parameter values. Reconstructing the envelope from EEG usually produces accuracies ranging from 0.1 to 0.2 (O'Sullivan et al., 2015; Crosse et al., 2016a), revealing that a high proportion of the EEG signal is unrelated to the stimulus envelope. Permutation tests, whereby the semantic values for words are shuffled, provide a baseline distribution of our dependent measures. From this, we can see that our R2 and β values, though small, are significantly higher than would be expected by chance. Another striking feature of the interaction between semantic similarity and envelope tracking is its timing. Figure 2C shows that the enhancement of tracking due to context is strongest in the first 100 ms of a word's utterance. This implies that this interaction occurs rapidly and at a prelexical stage.
Semantic similarity differentially influences the encoding of the spectrogram and phonetic features of speech.
The forward modeling approach revealed that interactions between cortical tracking and semantic similarity were significant over frontocentral channels, within the first 100 ms of a word's utterance. Distinct aspects of this interaction emerged when different levels of the processing hierarchy were isolated. We showed that the processing of a word's phonetic features was more strongly affected by its similarity to context than the processing of its acoustic features and that early interactions between semantic information and tracking were likely attributable to this phonological processing. We also show that semantic information affects phonological processing at an earlier latency than acoustic processing. This is indicative of a top-down mechanism, where high-level semantic information propagates down through hierarchical levels, first activating representations associated with the phonetic features of the speech and then with the lower-level acoustic features. This finding is in line with studies showing how prior knowledge modulates activity in regions associated with higher-level processing, such as the inferior frontal gyrus, before regions associated with lower-level sensory processing (Sohoglu et al., 2012).
We also see that this top-down relationship is more prominent in the θ band filtered signal compared with the same signal filtered into the δ band. Previous studies have shown how θ band is largely implicated in the tracking of speech and how it is sensitive to changes in intelligibility (Luo and Poeppel, 2007; Ding et al., 2014).
We have shown that higher semantic similarity can improve the accuracy of the predicted EEG or reconstructed audio signal. However, what exact mechanism underlies this improvement? One possible explanation of our effects is that the EEG signal is capturing the preactivation of internal representations of predicted sounds or phonemes. In this framework, higher-level inferences predictively preactivate lower-level representations before the arrival of bottom-up auditory information (Kuperberg and Jaeger, 2016). This preactivation works to facilitate the processing of bottom-up input. A number of studies support this notion of predictive preactivation ranging from reading (Ehrlich and Rayner, 1981) to event-related potential studies (Federmeier and Kutas, 1999; DeLong et al., 2005). Complementary to this framework is the idea that predictive preactivation can influence the perception of phonemes when the auditory input is ambiguous (Warren, 1970). Studies using electrocorticography have shown how neural signatures of perceived items are represented in the brain after a subject is biased to hear them based on semantic context (Leonard et al., 2016). A recent MEG study using representational similarity analysis gives evidence for patterns of neural activity related to distinct, item-specific lexico-semantic predictions (Wang et al., 2018). These studies are in line with our findings supporting the notion that words more strongly related to their context, and hence more strongly preactivated, are represented better in the EEG signal. Furthermore, the impact of this preactivation appears to propagate down through the hierarchy over time, showing first an enhancement of phonological representations of the word, followed, more weakly, by an enhancement of acoustic representations.
An alternative explanation is related to the notion of resource allocation. Strauß et al. (2013) postulate that, under adverse listening conditions, the language system is forced to narrow its expectations about possible upcoming words due to the greater perceptual load in processing a noisy signal. Results of our study may align with this in suggesting a dynamic allocation of resources between the semantic and auditory systems to deal with the perceptual and cognitive loads of incoming words (Mattys et al., 2009). In Strauß et al. (2013), it was shown that a loaded auditory system leads to a deficit of processing for the semantic system. Our results indicate the same effect but in the opposite direction where a more loaded semantic system leads to reduced tracking of words in the auditory system. This cognitive load could be related to the amount of information carried by a word. Recent modeling studies reveal reading times and neural signals associated with the entropy of a word or how much information it bears (Frank, 2013; Brodbeck et al., 2018; Gwilliams et al., 2018). In the context of our study, words that are more dissimilar to their previous context will bear more information and thus will lead to a higher processing load on the semantic system. This will result in a reduction in auditory tracking of a word.
Finally, our results at first glance may appear at odds with what one might expect within a predictive coding framework (Rao and Ballard, 1999; Friston, 2005; Clark, 2013). Within this framework, it is believed that accurate prior knowledge leads to a reduction in error signal between top-down predictions and bottom-up sensory information, which results in an overall reduction in neural activity (Sohoglu et al., 2012). However, it is important to stress that we are not looking at the relationship between top-down information and the magnitude of neural activity but rather how accurately the neural activity represents the top-down prediction (Rao and Ballard, 1999). It is reasonable to expect that unpredictable words would lead to lower reconstruction/prediction accuracies because they are associated with both larger neural error signals and less accurate top-down neural signals. Here, our measure of word predictability is based on word2vec, which is shown to be a powerful model for capturing associations between words (Mikolov et al., 2013b). However, this is just one way to estimate the likelihood of upcoming words given their context. Future work will explore different language models to test the relationship between semantic expectation and auditory encoding of speech.
Footnotes
This work was supported by Irish Research Council Government of Ireland Postgraduate Scholarship scheme to M.P.B. and Science Foundation Ireland Career Development Award to E.C.L.
The authors declare no competing financial interests.
References
- Ahissar E, Nagarajan S, Ahissar M, Protopapas A, Mahncke H, Merzenich MM (2001) Speech comprehension is correlated with temporal response patterns recorded from auditory cortex. Proc Natl Acad Sci U S A 98:13367–13372. 10.1073/pnas.201400998 [DOI] [PMC free article] [PubMed] [Google Scholar]
- Aiken SJ, Picton TW (2008) Human cortical responses to the speech envelope. Ear Hear 29:139–157. 10.1097/AUD.0b013e31816453dc [DOI] [PubMed] [Google Scholar]
- Anderson AJ, Binder JR, Fernandino L, Humphries CJ, Conant LL, Aguilar M, Wang X, Doko D, Raizada RD (2017) Predicting neural activity patterns associated with sentences using a neurobiologically motivated model of semantic representation. Cereb Cortex 27:4379–4395. 10.1093/cercor/bhw240 [DOI] [PubMed] [Google Scholar]
- Badre D, Poldrack RA, Paré-Blagoev EJ, Insler RZ, Wagner AD (2005) Dissociable controlled retrieval and generalized selection mechanisms in ventrolateral prefrontal cortex. Neuron 47:907–918. 10.1016/j.neuron.2005.07.023 [DOI] [PubMed] [Google Scholar]
- Baroni M, Dinu G, Kruszewski G (2014) Don't count, predict! A systematic comparison of context-counting vs context-predicting semantic vectors. Proceedings of the 52nd Annual Meeting of the Association for Computational Linguistics, Baltimore, Maryland, Vol 1 Long Pap, pp 238–247. [Google Scholar]
- Benjamini Y, Hochberg Y (1995) Controlling the false discovery rate: a practical and powerful approach to multiple testing. J R Stat Soc B (Methodological) 57:289–300. [Google Scholar]
- Binder JR, Desai RH, Graves WW, Conant LL (2009) Where is the semantic system? A critical review and meta-analysis of 120 functional neuroimaging studies. Cereb Cortex 19:2767–2796. 10.1093/cercor/bhp055 [DOI] [PMC free article] [PubMed] [Google Scholar]
- Boersma P, Weenink D (2016) Praat: doing phonetics by computer [Computer program]. Version 6.0.20. Retrieved from http://www.fon.hum.uva.nl/praat/.
- Brodbeck C, Hong LE, Simon JZ (2018) Rapid transformation from auditory to linguistic representations of continuous speech. Curr Biol 28:3976–3983.e5. 10.1016/j.cub.2018.10.042 [DOI] [PMC free article] [PubMed] [Google Scholar]
- Broderick MP, Anderson AJ, Di Liberto GM, Crosse MJ, Lalor EC (2018) Electrophysiological correlates of semantic dissimilarity reflect the comprehension of natural, narrative speech. Curr Biol 28:803–809.e3. 10.1016/j.cub.2018.01.080 [DOI] [PubMed] [Google Scholar]
- Clark A. (2013) Whatever next? Predictive brains, situated agents, and the future of cognitive science. Behav Brain Sci 36:181–204. 10.1017/S0140525X12000477 [DOI] [PubMed] [Google Scholar]
- Crosse MJ, Di Liberto GM, Bednar A, Lalor EC (2016a) The multivariate temporal response function (mTRF) toolbox: a MATLAB toolbox for relating neural signals to continuous stimuli. Front Hum Neurosci 10:604. 10.3389/fnhum.2016.00604 [DOI] [PMC free article] [PubMed] [Google Scholar]
- Crosse MJ, Di Liberto GM, Lalor EC (2016b) Eye can hear clearly now: inverse effectiveness in natural audiovisual speech processing relies on long-term crossmodal temporal integration. J Neurosci 36:9888–9895. 10.1523/JNEUROSCI.1396-16.2016 [DOI] [PMC free article] [PubMed] [Google Scholar]
- Davis MH, Johnsrude IS (2003) Hierarchical processing in spoken language comprehension. J Neurosci 23:3423–3431. 10.1523/JNEUROSCI.23-08-03423.2003 [DOI] [PMC free article] [PubMed] [Google Scholar]
- Davis MH, Johnsrude IS (2007) Hearing speech sounds: top-down influences on the interface between audition and speech perception. Hear Res 229:132–147. 10.1016/j.heares.2007.01.014 [DOI] [PubMed] [Google Scholar]
- Davis MH, Ford MA, Kherif F, Johnsrude IS (2011) Does semantic context benefit speech understanding through “top-down” processes? Evidence from time-resolved sparse fMRI. J Cogn Neurosci 23:3914–3932. 10.1162/jocn_a_00084 [DOI] [PubMed] [Google Scholar]
- DeLong KA, Urbach TP, Kutas M (2005) Probabilistic word pre-activation during language comprehension inferred from electrical brain activity. Nat Neurosci 8:1117–1121. 10.1038/nn1504 [DOI] [PubMed] [Google Scholar]
- Delorme A, Makeig S (2004) EEGLAB: an open source toolbox for analysis of single-trial EEG dynamics including independent component analysis. J Neurosci Methods 134:9–21. 10.1016/j.jneumeth.2003.10.009 [DOI] [PubMed] [Google Scholar]
- DeWitt I, Rauschecker JP (2012) Phoneme and word recognition in the auditory ventral stream. Proc Natl Acad Sci U S A 109:E505–E514. 10.1073/pnas.1113427109 [DOI] [PMC free article] [PubMed] [Google Scholar]
- Di Liberto GM, O'Sullivan JA, Lalor EC (2015) Low-frequency cortical entrainment to speech reflects phoneme-level processing. Curr Biol 25:2457–2465. 10.1016/j.cub.2015.08.030 [DOI] [PubMed] [Google Scholar]
- Di Liberto GM, Crosse MJ, Lalor EC (2018) Cortical measures of phoneme-level speech encoding correlate with the perceived clarity of natural speech. eNeuro 5:ENEURO.0084–18.2018. 10.1523/ENEURO.0084-18.2018 [DOI] [PMC free article] [PubMed] [Google Scholar]
- Ding N, Simon JZ (2012a) Emergence of neural encoding of auditory objects while listening to competing speakers. Proc Natl Acad Sci U S A 109:11854–11859. 10.1073/pnas.1205381109 [DOI] [PMC free article] [PubMed] [Google Scholar]
- Ding N, Simon JZ (2012b) Neural coding of continuous speech in auditory cortex during monaural and dichotic listening. J Neurophysiol 107:78–89. 10.1152/jn.00297.2011 [DOI] [PMC free article] [PubMed] [Google Scholar]
- Ding N, Simon JZ (2013) Adaptive temporal encoding leads to a background-insensitive cortical representation of speech. J Neurosci 33:5728–5735. 10.1523/JNEUROSCI.5297-12.2013 [DOI] [PMC free article] [PubMed] [Google Scholar]
- Ding N, Chatterjee M, Simon JZ (2014) Robust cortical entrainment to the speech envelope relies on the spectro-temporal fine structure. Neuroimage 88:41–46. 10.1016/j.neuroimage.2013.10.054 [DOI] [PMC free article] [PubMed] [Google Scholar]
- Ehrlich SF, Rayner K (1981) Contextual effects on word perception and eye movements during reading. J Verbal Learn Verbal Behav 20:641–655. [Google Scholar]
- Federmeier KD, Kutas M (1999) A rose by any other name: long-term memory structure and sentence processing. J Mem Lang 41:469–495. 10.1006/jmla.1999.2660 [DOI] [Google Scholar]
- Frank SL. (2013) Uncertainty reduction as a measure of cognitive load in sentence comprehension. Top Cogn Sci 5:475–494. 10.1111/tops.12025 [DOI] [PubMed] [Google Scholar]
- Frank SL, Willems RM (2017) Word predictability and semantic similarity show distinct patterns of brain activity during language comprehension. Lang Cogn Neurosci 32:1192–1203. 10.1080/23273798.2017.1323109 [DOI] [Google Scholar]
- Friston K. (2005) A theory of cortical responses. Philos Trans R Soc Lond B Biol Sci 360:815–836. 10.1098/rstb.2005.1622 [DOI] [PMC free article] [PubMed] [Google Scholar]
- Garofolo JS, Lamel LF, Fisher WM, Fiscus JG, Pallett DS, Dahlgren NL, Zue V (1993) TIMIT Acoustic-phonetic Continuous Speech Corpus. Linguistic Data Consortium. Retrieved from https://catalog.ldc.upenn.edu/LDC93S1.
- Gorman K, Howell J, Wagner M (2011) Prosodylab-aligner: a tool for forced alignment of laboratory speech. Can Acoust 39:192–193. [Google Scholar]
- Greenwood DD. (1961) Auditory masking and the critical band. J Acoust Soc Am 33:484–502. [DOI] [PubMed] [Google Scholar]
- Gwilliams L, Poeppel D, Marantz A, Linzen T (2018) Phonological (un)certainty weights lexical activation. Proceedings of the 8th Workshop on Cognitive Modeling and Computational Linguistics (CMCL 2018), Salt Lake City, Utah, pp 29–34. [Google Scholar]
- Hale JT. (2001) A probabilistic Earley parser as a psycholinguistic model. Second Meeting of the North American Chapter of the Association for Computational Linguistics, Pittsburgh, Pennsylvania. [Google Scholar]
- Hemingway E. (1952) The old man and the sea. New York: Scribner's. [Google Scholar]
- Hickok G, Poeppel D (2007) The cortical organization of speech processing. Nat Rev Neurosci 8:393–402. 10.1038/nrn2113 [DOI] [PubMed] [Google Scholar]
- Huth AG, de Heer WA, Griffiths TL, Theunissen FE, Gallant JL (2016) Natural speech reveals the semantic maps that tile human cerebral cortex. Nature 532:453–458. 10.1038/nature17637 [DOI] [PMC free article] [PubMed] [Google Scholar]
- Hyvärinen A. (1999) Fast and robust fixed-point algorithms for independent component analysis. IEEE Trans Neural Netw 10:626–634. 10.1109/72.761722 [DOI] [PubMed] [Google Scholar]
- Jin P, Zou J, Zhou T, Ding N (2018) Eye activity tracks task-relevant structures during speech and auditory sequence perception. Nat Commun 9:5374. 10.1038/s41467-018-07773-y [DOI] [PMC free article] [PubMed] [Google Scholar]
- Khalighinejad B, Cruzatto da Silva G, Mesgarani N (2017) Dynamic encoding of acoustic features in neural responses to continuous speech. J Neurosci 37:2176–2185. 10.1523/JNEUROSCI.2383-16.2017 [DOI] [PMC free article] [PubMed] [Google Scholar]
- Kuperberg GR, Jaeger TF (2016) What do we mean by prediction in language comprehension? Lang Cogn Neurosci 31:32–59. 10.1080/23273798.2015.1102299 [DOI] [PMC free article] [PubMed] [Google Scholar]
- Kutas M, Hillyard SA (1980) Reading senseless sentences: brain potentials reflect semantic incongruity. Science 207:203–205. 10.1126/science.7350657 [DOI] [PubMed] [Google Scholar]
- Lalor EC, Foxe JJ (2010) Neural responses to uninterrupted natural speech can be extracted with precise temporal resolution. Eur J Neurosci 31:189–193. 10.1111/j.1460-9568.2009.07055.x [DOI] [PubMed] [Google Scholar]
- Leonard MK, Baud MO, Sjerps MJ, Chang EF (2016) Perceptual restoration of masked speech in human cortex. Nat Commun 7:13619. 10.1038/ncomms13619 [DOI] [PMC free article] [PubMed] [Google Scholar]
- Liebenthal E, Binder JR, Spitzer SM, Possing ET, Medler DA (2005) Neural substrates of phonemic perception. Cereb Cortex 15:1621–1631. 10.1093/cercor/bhi040 [DOI] [PubMed] [Google Scholar]
- Lieberman P. (1963) Some effects of semantic and grammatical context on the production and perception of speech. Lang Speech 6:172–187. 10.1177/002383096300600306 [DOI] [Google Scholar]
- Lin M, Lucas HC (2013) Too big to fail: large samples and the p value problem. Inf Syst Res 7047:1–12. [Google Scholar]
- Luo H, Poeppel D (2007) Phase patterns of neuronal responses reliably discriminate speech in human auditory cortex. Neuron 54:1001–1010. 10.1016/j.neuron.2007.06.004 [DOI] [PMC free article] [PubMed] [Google Scholar]
- Maris E, Oostenveld R (2007) Nonparametric statistical testing of EEG- and MEG-data. J Neurosci Methods 164:177–190. 10.1016/j.jneumeth.2007.03.024 [DOI] [PubMed] [Google Scholar]
- Mattys SL, Brooks J, Cooke M (2009) Recognizing speech under a processing load: dissociating energetic from informational factors. Cogn Psychol 59:203–243. 10.1016/j.cogpsych.2009.04.001 [DOI] [PubMed] [Google Scholar]
- McClelland JL, Elman JL (1986) The TRACE model of speech perception. Cogn Psychol 18:1–86. 10.1016/0010-0285(86)90015-0 [DOI] [PubMed] [Google Scholar]
- Mesgarani N, David SV, Fritz JB, Shamma SA (2009) Influence of context and behavior on stimulus reconstruction from neural activity in primary auditory cortex. J Neurophysiol 102:3329–3339. 10.1152/jn.91128.2008 [DOI] [PMC free article] [PubMed] [Google Scholar]
- Mesgarani N, Cheung C, Johnson K, Chang EF (2014) Phonetic feature encoding in human superior temporal gyrus. Science 343:1006–1010. 10.1126/science.1245994 [DOI] [PMC free article] [PubMed] [Google Scholar]
- Mikolov T, Chen K, Corrado G, Dean J (2013a) Efficient estimation of word representations in vector space. International Conference on Learning Representations (ICLR) Workshop, Scottsdale, AZ. [Google Scholar]
- Mikolov T, Chen K, Corrado G, Dean J (2013b) Distributed representations of words and phrases and their compositionality. Proceedings of the 26th International Conference on Neural Information Processing Systems, Lake Tahoe, Nevada, pp 3111–3119. [Google Scholar]
- Miller GA, Heise GA, Lichten W (1951) The intelligibility of speech as a function of the context of the test materials. J Exp Psychol 41:329–335. 10.1037/h0062491 [DOI] [PubMed] [Google Scholar]
- Norman-Haignere S, Kanwisher N, McDermott JH (2013) Cortical pitch regions in humans respond primarily to resolved harmonics and are located in specific tonotopic regions of anterior auditory cortex. J Neurosci 33:19451–19469. 10.1523/JNEUROSCI.2880-13.2013 [DOI] [PMC free article] [PubMed] [Google Scholar]
- Norris D, McQueen JM, Cutler A (2000) Merging information in speech processing: feedback is never necessary. Behav Brain Sci 23:299–370. 10.1017/S0140525X00003241 [DOI] [PubMed] [Google Scholar]
- Oganian Y, Chang EF (2018) A speech envelope landmark for syllable encoding in human superior temporal gyrus. biorxiv. Advance online publication. Retrieved August 9, 2018. doi: 10.1101/388280. [DOI] [PMC free article] [PubMed] [Google Scholar]
- O'Sullivan JA, Power AJ, Mesgarani N, Rajaram S, Foxe JJ, Shinn-Cunningham BG, Slaney M, Shamma SA, Lalor EC (2015) Attentional selection in a cocktail party environment can be decoded from single-trial EEG. Cereb Cortex 25:1697–1706. 10.1093/cercor/bht355 [DOI] [PMC free article] [PubMed] [Google Scholar]
- Peelle JE. (2018) Listening effort. Ear Hear 39:204–214. 10.1097/AUD.0000000000000494 [DOI] [PMC free article] [PubMed] [Google Scholar]
- Peelle JE, Gross J, Davis MH (2013) Phase-locked responses to speech in human auditory cortex are enhanced during comprehension. Cereb Cortex 23:1378–1387. 10.1093/cercor/bhs118 [DOI] [PMC free article] [PubMed] [Google Scholar]
- Poeppel D. (2014) The neuroanatomic and neurophysiological infrastructure for speech and language. Curr Opin Neurobiol 28:142–149. 10.1016/j.conb.2014.07.005 [DOI] [PMC free article] [PubMed] [Google Scholar]
- Power AJ, Foxe JJ, Forde EJ, Reilly RB, Lalor EC (2012) At what time is the cocktail party? A late locus of selective attention to natural speech. Eur J Neurosci 35:1497–1503. 10.1111/j.1460-9568.2012.08060.x [DOI] [PubMed] [Google Scholar]
- Pynte J, New B, Kennedy A (2009) On-line contextual influences during reading normal text: the role of nouns, verbs and adjectives. Vision Res 49:544–552. 10.1016/j.visres.2008.12.016 [DOI] [PubMed] [Google Scholar]
- Rao RP, Ballard DH (1999) Predictive coding in the visual cortex: a functional interpretation of some extra-classical receptive-field effects. Nat Neurosci 2:79–87. 10.1038/4580 [DOI] [PubMed] [Google Scholar]
- Smith NJ, Levy R (2013) The effect of word predictability on reading time is logarithmic. Cognition 128:302–319. 10.1016/j.cognition.2013.02.013 [DOI] [PMC free article] [PubMed] [Google Scholar]
- Sohoglu E, Peelle JE, Carlyon RP, Davis MH (2012) Predictive top-down integration of prior knowledge during speech perception. J Neurosci 32:8443–8453. 10.1523/JNEUROSCI.5069-11.2012 [DOI] [PMC free article] [PubMed] [Google Scholar]
- Strauß A, Kotz SA, Obleser J (2013) Narrowed expectancies under degraded speech: revisiting the N400. J Cogn Neurosci 25:1383–1395. 10.1162/jocn_a_00389 [DOI] [PubMed] [Google Scholar]
- Teoh ES, Cappelloni MS, Lalor EC (2019) Prosodic pitch processing is represented in delta band EEG and is dissociable from the cortical tracking of other acoustic and phonetic features. European Journal of Neuroscience. Advance online publication. Retrieved July 9, 2019. doi: 10.1111/ejn.14510. [DOI] [PubMed] [Google Scholar]
- Travis KE, Leonard MK, Chan AM, Torres C, Sizemore ML, Qu Z, Eskandar E, Dale AM, Elman JL, Cash SS, Halgren E (2013) Independence of early speech processing from word meaning. Cereb Cortex 23:2370–2379. 10.1093/cercor/bhs228 [DOI] [PMC free article] [PubMed] [Google Scholar]
- Wang L, Kuperberg G, Jensen O (2018) Specific lexico-semantic predictions are associated with unique spatial and temporal patterns of neural activity. eLife 7:e39061. 10.7554/eLife.39061 [DOI] [PMC free article] [PubMed] [Google Scholar]
- Warren RM. (1970) Perceptual restoration of missing speech sounds. Science 167:392–393. 10.1126/science.167.3917.392 [DOI] [PubMed] [Google Scholar]
- Zion Golumbic EM, Ding N, Bickel S, Lakatos P, Schevon CA, McKhann GM, Goodman RR, Emerson R, Mehta AD, Simon JZ, Poeppel D, Schroeder CE (2013) Mechanisms underlying selective neuronal tracking of attended speech at a “cocktail party.” Neuron 77:980–991. 10.1016/j.neuron.2012.12.037 [DOI] [PMC free article] [PubMed] [Google Scholar]