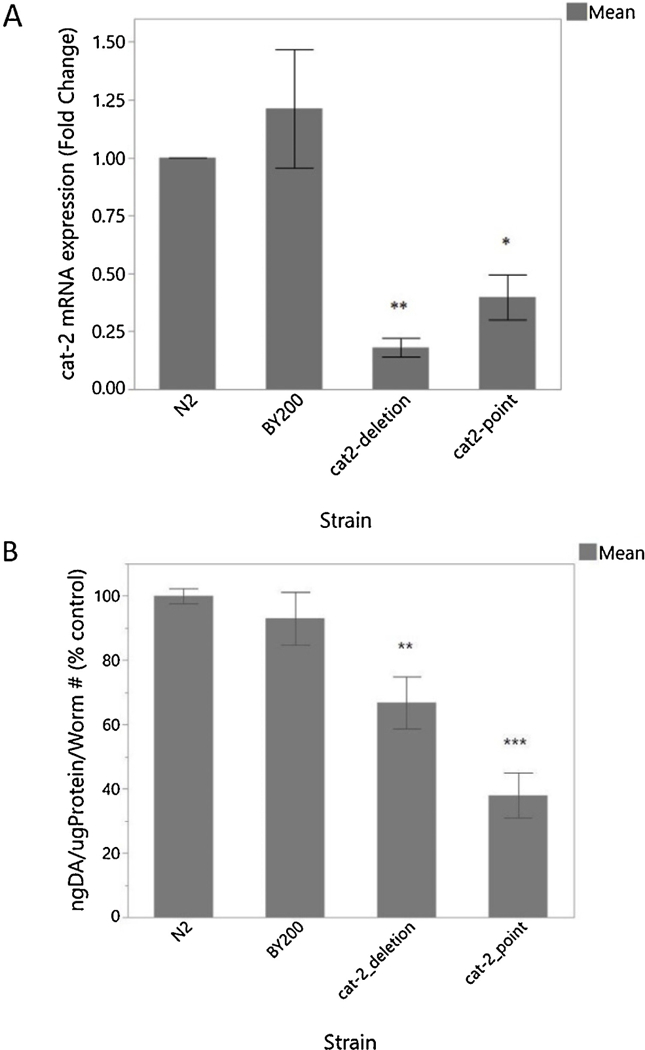
Figure 7 -.

Molecular characterization of BY200 and DA-deficient strains. – (A) RT-PCR mRNA quantification of cat-2 gene expression. (B) ELISA quantification of DA content. RT-PCR was completed with 5 biological replicates and ELISA was completed with 4 biological replicates. (A) n=201-way ANOVA Strain p=0.0002; Student t-test [N2 vs.cat-2_deletion p=0.0007; N2 vs. cat− 2_point p=0.0073]. (B) n=59 1-way ANOVA Strain p<0.0001; Student t-test [N2 vs. cat-2_point p<0.0001; N2 vs. cat-2_deletion p=0.0043].
